That’s an interesting thought. The United States Senate has two senators for each state, while the US House is propotionally represented. While an urban state like New York State recieves 29 representives, we only get two senators, a rural state like Vermont recieves only 1 representive and 2 senators.
In theory, that would mean a rural state like Vermont, Wyoming, North Dakota, or even Iowa would have have a disproptionate impact on the legislation through the US Senate. While it’s true that such states have more of a voice in the US Senate, it’s not clear rural residents get more representation in the US Senate.
Why not? For one thing, US Senate districts are larger. Much larger, typically covering whole states. The problem is that by representing complete states, every senator represents both urban and rural areas, and in most states, urban populations outnumber rural portions of states.
If any thing, urban consituencies have more power in the US Senate then the US House. There are representives in US House Districts that are predominately rural, in contrast to even rural states, where population is dominated by urban centers — such as Burlington, Vermont.
Census Block Equivalency – A list of census blocks in each district, generated by the commerical GIS program (such as Mapitude) used for redistricting.
Metes and Bounds – A legal description of each district, used in resolving court disputes over district boundaries, and assisting board of elections on where to put voters whose property might be crossed by a Census block
If you planning on making a map, Metes and Bounds won’t be particularly useful. Computers don’t understand english very well, they need numbers and lists. In contrast, the Census Block Equivalency is very useful for mapping things.
Every year, the Census Bureau puts out series of ERSI Shapefiles known as TIGER/Line. You can download TIGER/Line for any state and county in the United States from their website. They provide many different shapefiles and layers such as a Highway, Faces, Edges, and County Subdivision layers, however the one you will be most interested for making district maps is the Tabulation Block (tabblock) layer.
You can use these files in the free program known as Quantum GIS or QGIS. While this tutorial will not explain the ins and outs of QGIS, this should get you started on making redistricting maps.
The Tabulation Block Layer is the file containing all of the Census Blocks for a particular county. A Census Block is the smallest unit of population gathered by Census Block, and consists of all bordering features (bounds) — roads, rivers, shorelines, along with all imaginary lines (metes) — town lines, village lines, other lines drawn for statisitical purposes.
Each Census Block has a number, that is a subdivision of the Census Block, County ID, and State ID that it resides within. For example, the Governor’s Mansion in Albany is located in Census Block 2000 in Census Track 23.00 (zero padded to 002300) in Albany County (Federal Information Processing Standard — FIPS ID: 01) which is in NY State (FIPS ID: 36). County subdivisions are not applied to Census Tract Numbers, as they may in some cases cross county subdivisions, as is the case of smaller districts.
You put those numbers together to get the GEOID — which is the key used for redistricting block lists and most other block-level census data. The Governor’s Mansion is located at a block with a GEOID 360010023002000.
36
001
002300
2000
State ID
County ID
Zero Padded Census Tract Number
Census Block Number
The block list you get from a redistricting commission typically is in Database Exchange Format (.DBF) or Comma Deliminated Format (.CSV) which are both openable by common spreadsheet applications like Microsoft Excel or OpenOffice Spreadsheet and GIS programs like ArcGIS or Quantum GIS.
This is taken from the LATFOR State Senate Proposed Districts (January 2012) DBF file. It shows you that the Governor resides in Proposed Senate District 44. Across the river in Census Block 4010, Census Tract 524.03, in Rensselear County (FIPS ID 83), NY State (FIPS ID: 36) is located in Proposed Senate District 43.
360010023002000
SD44
360010021002008
SD44
360010021002004
SD44
360010021002001
SD44
360830524034017
SD43
360830524034010
SD43
Download the TIGER/line “Tabulation Block” Shpaefile file for the district you are interested in. You will want the 2010 version. You can download a state-wide tabulation block file, however that is not recommended as the next step will be impossibly slow on most computers. You may also want to open the .CSV or .DBF file in your spreadsheet program and cut out the county you want to speed things up.
You will then want to open up the file in Quantum GIS. You will get a nice map of the county you downloaded, showing all of the Census Blocks.
From there, go to the Vector -> Join Attributes submenu.
Make sure that the Target vector layer matches the Tabulation Block Shapefile you wish to join against, then set Target join field to GEOID10 .
Select click Join dbf table and select the DBF or CSV file you wish to join.
Change the Join field to BLOCK or whatever the GEOID is titled in your redistricting block file.
Enter in a location to save the Output Shapefile
Click okay.
Then wait. A typical county will take 10-40 minutes to join on my 5 year old laptop; your computer may be quicker. If you have a dual processor machine, go on to doing other work in other programs. You will end up with a map that looks like this (stylized for your enjoyment). Each block will be assigned a Senate District (in this example).
Halfway there. Now you need to “dissolve” each Census Block into it’s larger political district. Go to Vector -> Geoprocessing Tools -> Dissolve . Set the Input vector layer to the file you previously joined. Then set the Dissolve field to the field containing the district number — such as DISTRICTID or whatever it is named. Enter a name to safe the file. Click Dissolve.
Outputed will be a Shapefile containing all the political districts in the county you joined and dissolved. This will take 5-20 minutes on my laptop. Other data may exist in that file, such as Census Block number, however at this point that data will be invalid, as only the district number is accurately preserved in such a join. All other data will be picked at random, so delete those columns.
I hope this is helpful. If you just want the Proposed State Senate or State Assembly Districts you can download them from Center for Urban Research. These are the same data, joined using the above process by somebody with a much faster computer. I have also made up a Shapefile containing the Albany County Legislative Districts using this process.
About a year ago, in the Capital Region Solid Waste Plan, the City of Albany proposed creating a mega-solid waste authority to manage the Solid Waste for most of the Eastern Half of New York State. The plan specifically called for creating a regional authority — to service up to nine counties, and cover an area of 100 miles from the center point of the Rapp Road Landfill.
So I decided to make a map, and run some numbers…
100 square miles equals roughly 30,500 square miles, with 21,500 sq miles in New York State and 9,000 sq miles out of State — primarily Southern Vermont, but also most of Western Massachussets, roughly 3/4th of Connecicut, and part of Pennsylvania in the Poconos.
In contrast to 30,500 square miles, Adirondack Park “Blue Line” covers roughly 9,100 sq miles in NY State and the Catskill Park “Blue Line” covers roughly 1,100 sq miles. That includes all land within those parks, publicly and privately owned.
That area, within NY State, covers an area were 2,957,993 persons reported residing in the 2010 census.
That is 2.95 million people, or almost 3 million people, a population greater then Manhattan at 1.5 million persons, and even Brooklyn at 2.5 million.
While no one town or city in the proposed in Authorty is particularly large — the City of Albany is the largest population center at 97,856 followed by Colonie at 81,591, the reality is those numbers add up, when you include the 406 towns and cities in NY State that fall within the 100 mile distance from the Rapp Road Landfill.
Large Cities and Towns in Proposed Authority.
Town /City
Population
Albany city
97,856
Colonie town
81,591
Schenectady city
66,135
Utica city
62,235
Troy city
50,129
Poughkeepsie town
43,341
Cortlandt town
41,592
Monroe town
39,912
Clifton Park town
36,705
Yorktown town
36,081
Guilderland town
35,303
Carmel town
34,305
Rome city
33,725
Bethlehem town
33,656
Poughkeepsie city
32,736
Warwick town
32,065
Newburgh town
29,801
Glenville town
29,480
Rotterdam town
29,094
All Towns and Cities in NY State within 100 miles of Rapp Road Landfill.
Here is entire list of towns partially or wholely contained in the proposed jurisdiction of the Albany Solid Waste Authority (including large cities and towns listed above)…
All figures are in acres except where noted. Table updated April 2011. Reprinted from the DEC Website.
Land Classification
Region
1
Region
2
Region
3
Region
4
Region
5
Region
6
Region
7
Region
8
Region
9
Catskill
Park Total
Adirondack
Park Total
State
Total
Percent of Total
State Land and
Conservation
Easements
State Forest
16,056
758
31,763
102,248
58,354
221,924
200,419
55,581
99,121
–
16,264 **
786,224
17%
Forest
Preserve
Wilderness
–
–
89,352
53,482
954,601
206,151
–
–
–
142,834
1,160,752
1,303,586
28%
Wild Forest
–
–
75,588
60,368
938,664 **
367,123
–
–
–
135,956
1,305,787
1,441,743
31%
Primitive
–
–
–
–
31,309
15,704
–
–
–
–
47,013
47,013
1%
Primitive Bicycle
Corridor
–
–
15
283
–
–
–
–
–
298
–
298
0.006%
Canoe
–
–
–
–
18,989
–
–
–
–
–
18,989
18,989
0.4%
Intensive Use
–
–
4,104
1,542
21,591
1,828
–
–
–
5,646
23,419
29,065
0.6%
Administrative
–
–
392
0 ***
384
7
–
–
–
392
391
783
0.02%
Historic
–
–
–
–
531
–
–
–
–
–
531
531
0.01%
Pending
Classification
–
–
–
–
259
111
–
–
–
–
370
370
0.007%
Under Water*
(Unclassified)
–
–
–
–
17,395
6,534
–
–
–
–
23,929
23,929
0.5%
Detached
Parcel
–
–
1,382
4,141
1,441
4,318
–
–
–
–
–
11,282
0.2%
Total Forest Preserve
–
–
170,833
119,816
2,001,313
601,776
–
–
–
285,126
2,597,267
2,893,738
61%
Wildlife Management Area
6,007
–
12,021
18,518
6,524 **
46,371
49,562
41,462
17,178
407 ***
2,755 **
197,643
4%
Conservation Easement
108
21
7,264
7,286
488,463
336,783
436
–
10
9,437
769,579
840,371
18%
TOTALS:
22,171
779
221,881
247,868
2,554,654
1,206,854
250,417
97,043
116,309
294,970
3,385,865
4,717,976
100%
Notes from the DEC.
* Certain lake beds are considered Forest Preserve, despite some level of private ownership adjacent to the lakes. These underwater lands are not classified. For the purposes of this table, however, lakes and ponds that are completely surrounded by Forest Preserve have been classified the same as the adjacent land.
** Where State Forests and Wildlife Management Areas exist within the Adirondack Park, the Adirondack Park State Land Master Plan also classifies these lands as Wild Forest. However, since these lands are not Forest Preserve, State Forest and Wildlife Management Area acreages within the Adirondack Park were NOT included in the Wild Forest category.
*** Where Wildlife Management Areas exist within the Catskill Park, the Catskill Park State Land Master Plan also classifies these lands as Administrative. For calculation purposes in this table, however, Wildlife Management Area acreage within the Catskill Park was NOT also included in the Administrative category.
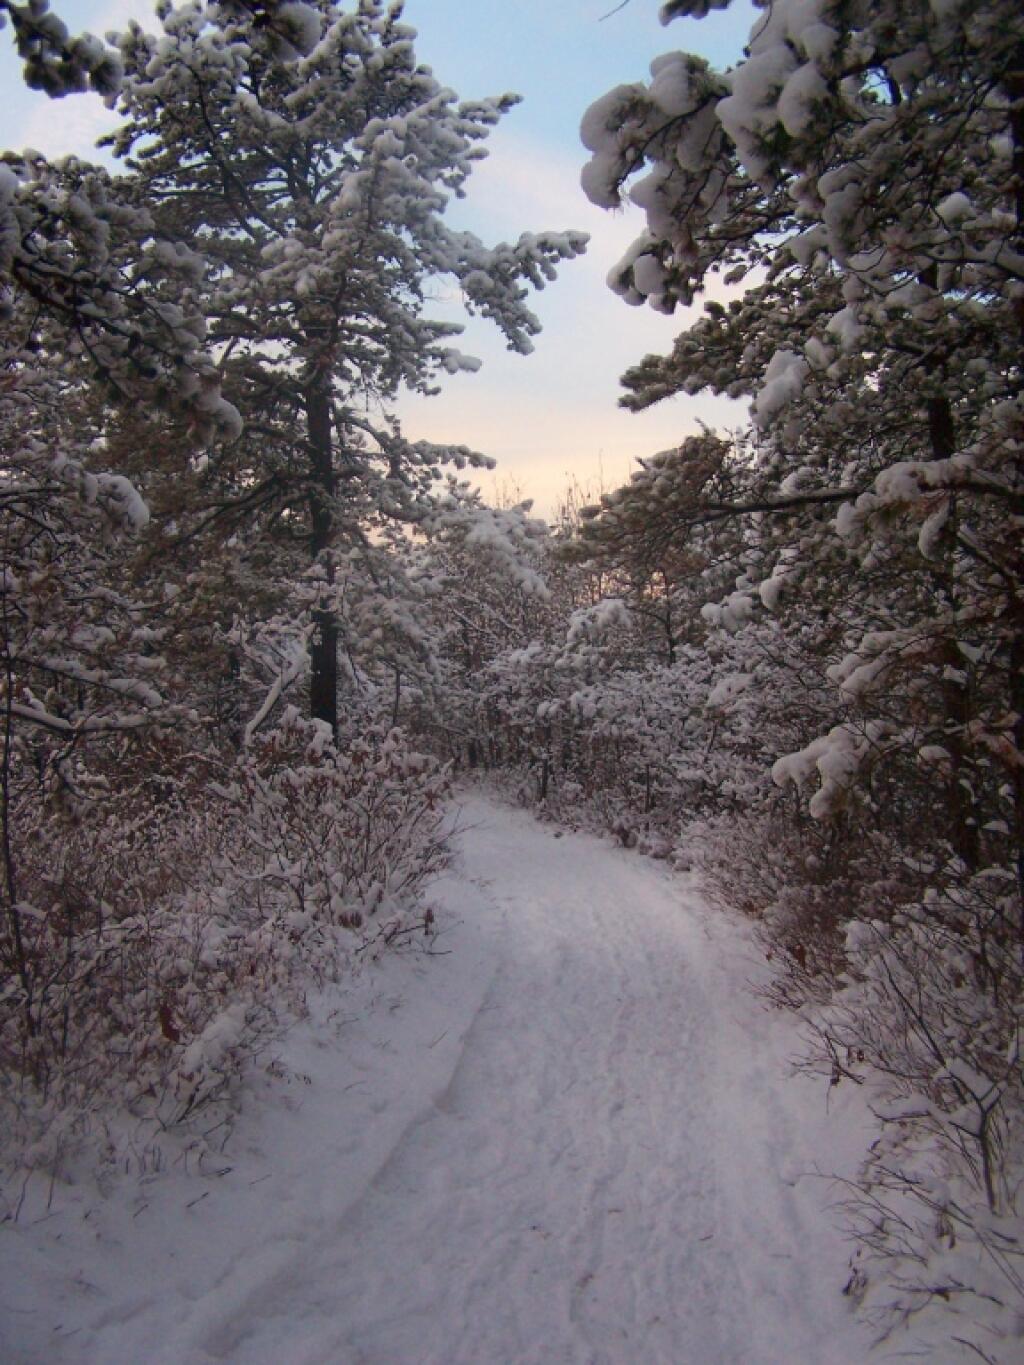
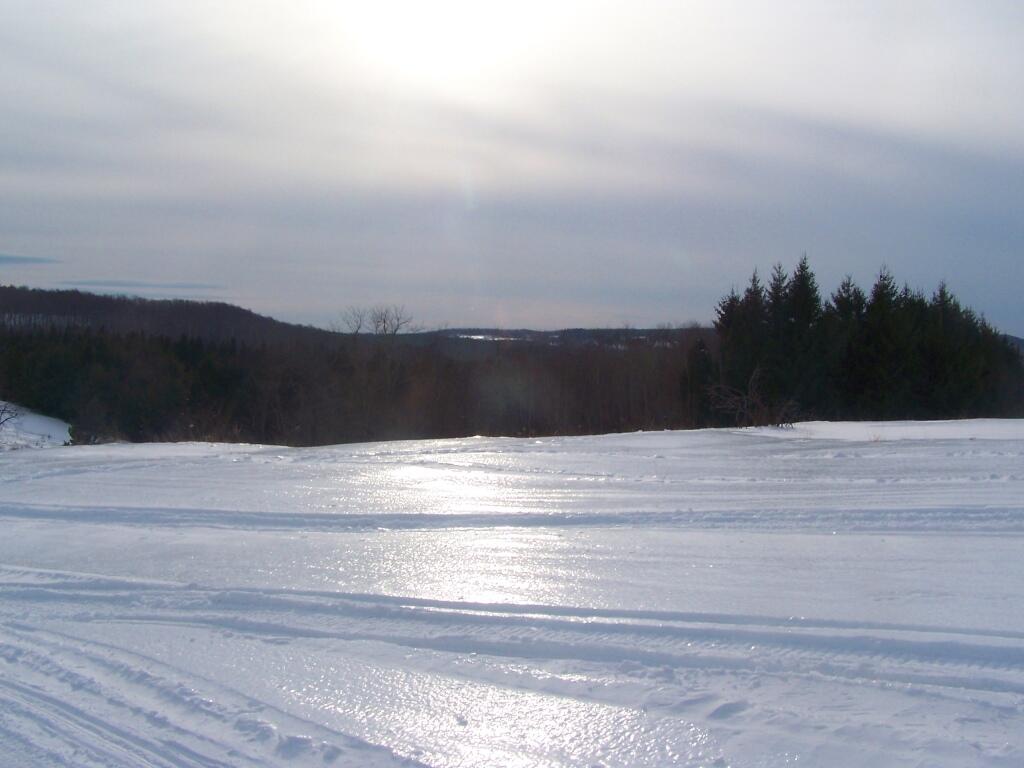
After a fresh snow fall it was a winter wonderland in the Albany Pine Barriens, a forever wild ecosystem on the outskirts of the city. It felt like one was walking through a marshmallow forest.
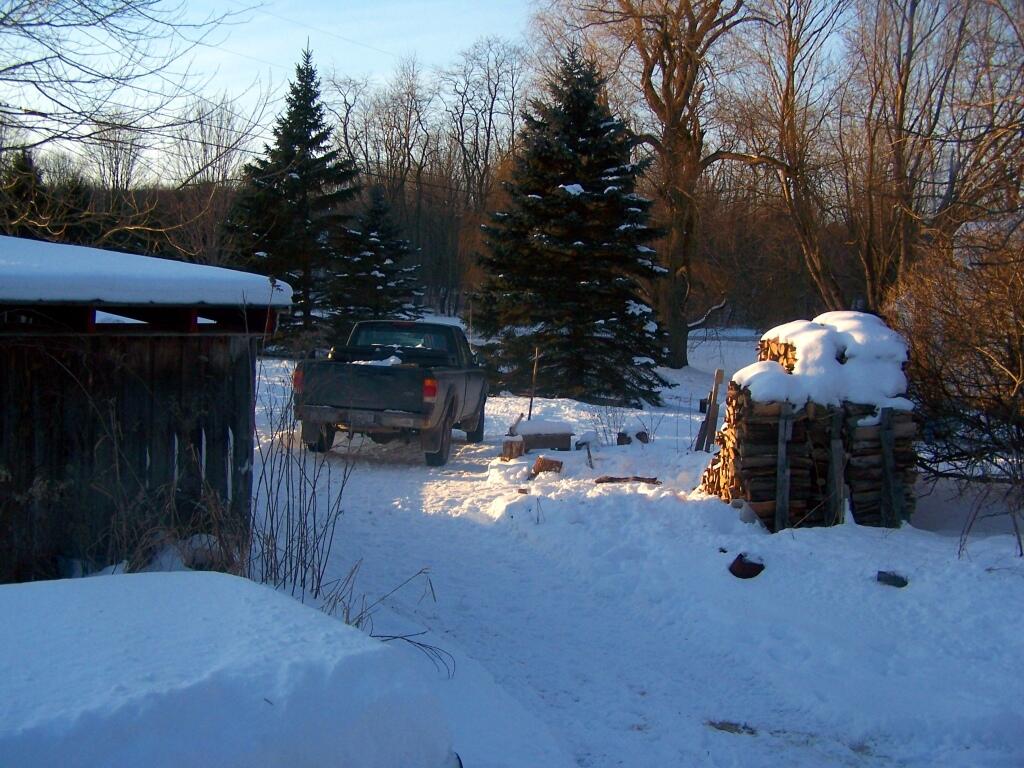
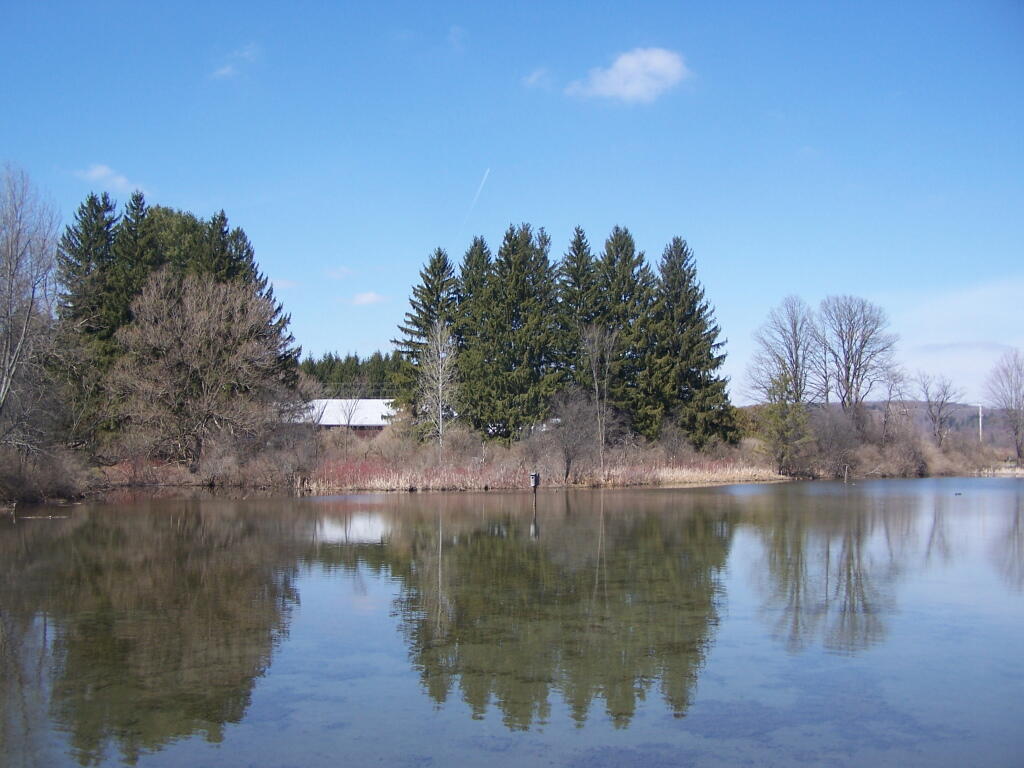
A cold winters day at my parents house in late January, after a long cold spell that never seemed to want to end.
February.
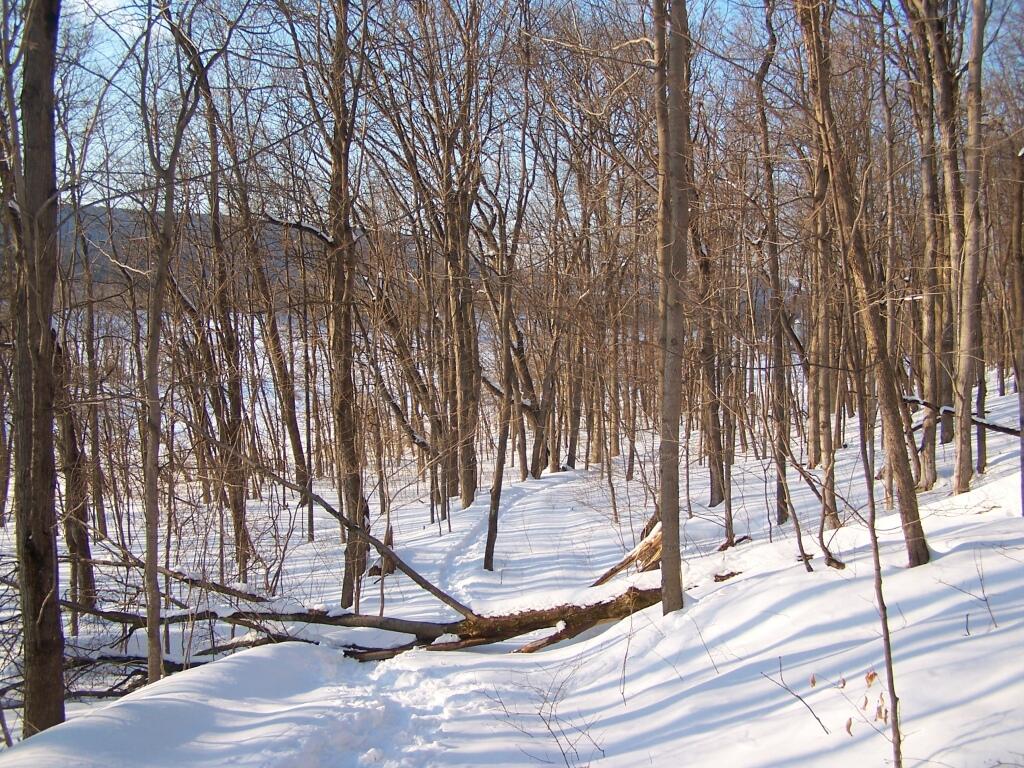
A icy sheen shown on the snow at Partridge Run, as I went for an afternoon walk with the dogs up there in the middle of the month.
Snowshoeing back down Bennett Hill in late February.
March.
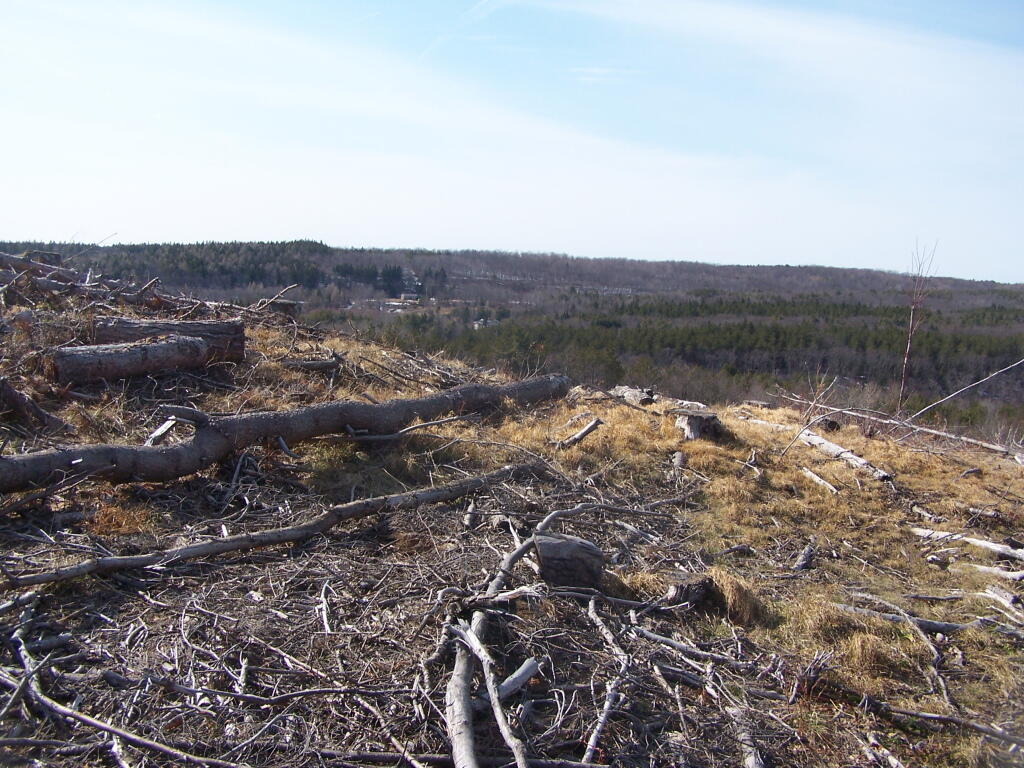
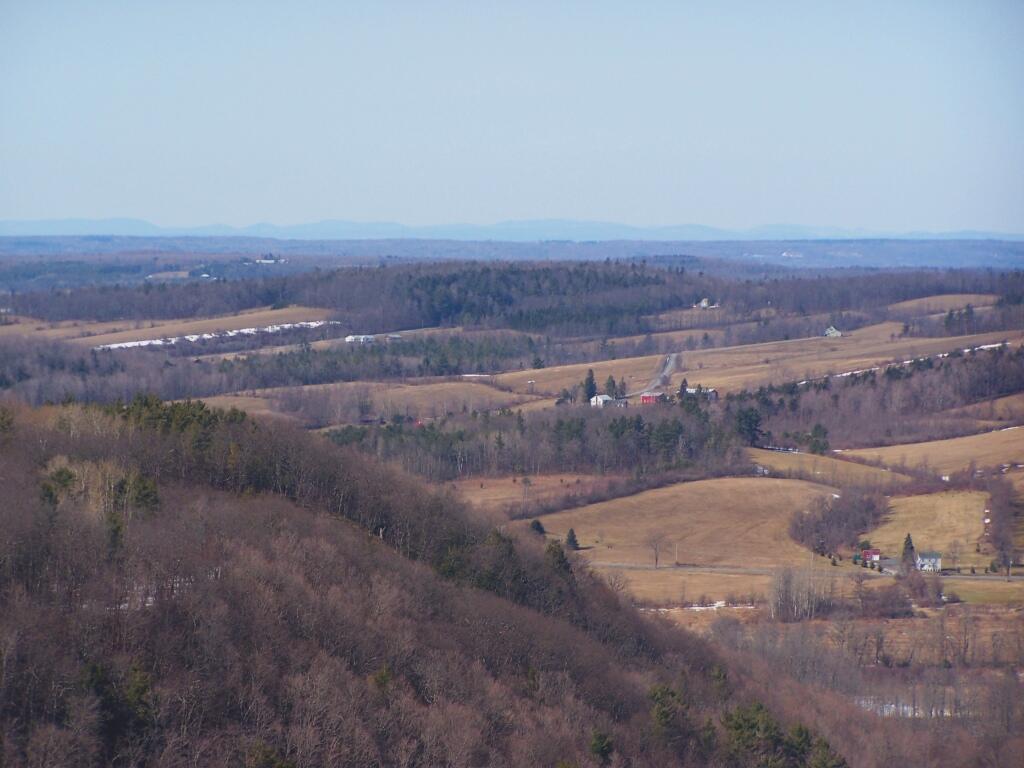
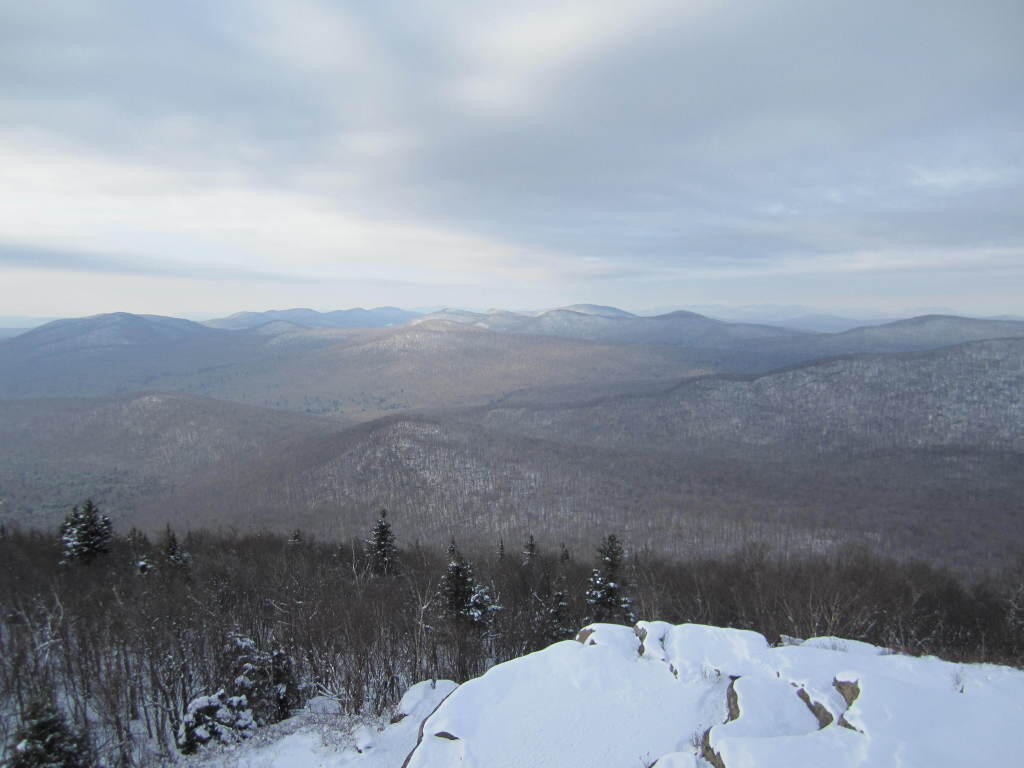
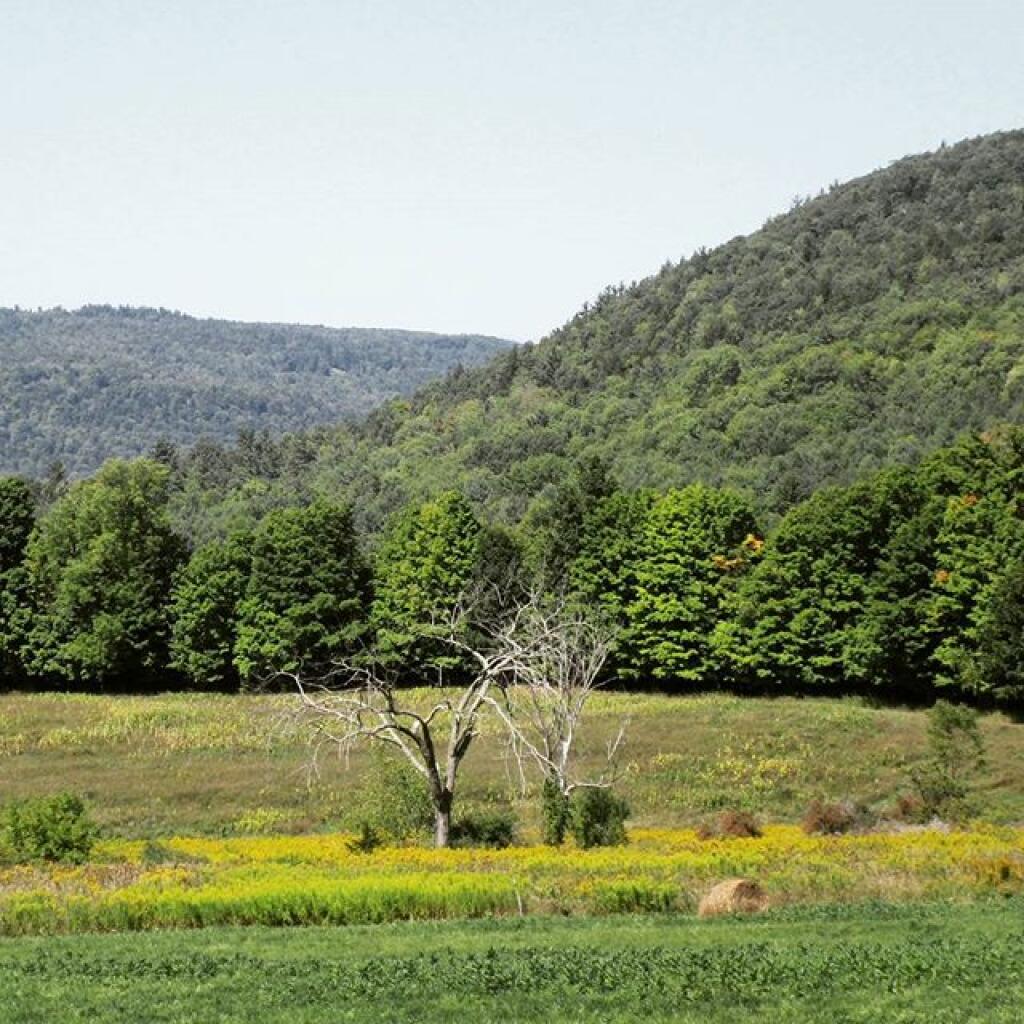
A recently logged section of Cole Hill provided breath-taking views of Irish Hill and the Fox Kill Valley down in Berne.
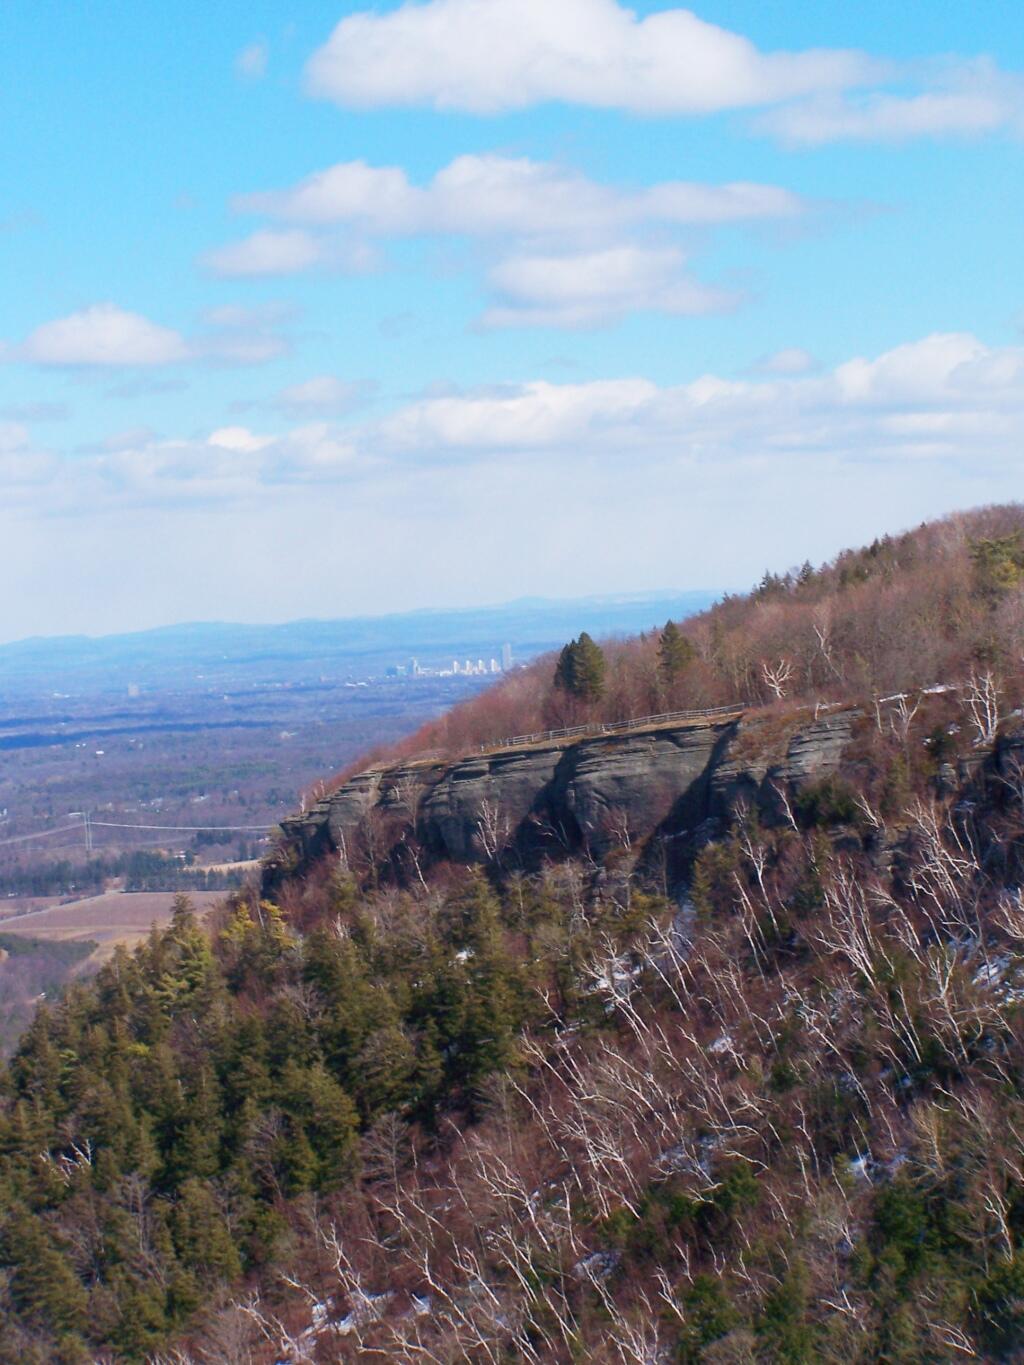
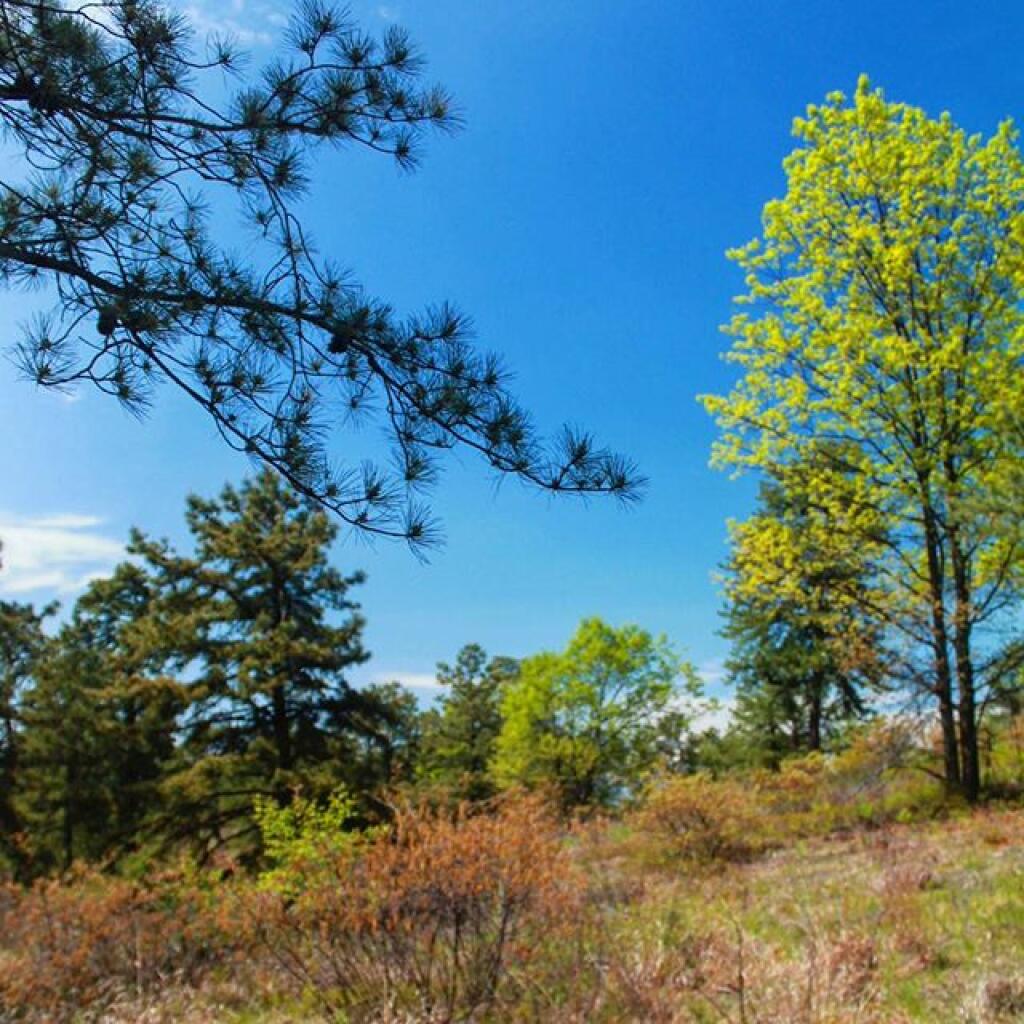
What a clear spring day up at Horseshoe Clove at Thacher Park. Warmer, nicer days can’t be far way.
April.
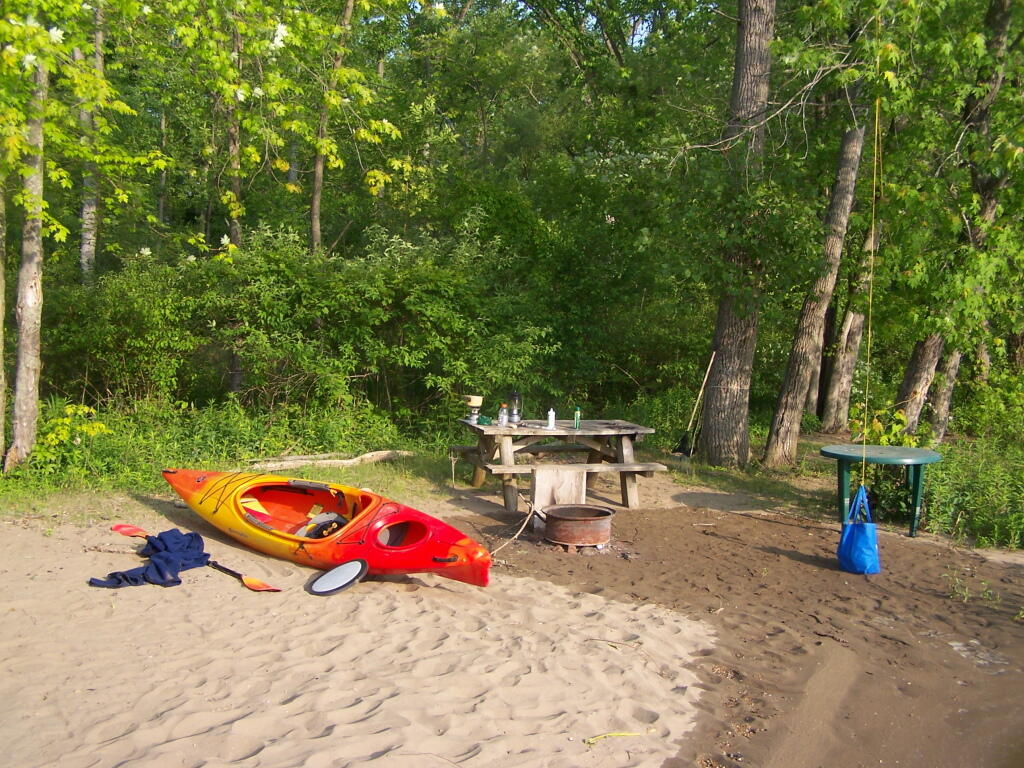
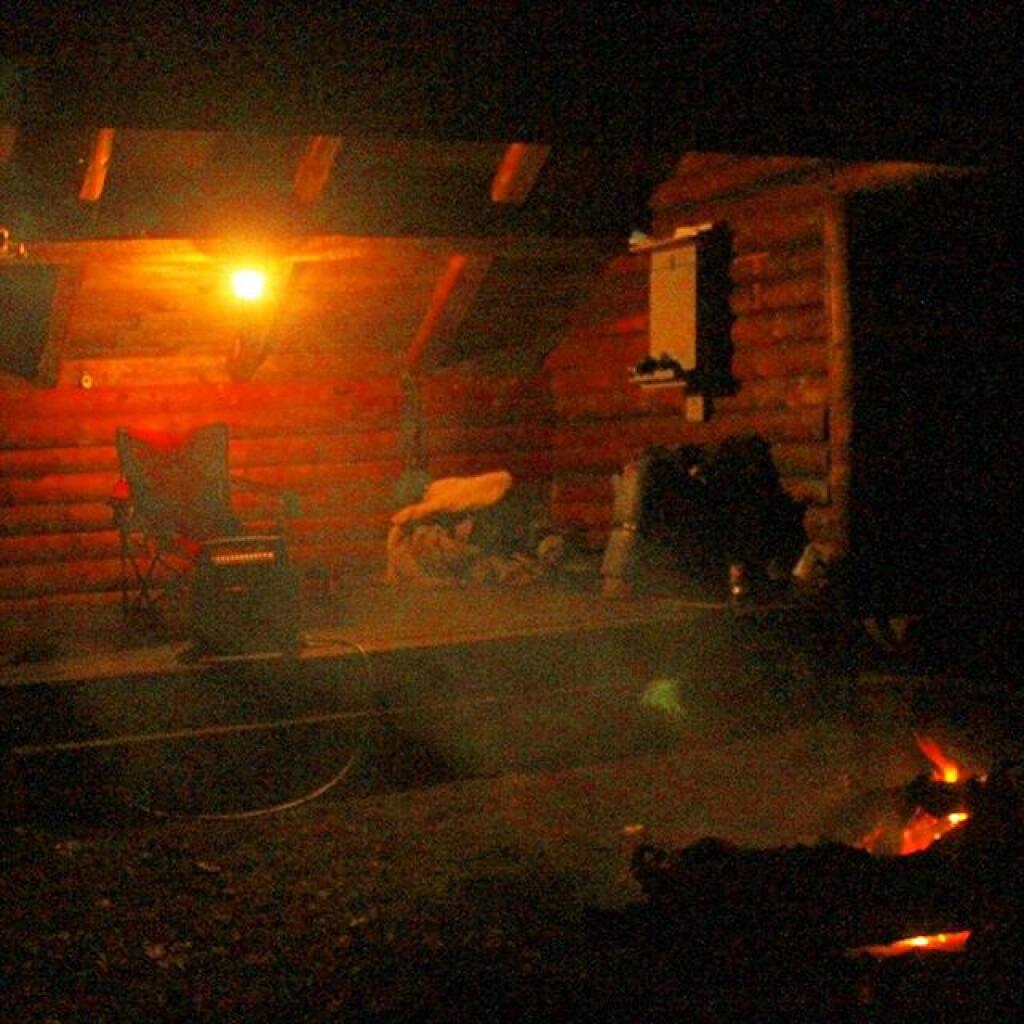
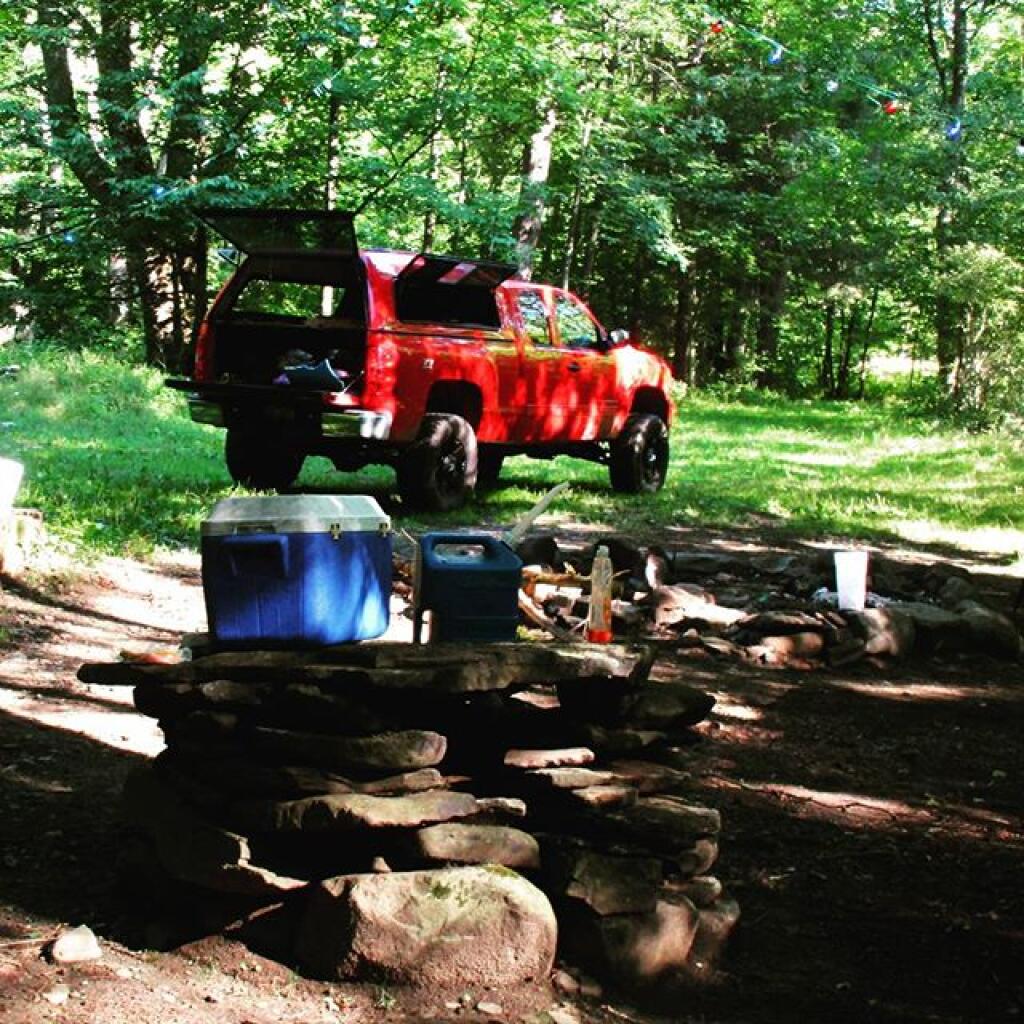
April 9th was the first day I got out camping in 2011. Spent the day exploring Rogers Environmental Center, camped at Moscow Hill Horse Assembly Area.
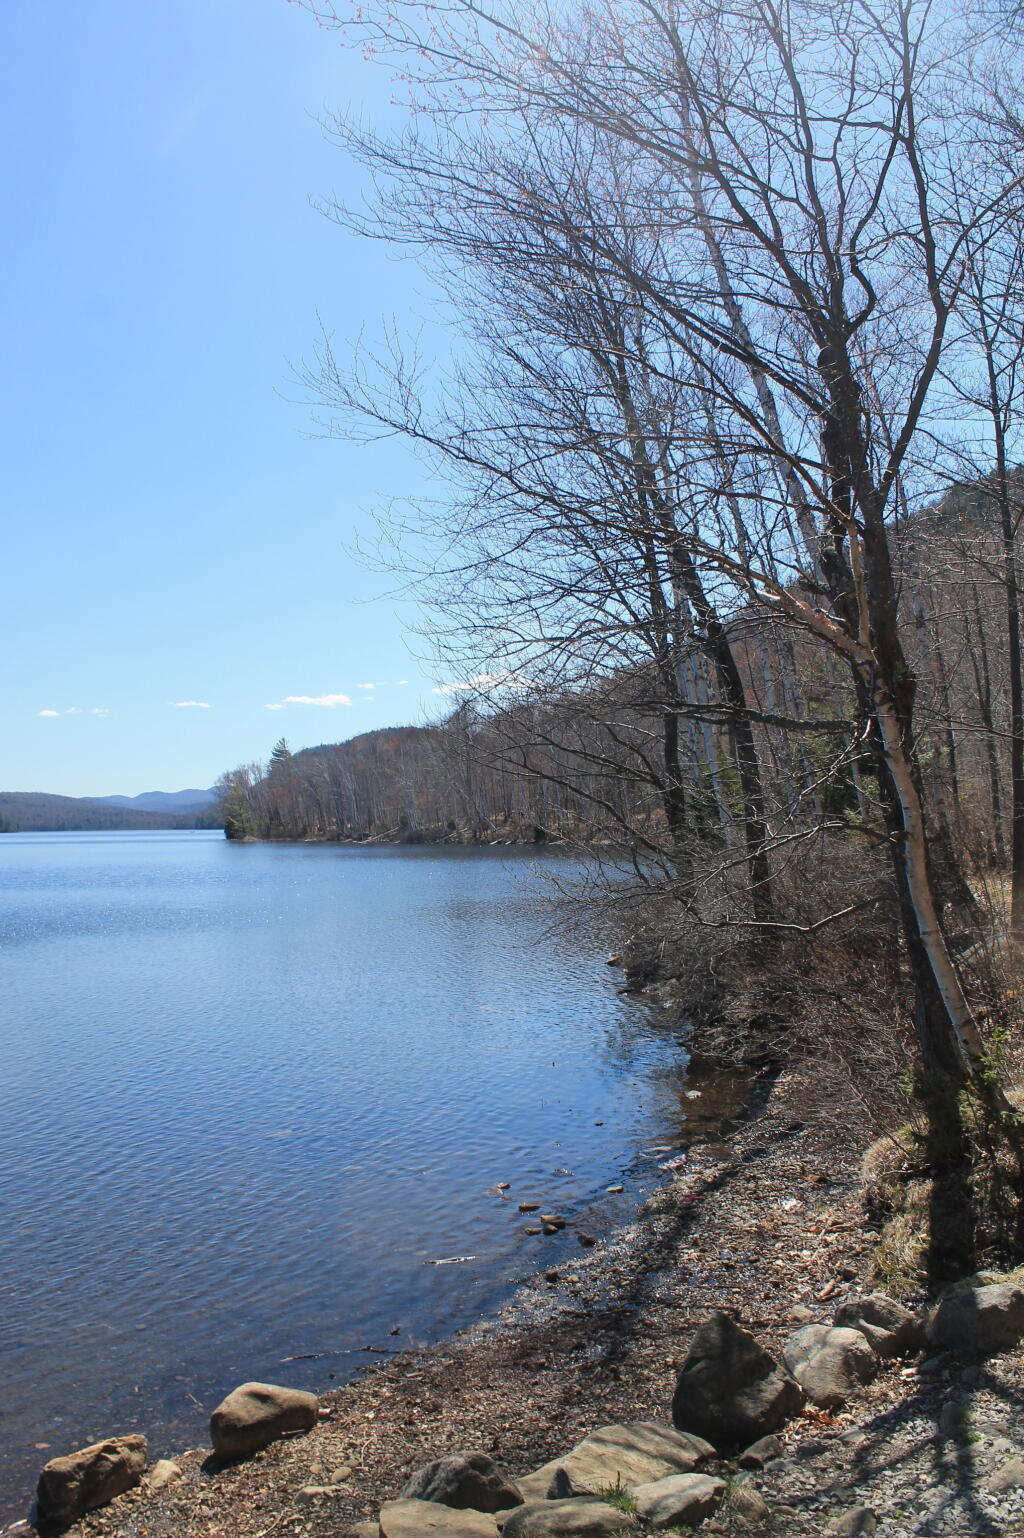
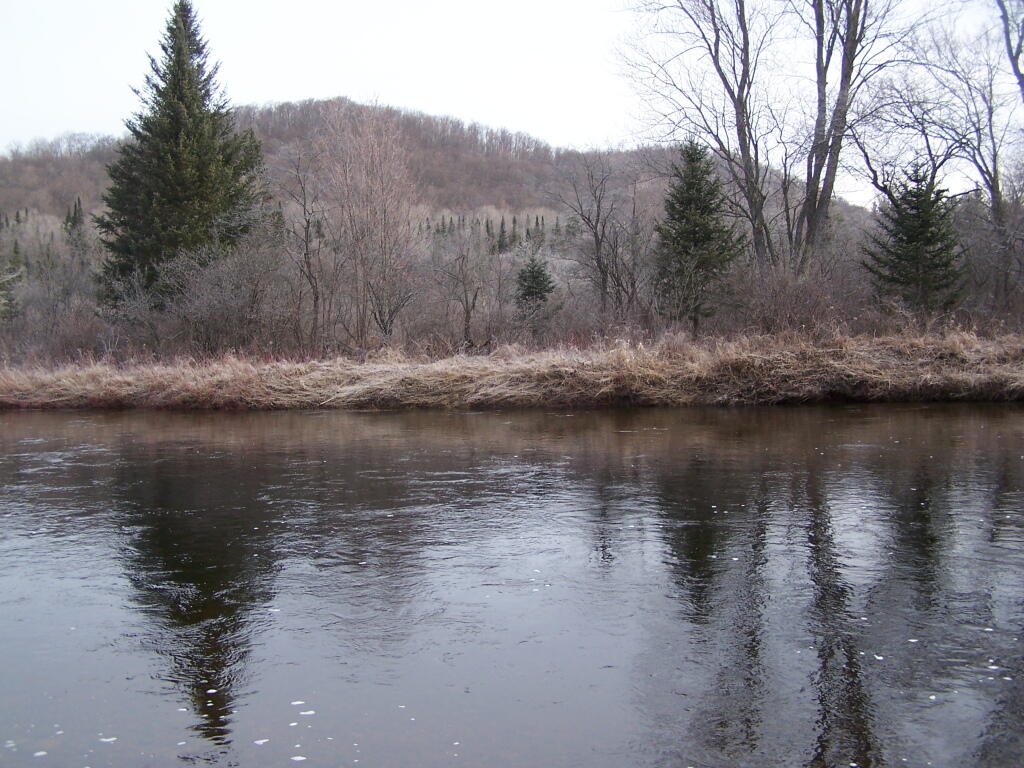
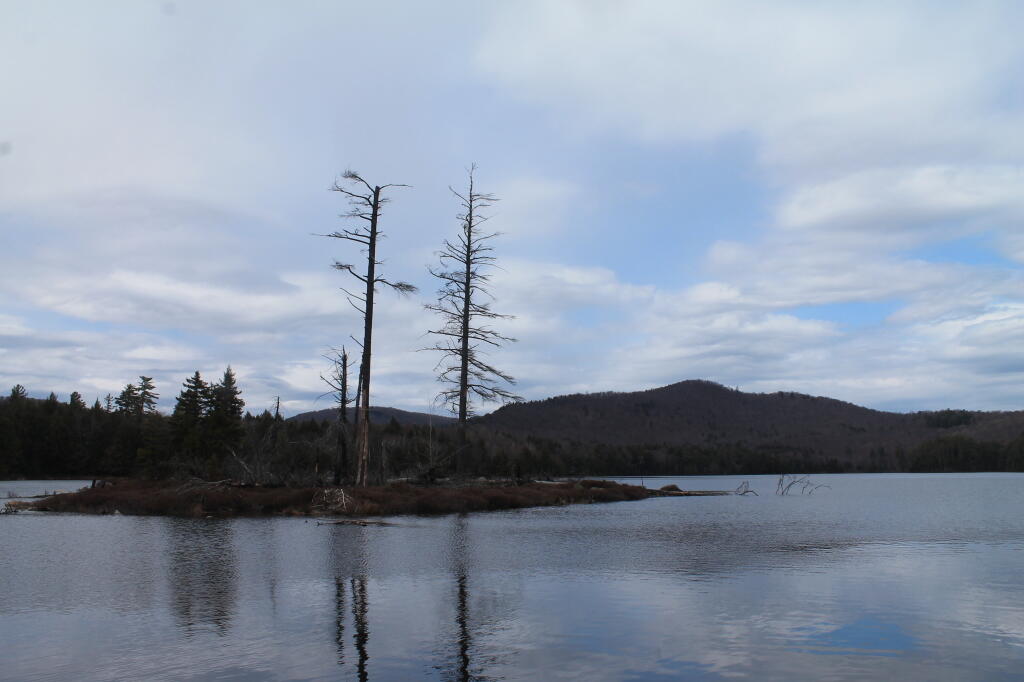
It may start to warm up earlier in lower elevations, but winter is still very much a force in late April in the Adirondacks. The East Sacanadaga River on this morning looks icy and cold.
May.
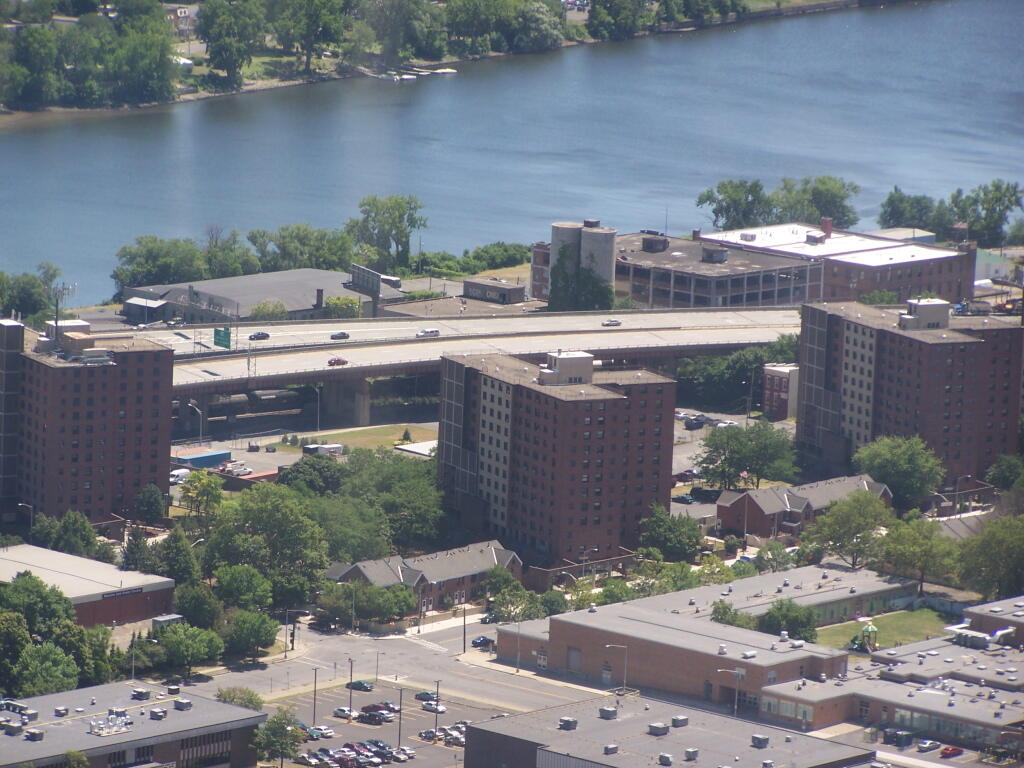
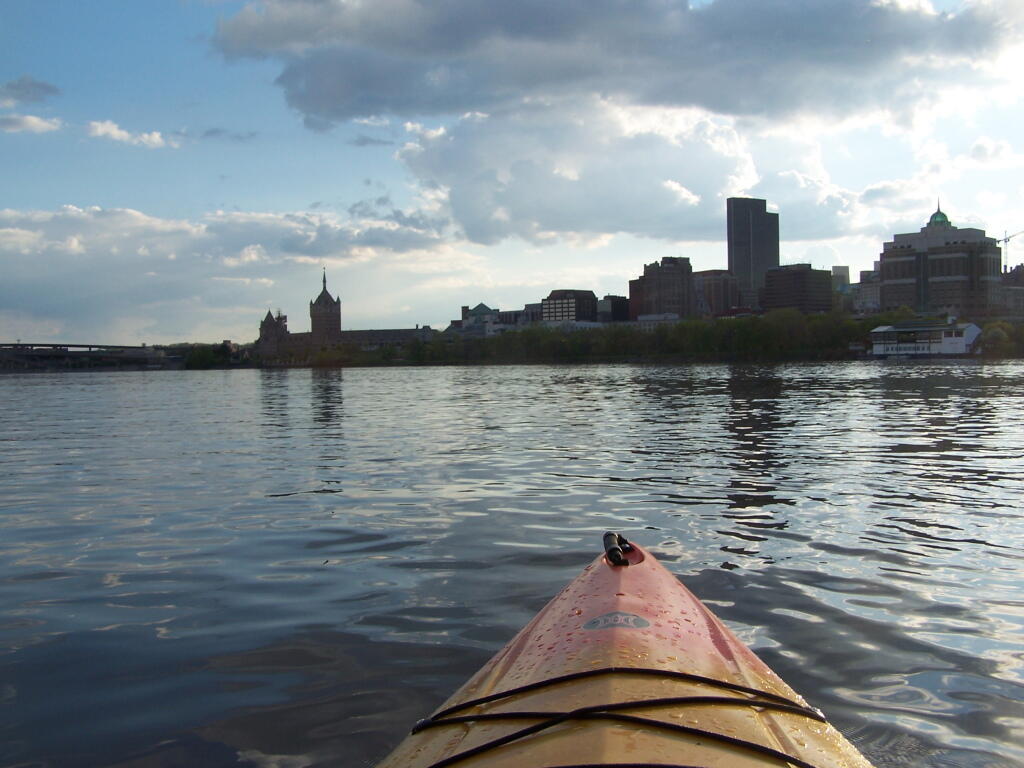
There’s Albany! From my kayak. I kayaked up to Downtown Troy from the Corning Preserve.
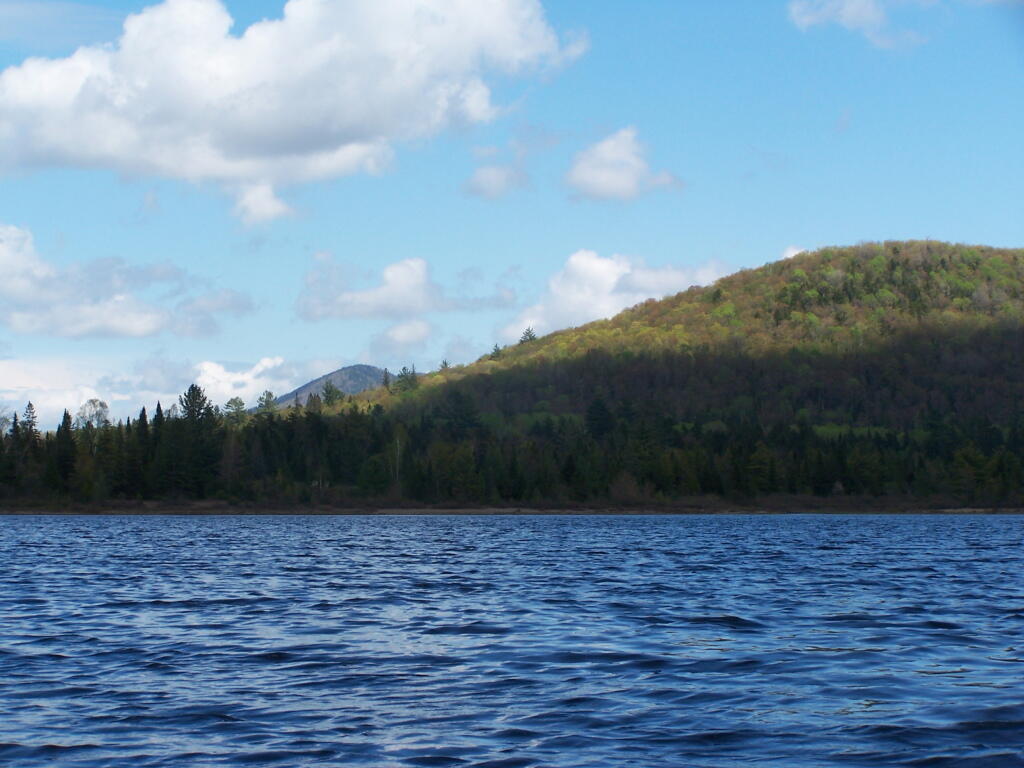
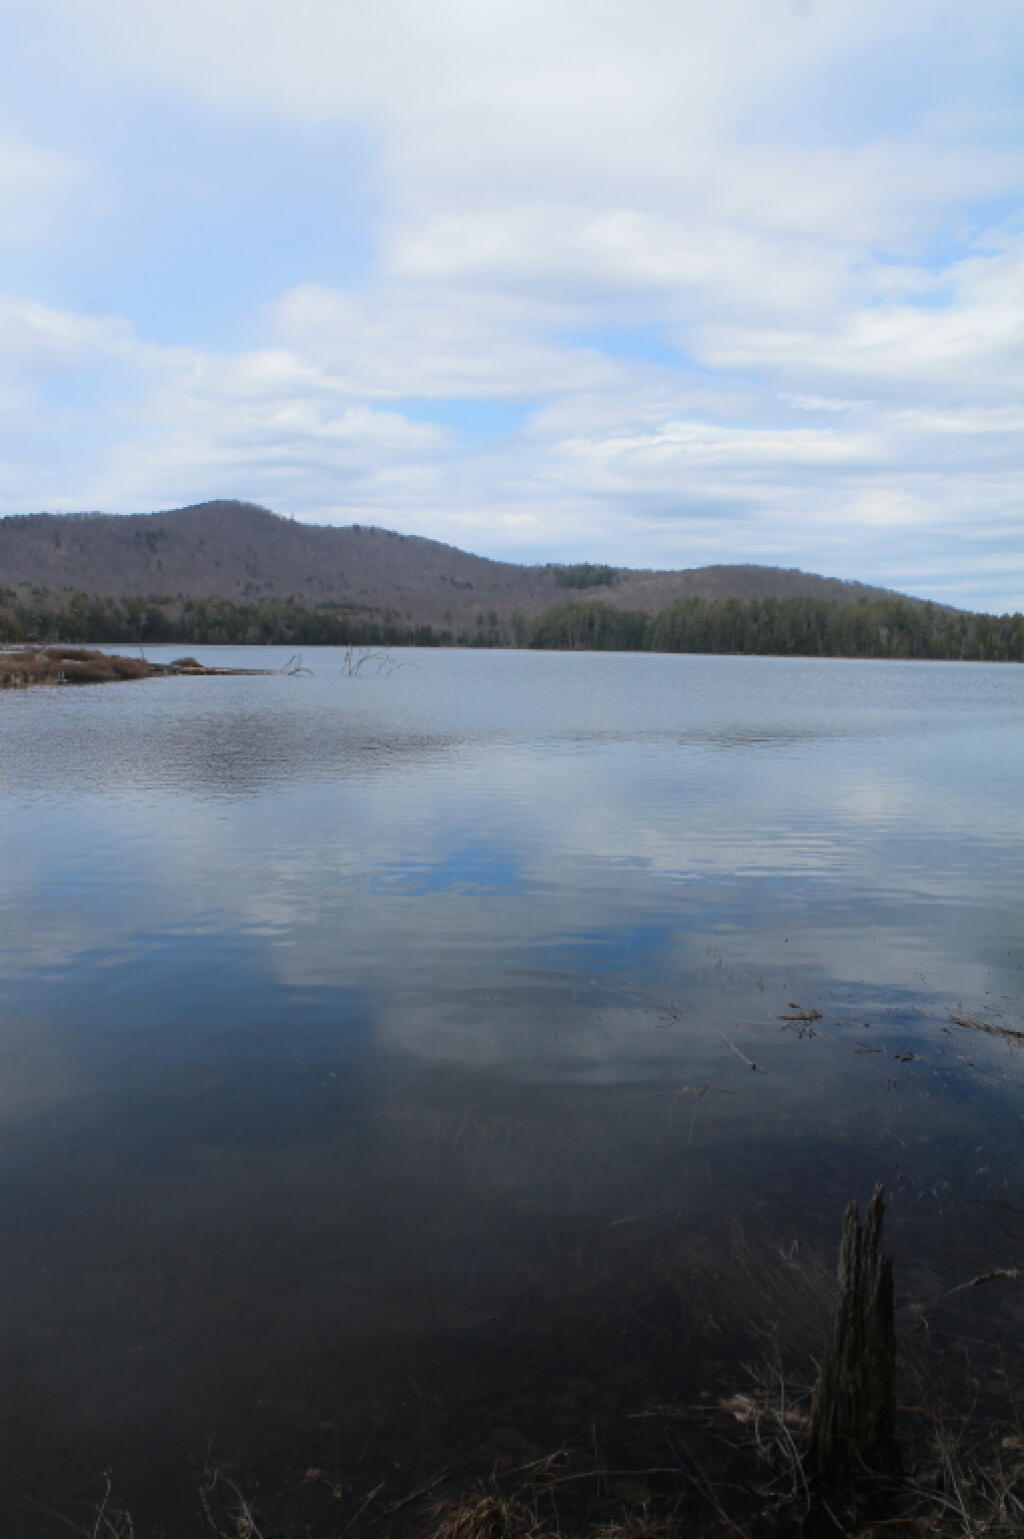
Spring finally comes to Adirondacks by late May. Paddling around Cheney Pond, looking towards Sand Mountain in the distance, on the other side of Hoffman Notch.
June.
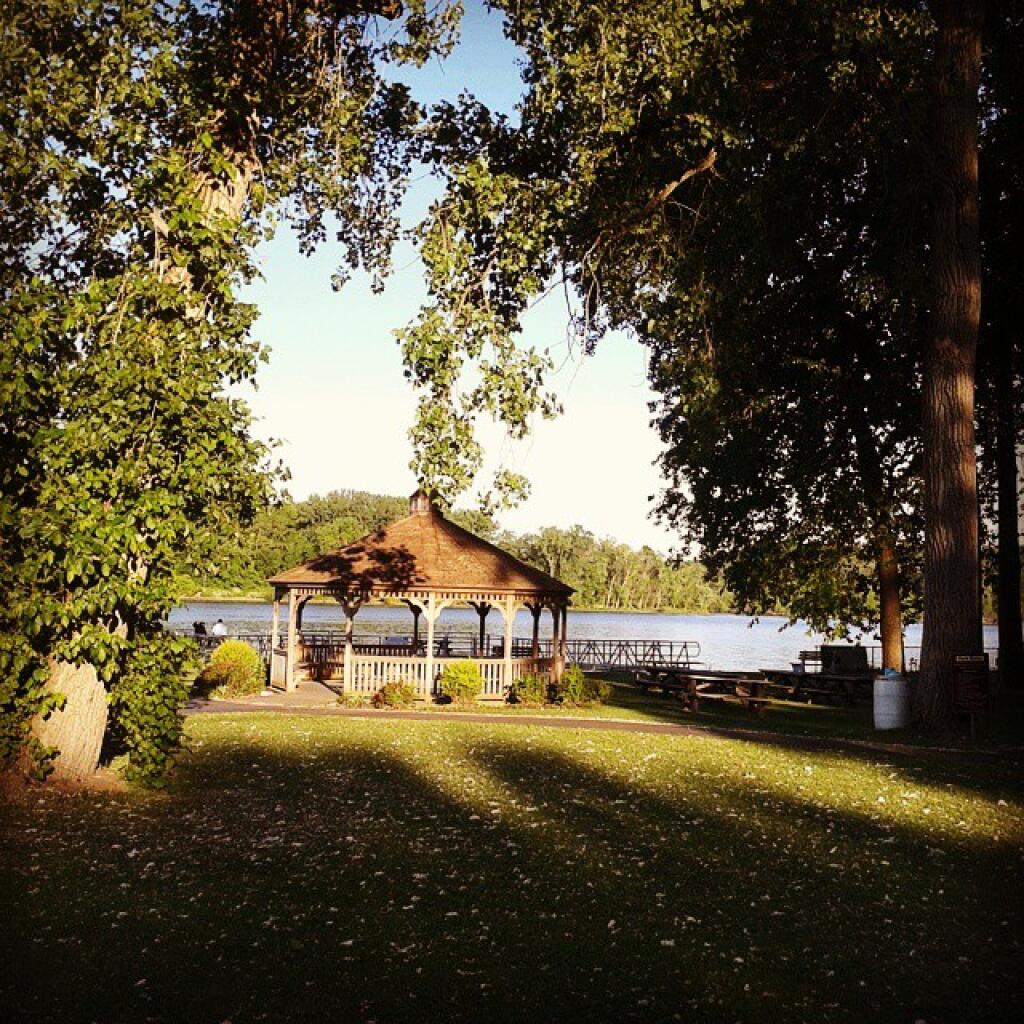
Kayak camping on Stockmans Island in the middle of the Hudson River. What an adventure, one I picked on a night when they had fireworks up at the Coxscake Town Park.
Oswegatchie River up in Watson’s Triangle in Adirondacks. There are few places as remote as this that you can drive on largely unmarked and rarely traversed back country roads. Watson’s Triangle is a place far of the beaten path.
July.
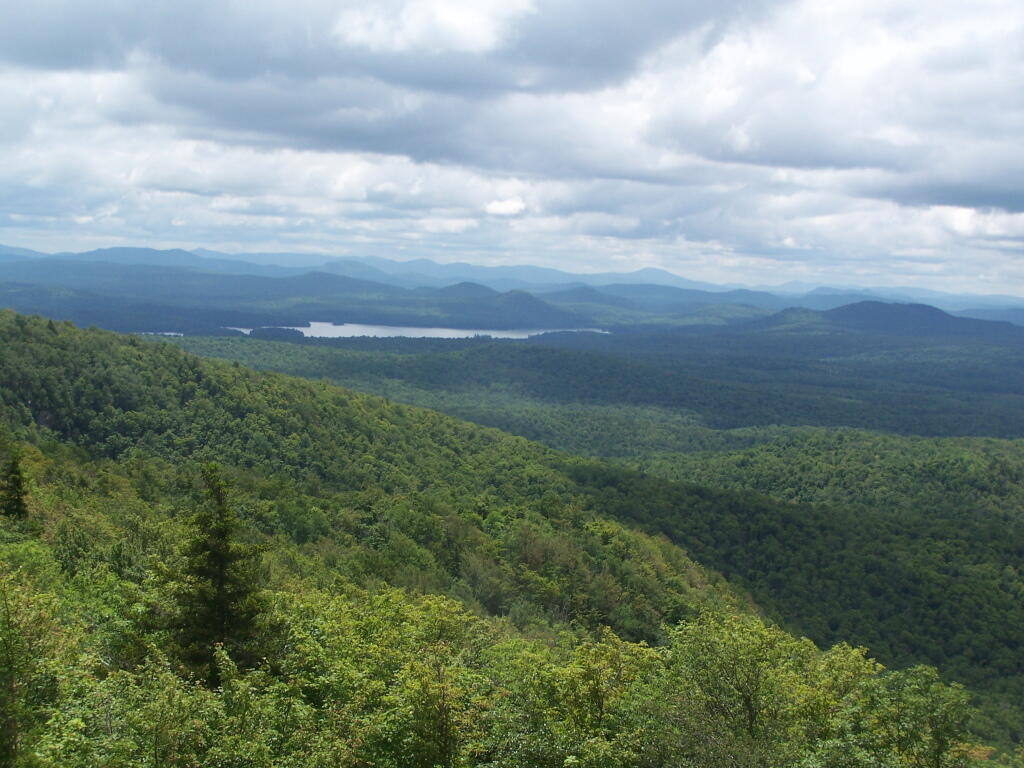
A dramatically cloudy day, looking down towards Tupper Lake from Mount Arab.
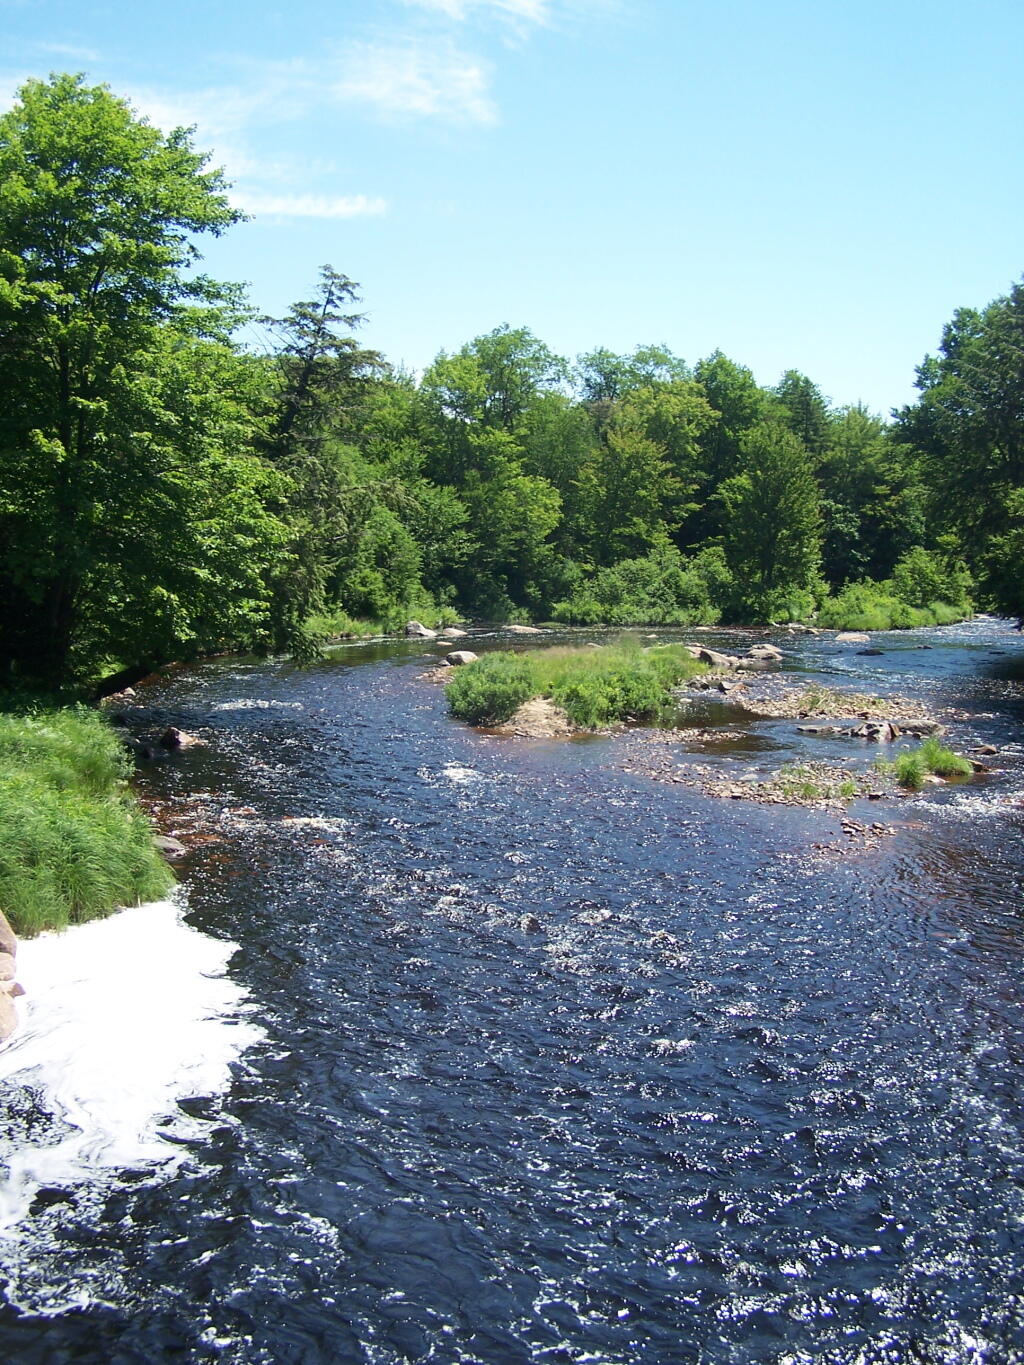
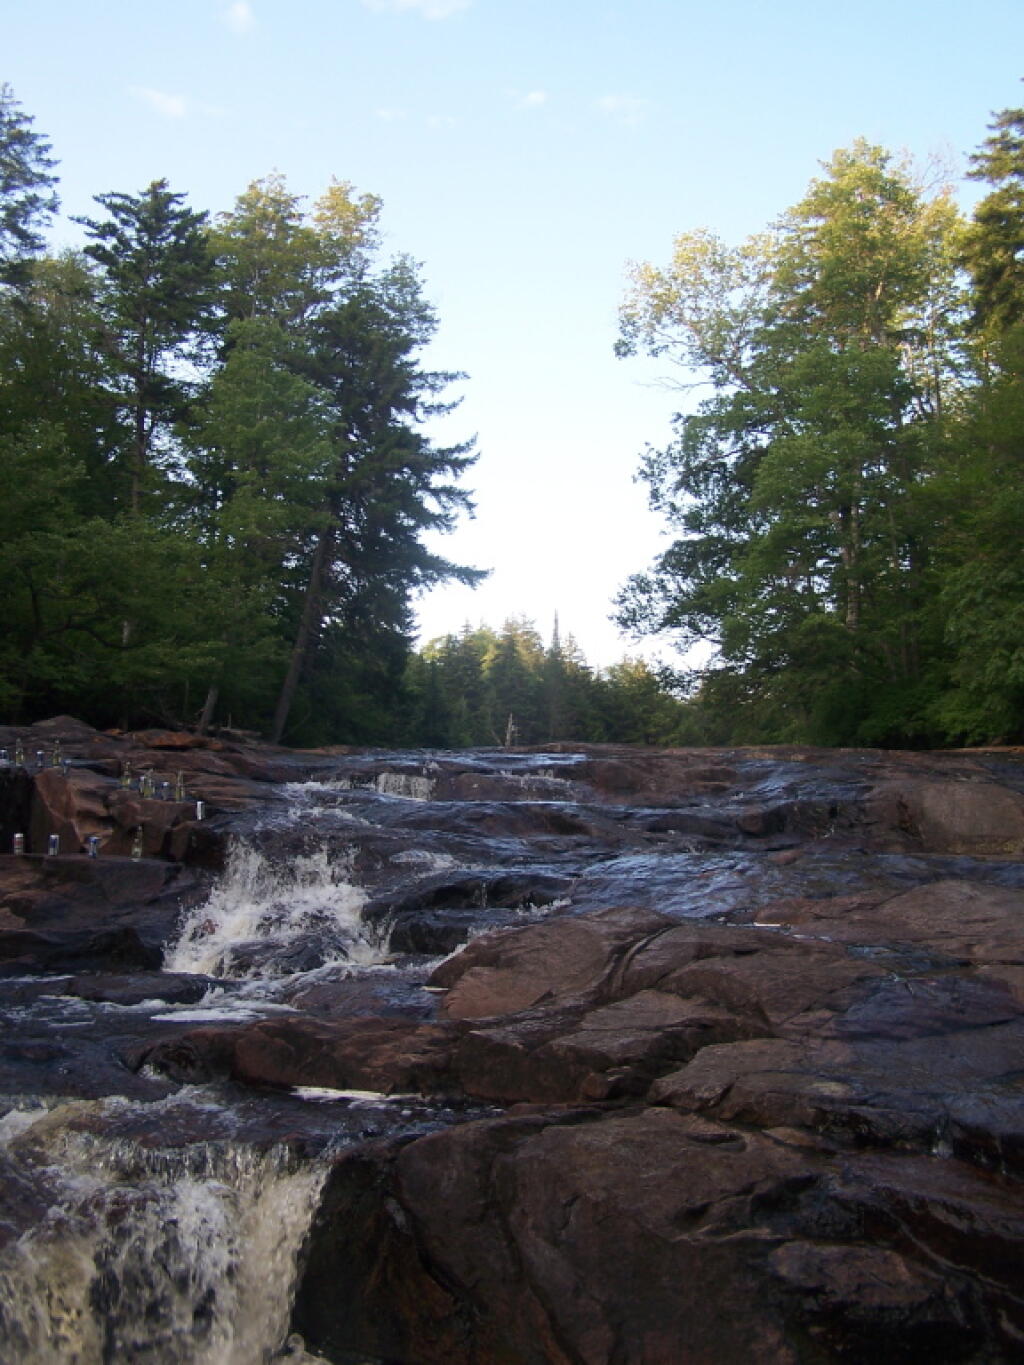
Cooling off at the Potholers on an oppressively humid summer’s day.
August.
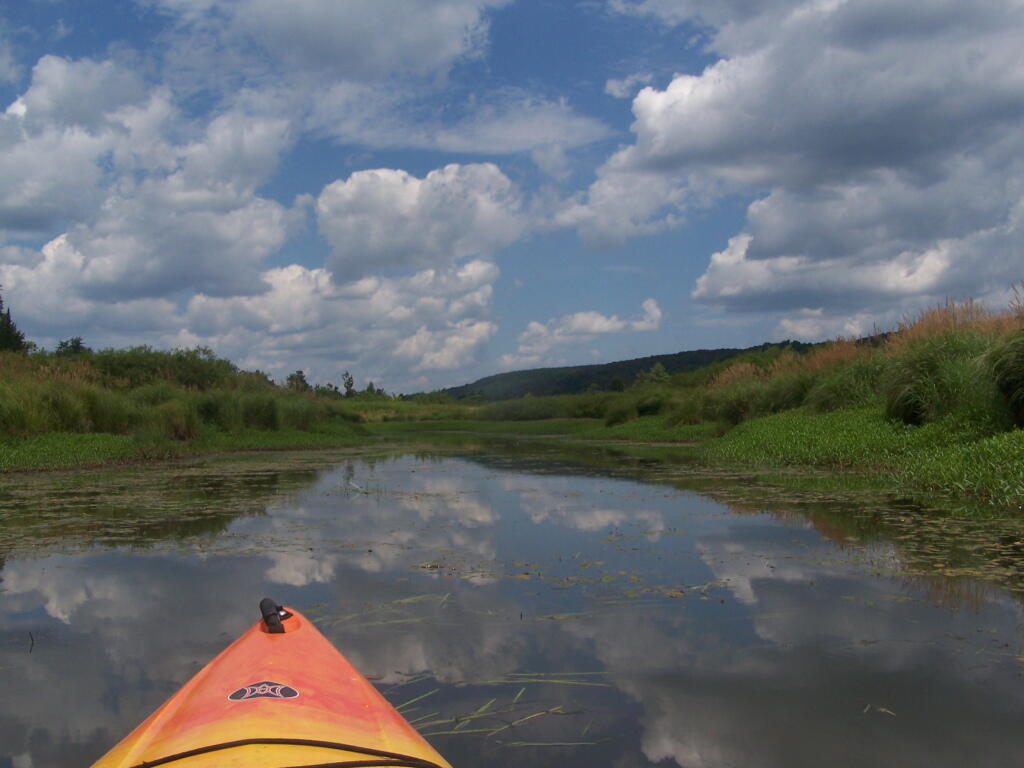
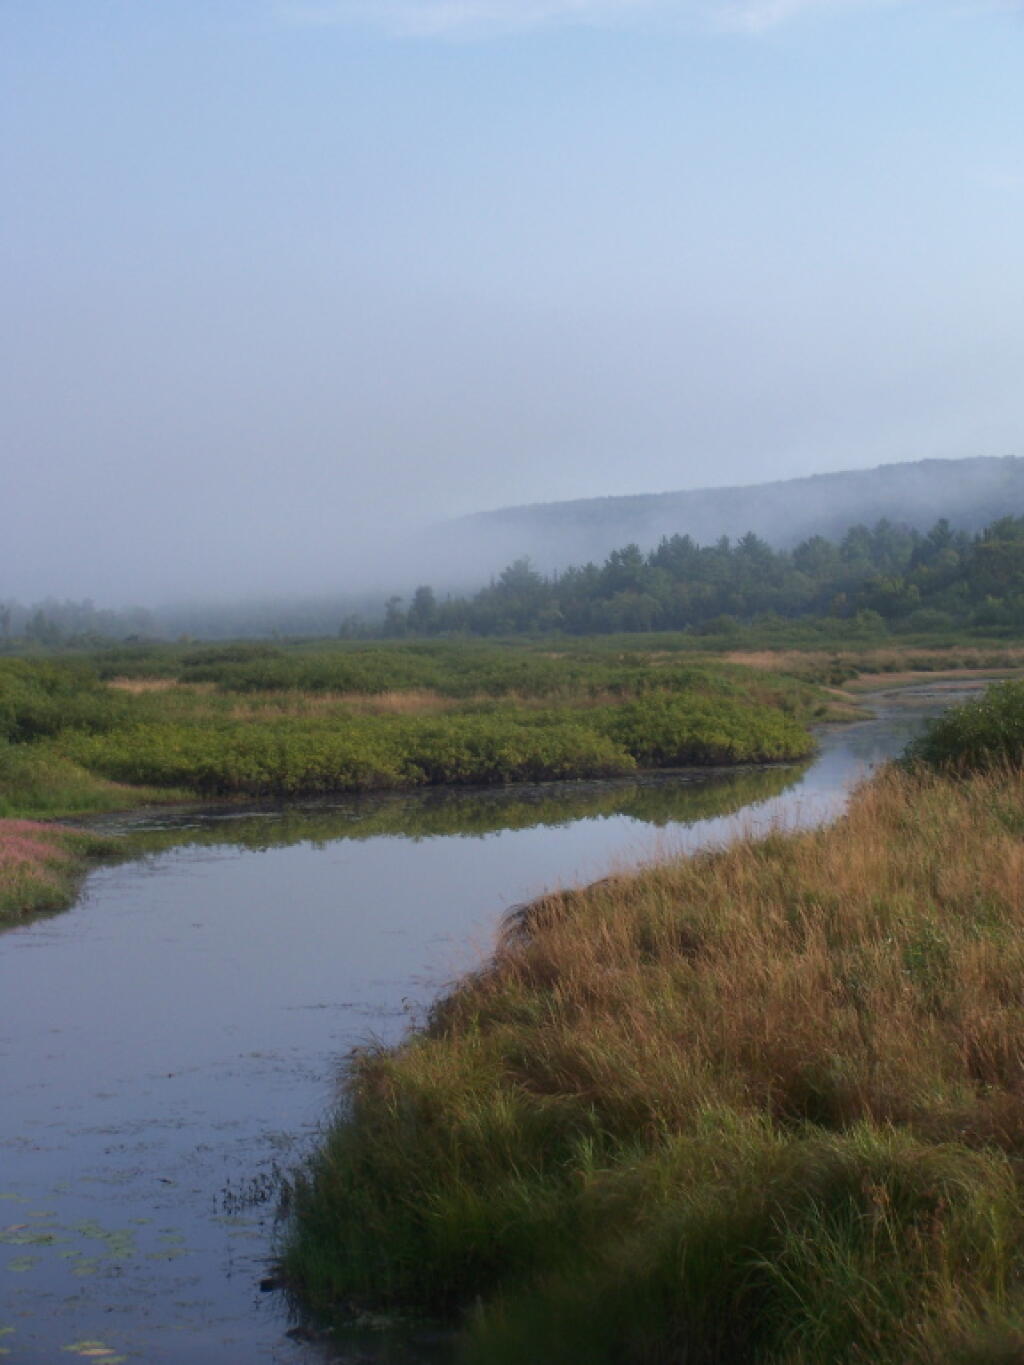
Exploring Beaver Creek at the Brookfield Railroad State Forest in Brookfield, NY.
Watching the fog burn off Beaver Creek at Brookfield Railroad State Forest on a summer morning..
September.
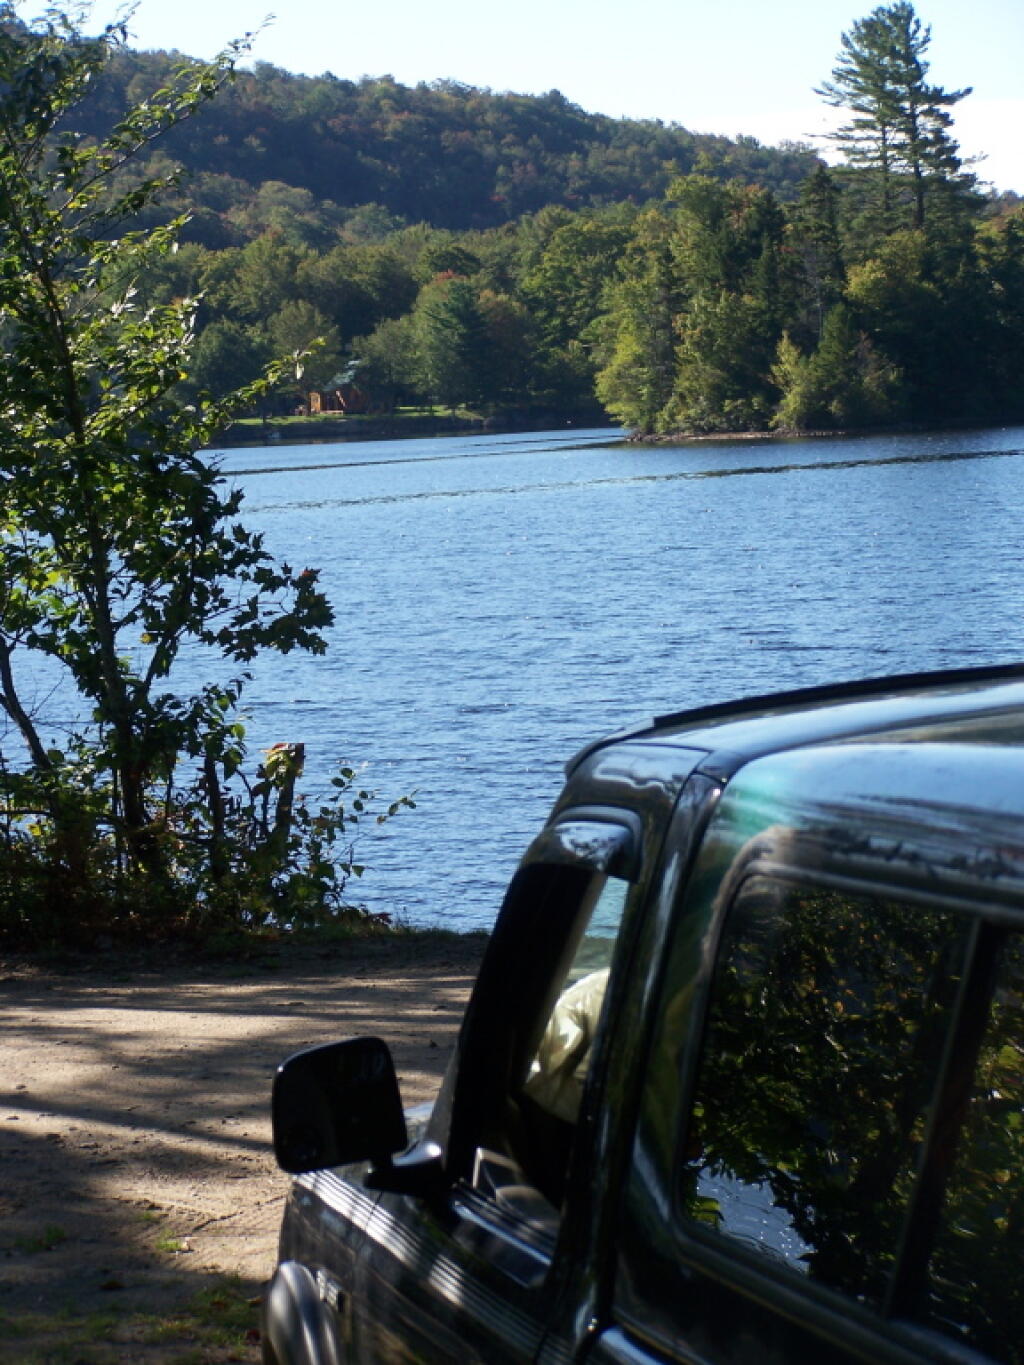
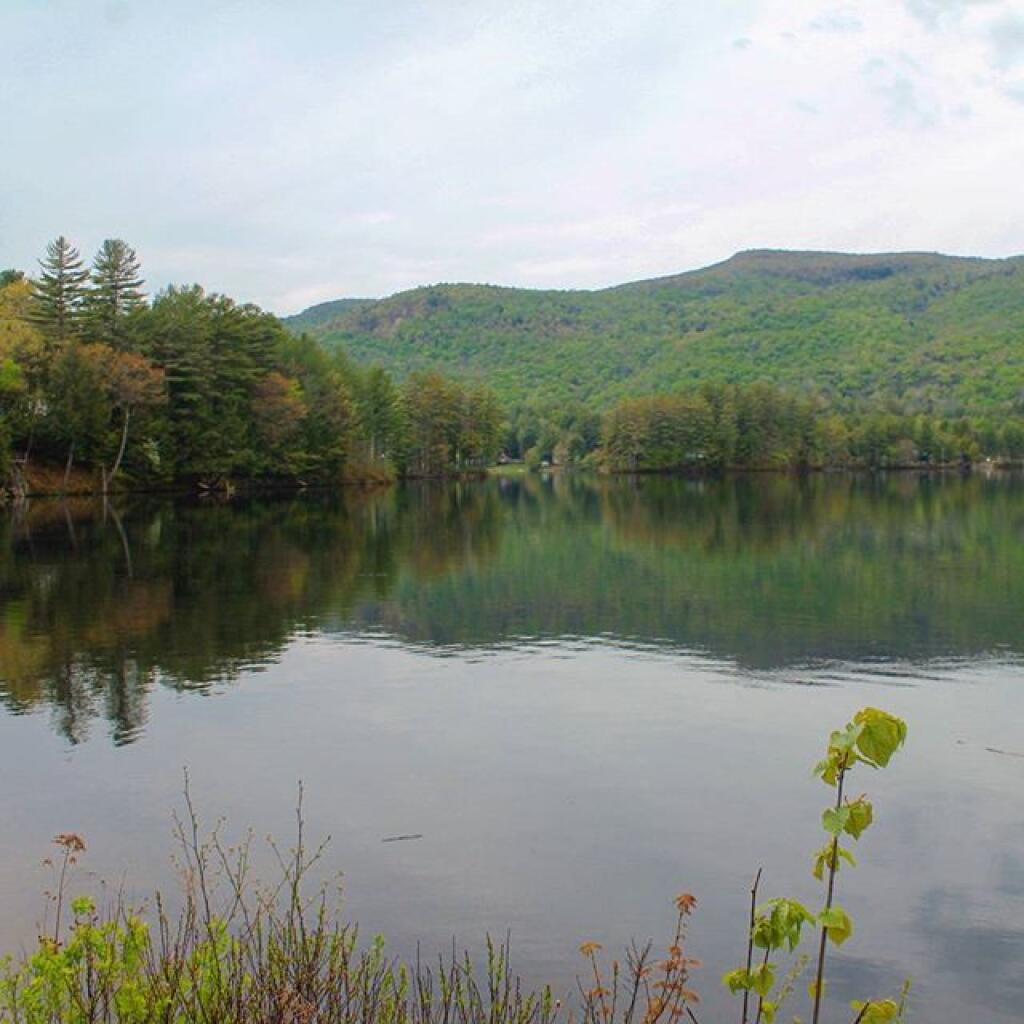
A beautiful late summer morning at North Lake in Adirondacks. North Lake is such a jewel, especially as you head farther north on the largely undeveloped portion of the lake.
Fall was well underway, and even past peak at Moose River Plains by September 20th.
October.
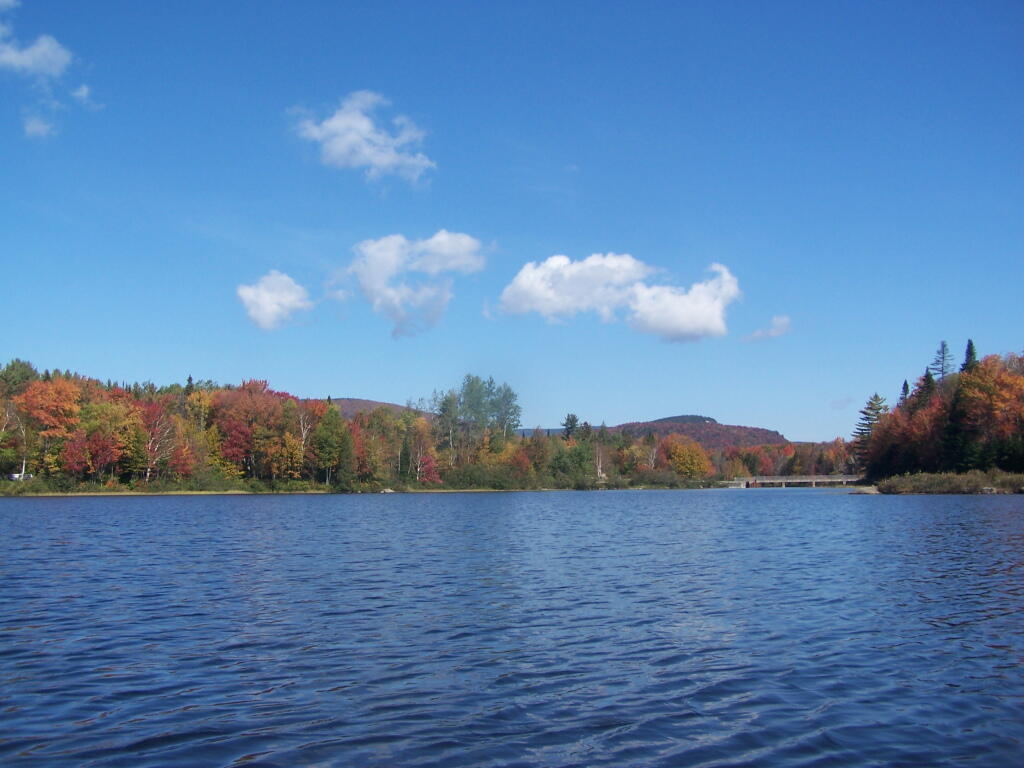
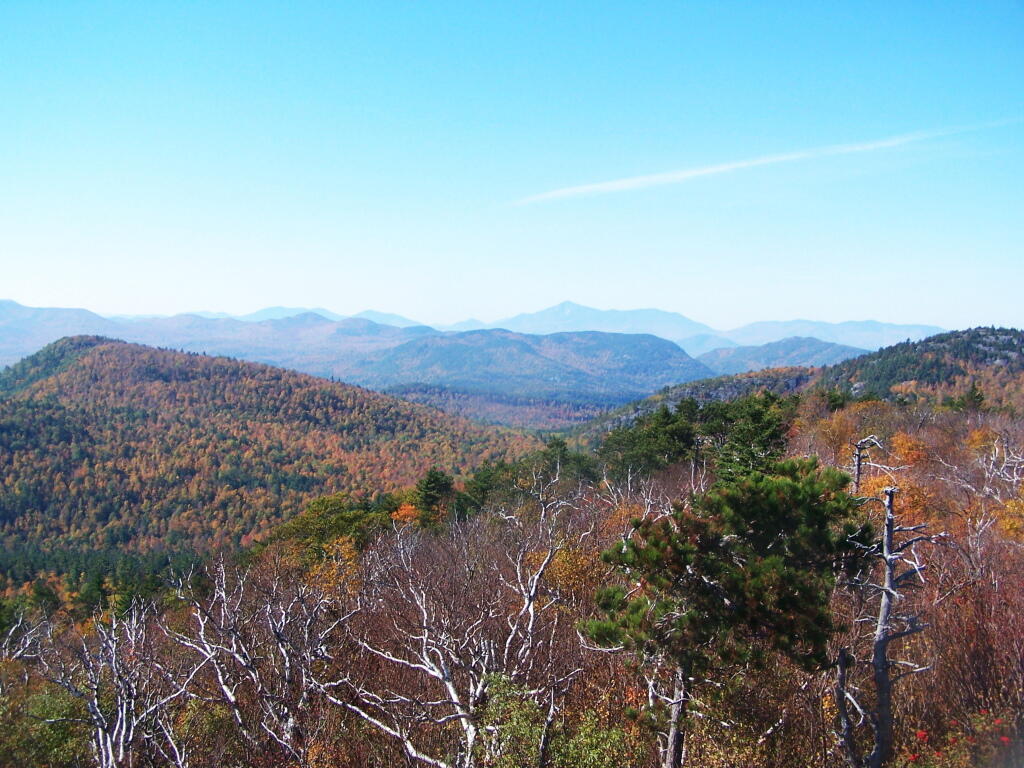
Second week of October, I went up to the North Country for some leaf peeping, hiking, and kayaking. The colors may be faded in Central Adirondacks, but still were good in lower elevation parts of the Northern Adirondacks.
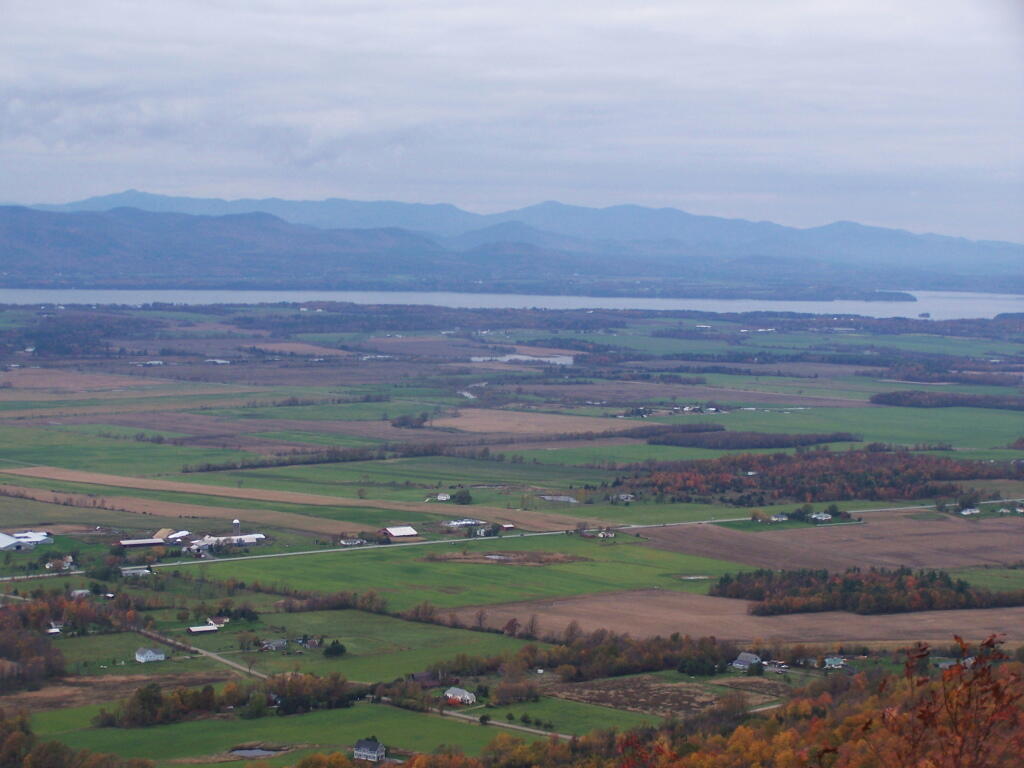
And later in October, I drove up to Snake Mountain in Vermont, overlooking the Champlain Valley and the Adirondacks. Colors lasted the longest
And by October 30th, we had snow, actually several inches, as seen up at Lake Taghkanic State Park.
November.
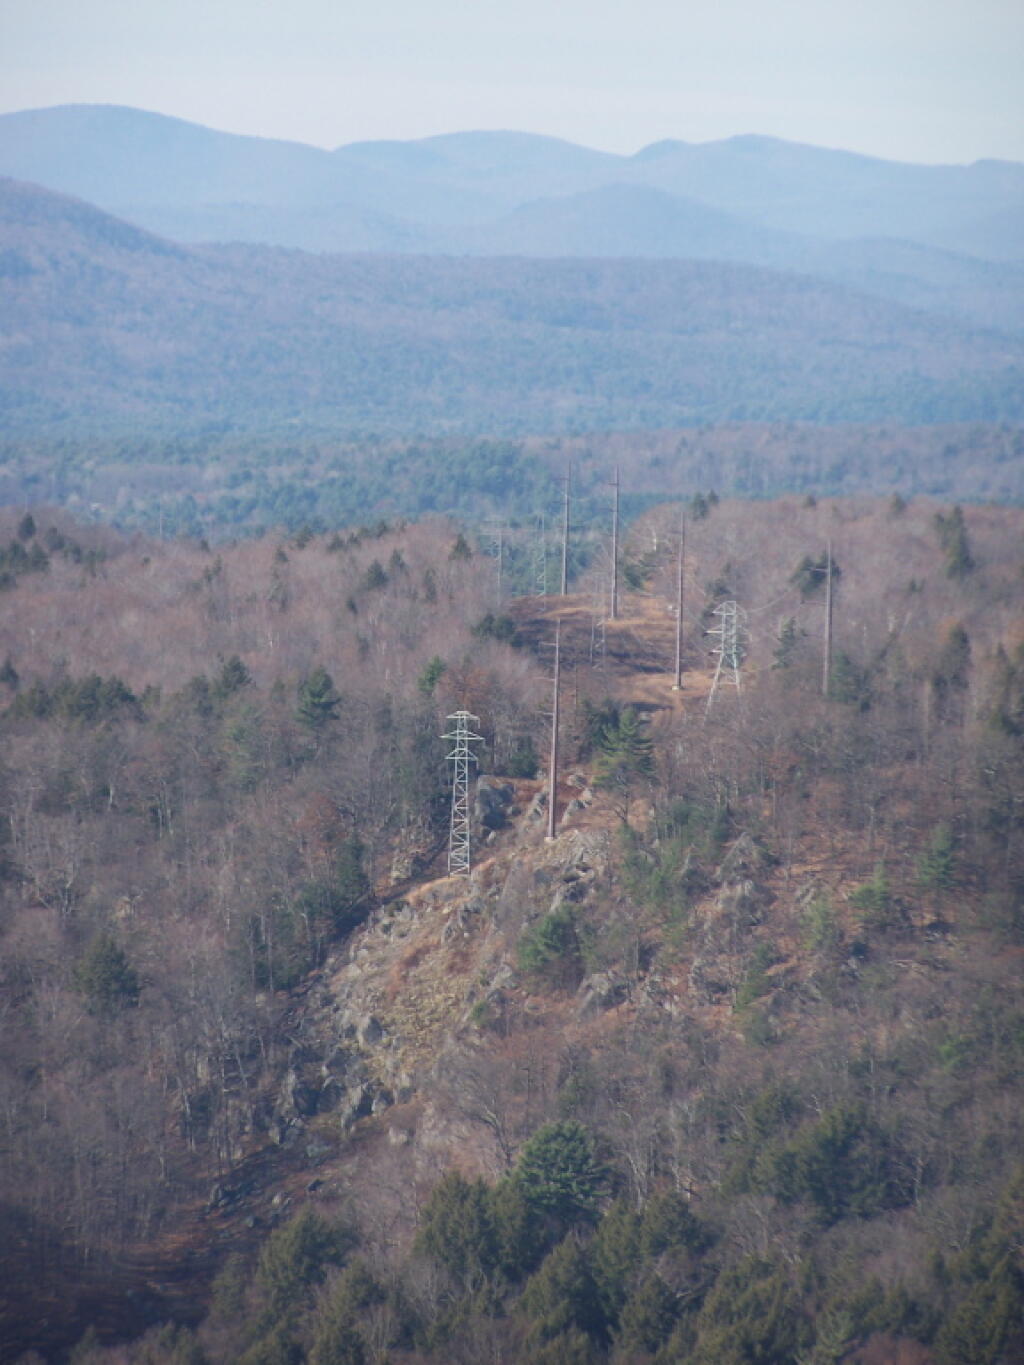
In November I visited Monreau Lake State Park for the first time, and checked out the Palmerstown Ridge above the Hudson River and Spier Falls. These power lines transfer power from Spier Falls Hydro Dam over to Corinth.
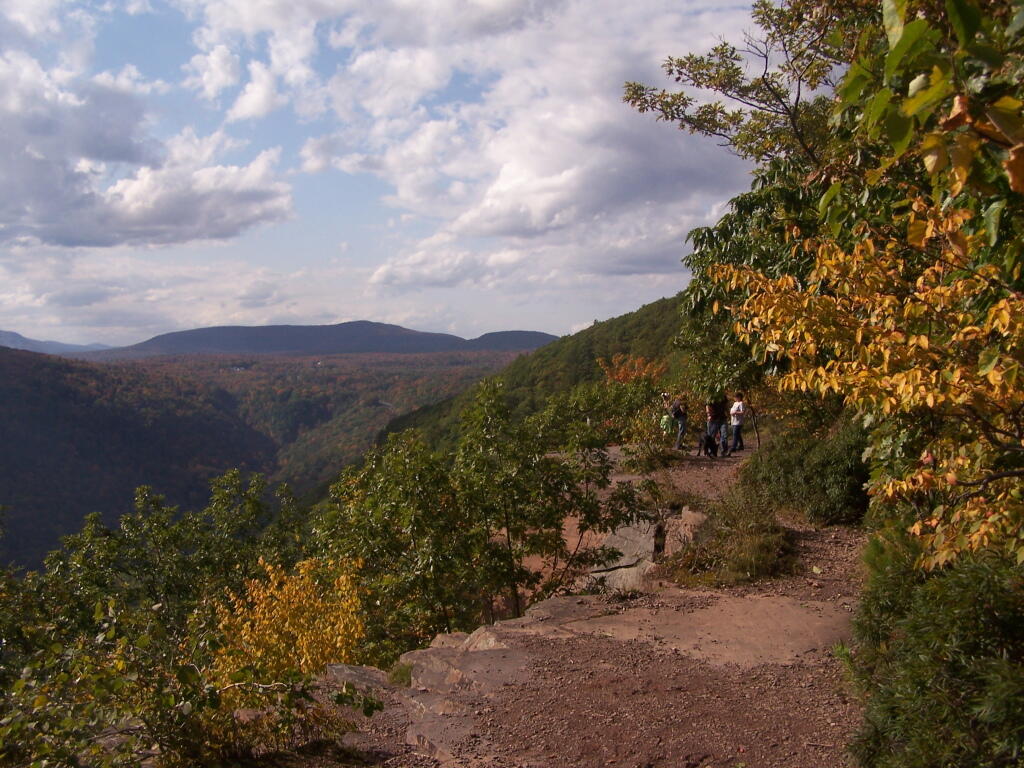
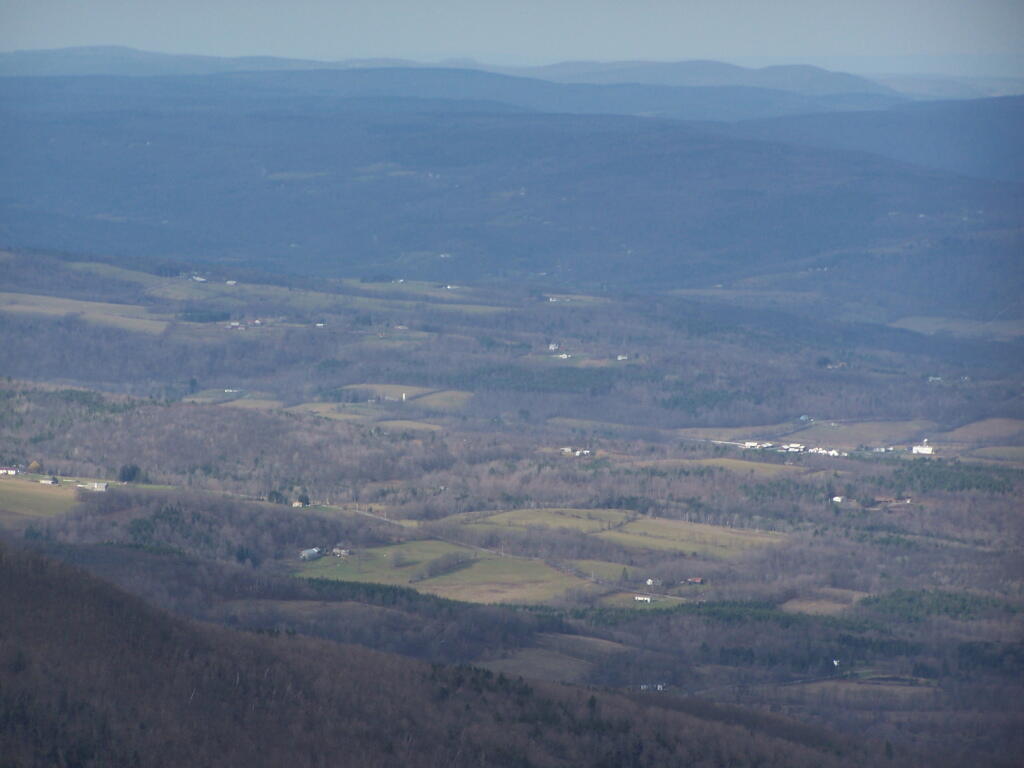
I also hiked up Windham High Peak. I hadn’t been there in many years, and it was interesting to look down at Preston Hollow and Medusa, far, far below.
December.
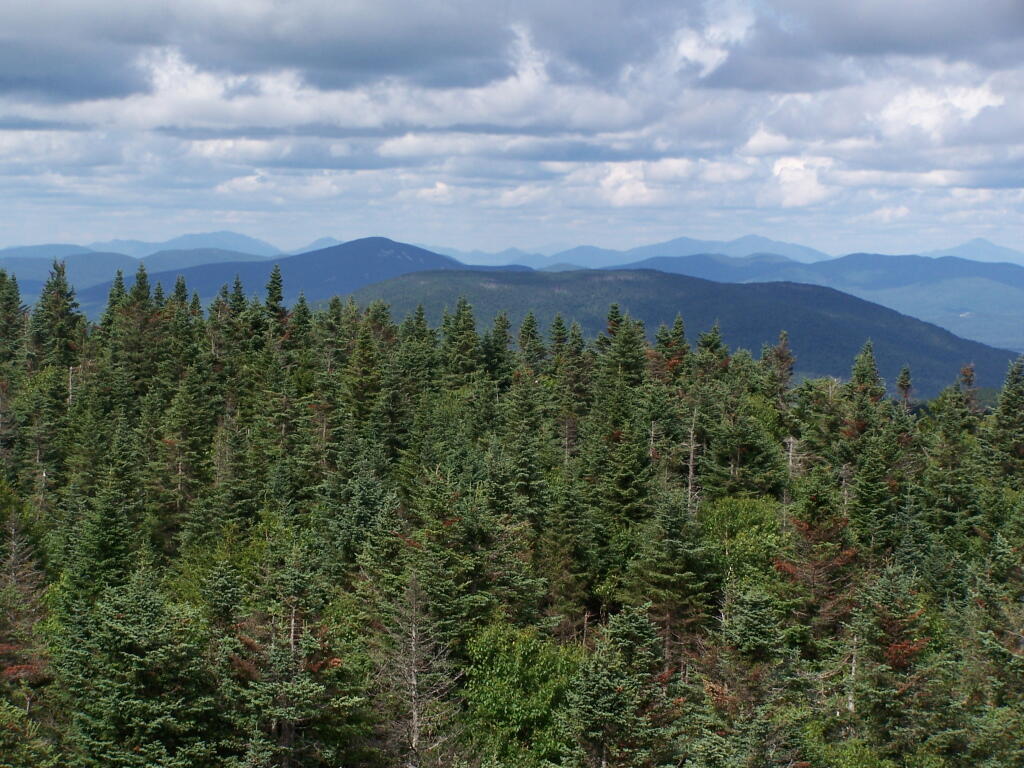
On Christmas Day, I hiked up Hadley Mountain. While cloudy and cold, it was very beautiful.
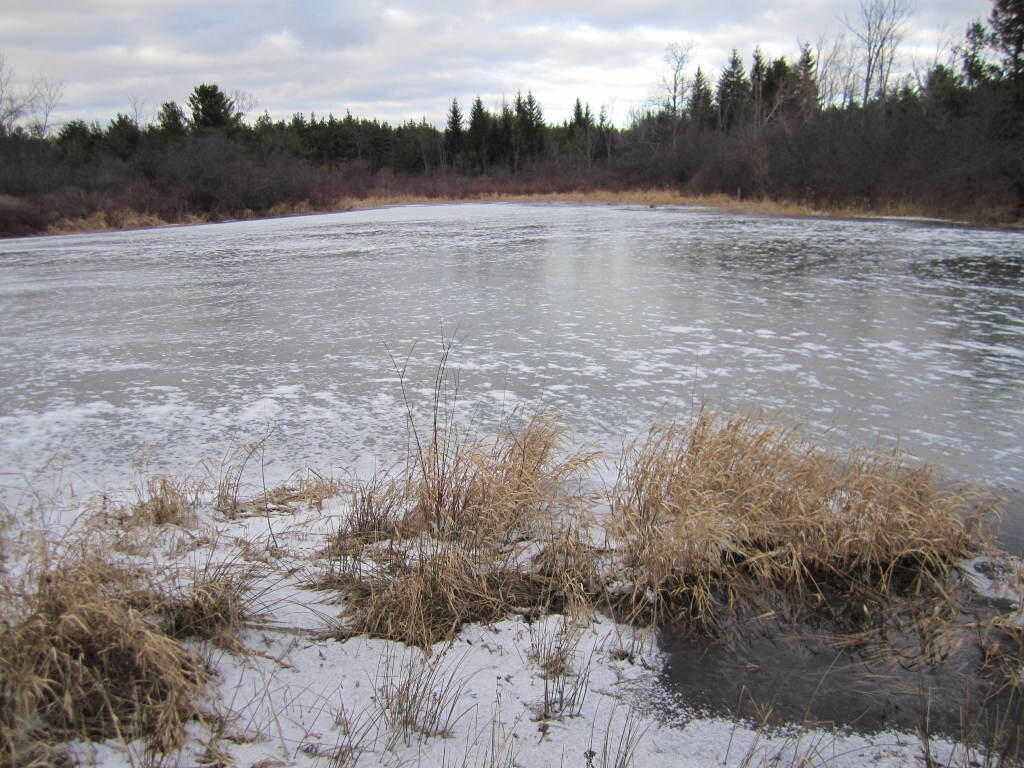
While the pond at Thacher Park was frozen, there still is very little snow locally.
For the first year of doing topographic maps, I relied extensively on using NYSDOT topographic maps, I originally downloaded from the NYSGIS consortium website. The NYSDOT topographic maps have a lot of good information on them, an in many ways have the most accurate topography.
But what I’ve also found with those maps is they have several real limitations…
1) They Don’t Scale Well.
NYSDOT topographic maps are designed to viewed at 1:2400 feet ratio, as they are 7.5″ quads. You can get away with rendering them anywhere between 1:1800 to 1:2600, but beyond that the text looks too small, too crowded, or two pixelated. For smaller parks and larger areas, NYSDOT topographic maps do not work well.
2) Unneeded Information and Clutter.
DOT Topographic Maps try to suit the need of any user, and include information like town lines and other jurisdictional information that is unnecessarily for the average outdoors person.
3) Outdated Information.
Often topographic maps have dated information on man-made boundaries and buildings. The state often buys new land, demolishes existing buildings, and closes off trails. Old trails appear on topographic maps, as do labels such a “Restricted”, even though to this day such roads may be valid, despite the incorrect or outdated information on topographic maps.
4) Metric Scale; Differentiating Contour Scales.
Metric elevations are maddening for anyone trying to calculate their elevation from select DOT topo maps, and often when you load multiple topographic maps, they do not fit together seamlessly, as one will be using one unit for contours, while another will use another unit. Contour scales throughout the state very widely, which when put together can be confusing.
On the other hand, topos do have some benefits…
1) Most Accurate Shorelines.
The Census Water Area and Liner Water Shapefiles from TIGER/Line are pretty accurate, but they are not nearly as good as topographic maps.
2) Wetlands.
Currently I don’t have any good source of data or wetlands to add to my maps. I probably should do more research into this, as I know the state does have wetland maps available — but how much of a PITA are they to use?
3) Buildings.
Topographic maps have many of the buildings on them. While this information can be outdated, it does provide useful information to the viewer of such maps. TIGER/line has some features, like cemeteries and some buildings, but this data set is tiny compared to what’s on the NYSDOT topographic maps.
Today we look at Campsites and Lean-tos and other “developed” camping opporunties in DEC Region 7, which consists of lands in Central NY Counties of Broome, Cayuga, Chenango, Cortland, Madison, Onondaga, Oswego, Tompkins and Tioga, and is based on data in Region 7 Recreation Master Plan.
Current 85 Designated Campsites/Lean-Tos.
Balsam Pond State Forest (Chenango 17) – 1 campsite at Baker’s pond
Balsam Pond State Forest (Chenango 34) – 9 campsites 3
Beaver Creek State Forest (Madison 12) – 2 campsites at the assembly area 4
Charles E. Baker State Forest (Madison 1) – 14 campsites at Moscow Hill 4
Charles E. Baker State Forest (Madison 1) – 2 lean-tos
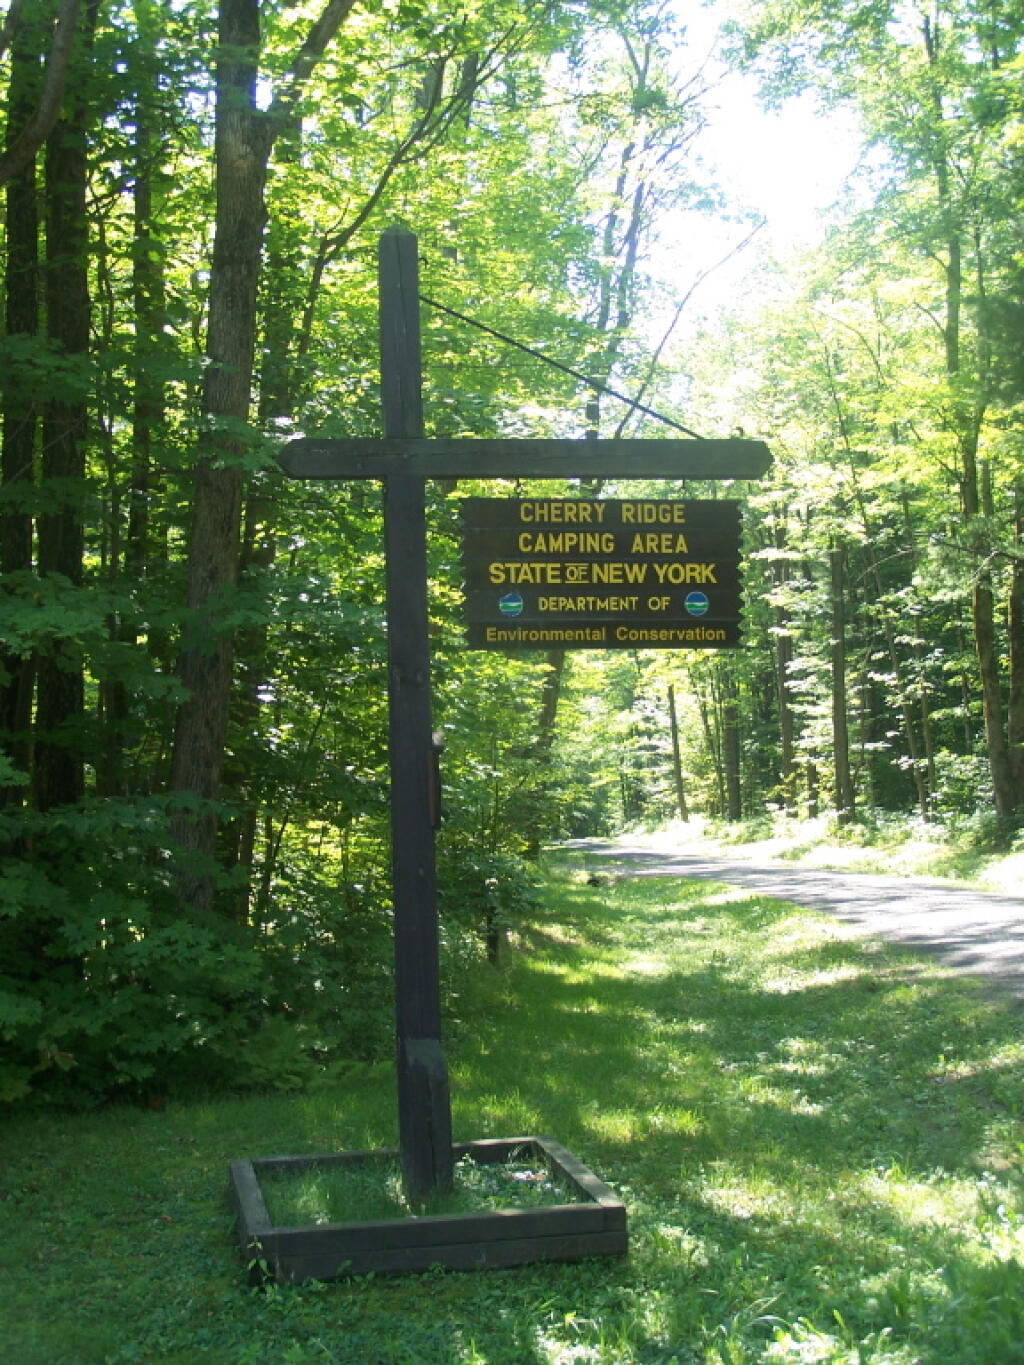
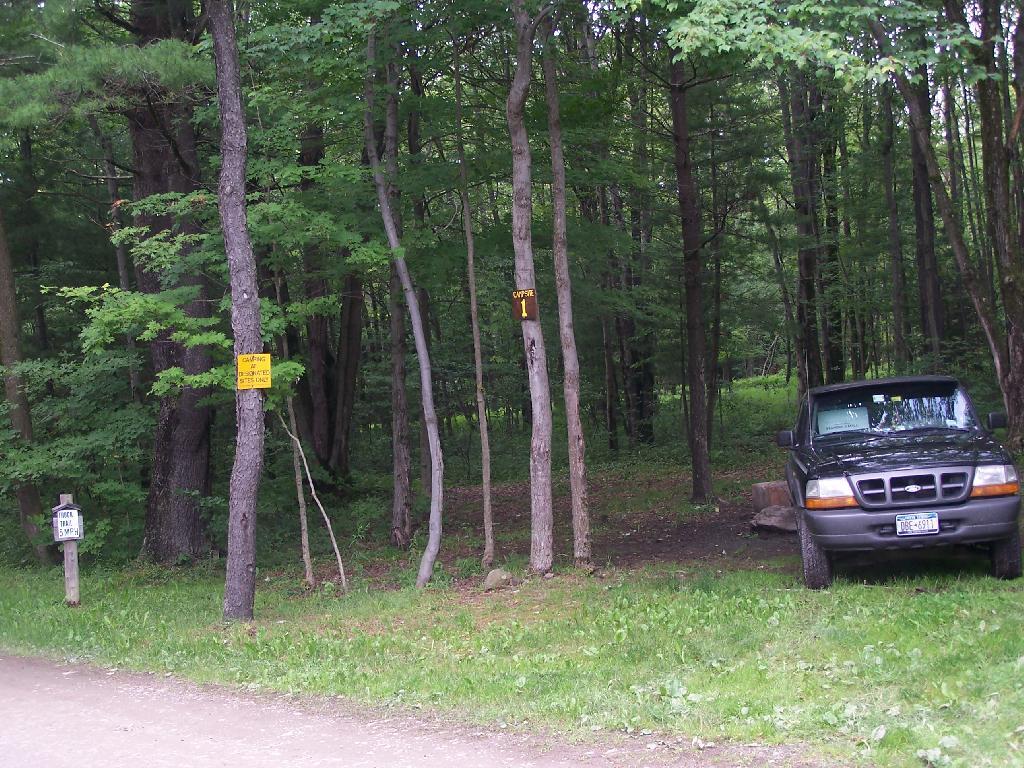
Charles E. Baker State Forest (Madison 1) – 8 campsites at Cherry Ridge 3
Stoney Pond State Forest (Madison 13) – 12 campsites 2
Taylor Valley State Forest (Cortland 2) – 12 campsites 5
Tuller Hill State Forest (Cortland 9) – 1 lean-to
Whaupaunaucau State Forest (Chenango 31) – 1 lean-to
Wiley Brook State Forest (Chenango 7) – 1 campsite
1 DEC Camping permit required. Call (607) 674-4036 to have a permit mailed to you.
2DEC Camping permit required from April 15-October 15th. Call (607) 674-4036 to have a permit mailed to you.
3 Vehicle accessible.
4Horse Assembly and Camping-area.
5 Currently undesignated sites (lacks “Camp Here Markers”) on an old loop road that was part of CCC Camp in Taylor Valley.
Related Maps.
DEC’s Future Plans for Region 7
1. Develop 31 additional campsites in Region 7. Twenty-eight of these will be open campsites and three will be lean-tos. A portion of the new campsite development will occur on Hall Island State Forest (Oswego 10), as noted in items b and c. The Department will consider the option of permanently closing any or all of the Island campsites if patrol or enforcement problems become an issue. Fiscal constraints and public demand will determine if any additional campsites are to be developed within the Region.
a. Development of the new campsites will be in compliance with the guidelines for access by people with disabilities.
b. Develop 12 to 15 open campsites on Hall Island State Forest (Oswego10). These campsites will be located on the south side of the Salmon River Reservoir and will only be accessible by water. A permit will be required to occupy these sites. Three of these sites will be developed for people with disabilities . c. On Hall Island State Forest (Oswego 10), upgrade two designated campsites on Burdick Island and two campsites on Huckleberry Island in the Salmon River Reservoir. A permit will be required to occupy these sites. Two of these sites will be developed for people with disabilities.
d. Develop one lean-to campsite along the Finger Lakes Trail on Perkins Pond State Forest (Chenango 22) in the Town of Otselic.
e. Develop two open campsites on the Marsh Pond State Forest (Broome 4) near the pond. One of these sites will be developed for people with disabilities.
f. Develop three campsites on Robinson Hill State Forest (Tioga 3) near Tricounty Pond. The exact number of sites will be determined from local demand. One or two of these sites will be developed for people with disabilities. Install kiosk and develop area brochure.
g. Develop one lean-to on the Genegantslet State Forest with access from Creek Road. The access trail to the lean-to will be approximately 0.7 miles of hiking trail.
h. Develop an open campsite in stand C-7 on Long Pond State Forest (Chenango 35) designed for access by canoe or boat.
i. Develop three open campsites on Oakley Corners State Forest (Tioga 2). One of these sites will be developed for people with disabilities. Use of these sites will be by permit only.
j. Upgrade and designate three formal sites on the Salmon River State Forest (Oswego 8). A permit will be required to occupy these sites.
k. Rebuild the lean-to along the trail on Chateaugay State Forest (Oswego 4 & 5).
l. Build one lean-to on Cuyler Hill State Forest (Cortland 6).
m. Inspect and, if necessary, repair or replace lean-tos on the Finger Lakes Trail.
2. Propose a change to the current regulations to address the conflicts encountered with camping within 150 feet of a road.
a. Propose a change to the current regulation that prohibits camping within 150′ of any road. The intent of this proposal is to accommodate the style of camping that is common during hunting season.
3. Provide camping opportunities on State Forests for people with disabilities. These ADA compliant facilities will be distributed throughout the Region. Most of the designated campsites will have fire rings and several of the sites will have picnic tables. Fire rings, picnic tables and benches will be of Universal Design. Accessible latrines will be located at areas with several campsites, such as Long Pond, Stoney Pond and Charles E. Baker State Forests. All camping areas that can be driven to will have at least one accessible parking space. a. Make alterations to the Moscow Hill campsites on the Charles E. Baker State Forest (Madison 1 & 4) so that at least four of the sites are accessible by people with disabilities.
4. Designate 14 campsites at Moscow Hill, Madison 1, camping area.
5. Maintain 85 existing campsites.
6. Propose a regulation to prohibit camping at Nanticoke Lake Multiple-Use Area and Redfield Island Day-Use Area
7. Remove the lean-to on New Michigan State Forest (Chenango 5) This lean-to is structurally poor and is no longer located on an active trail. The lean-to proposed in 1. d will replace this lean-to.