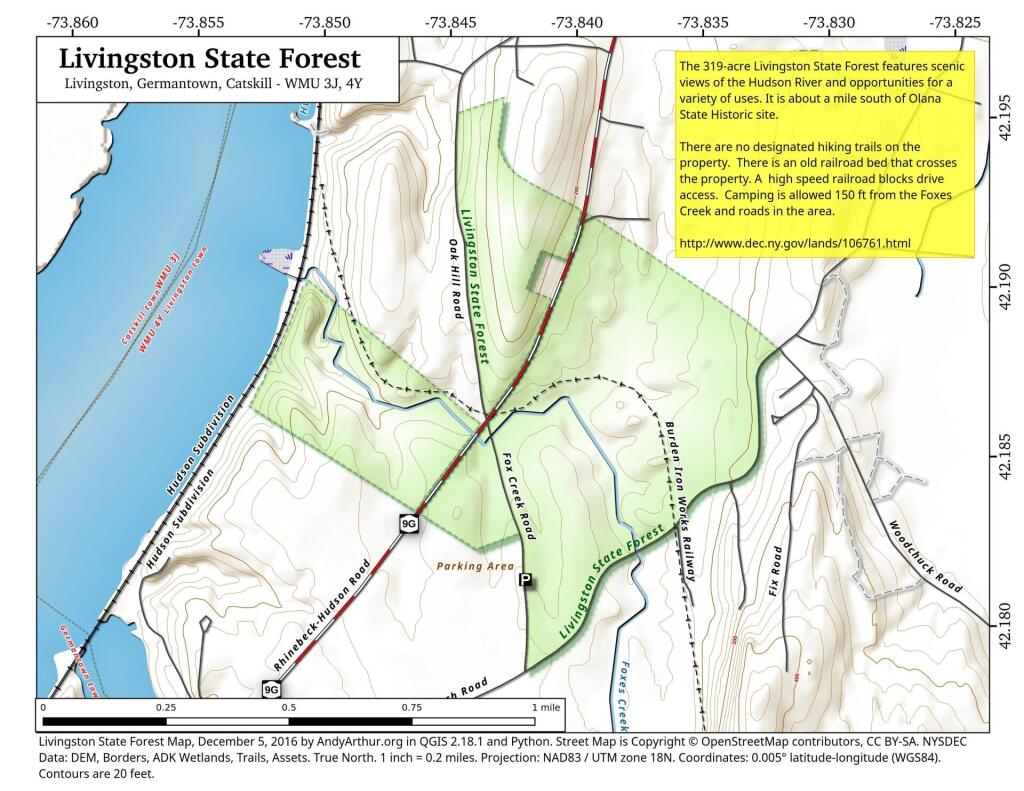
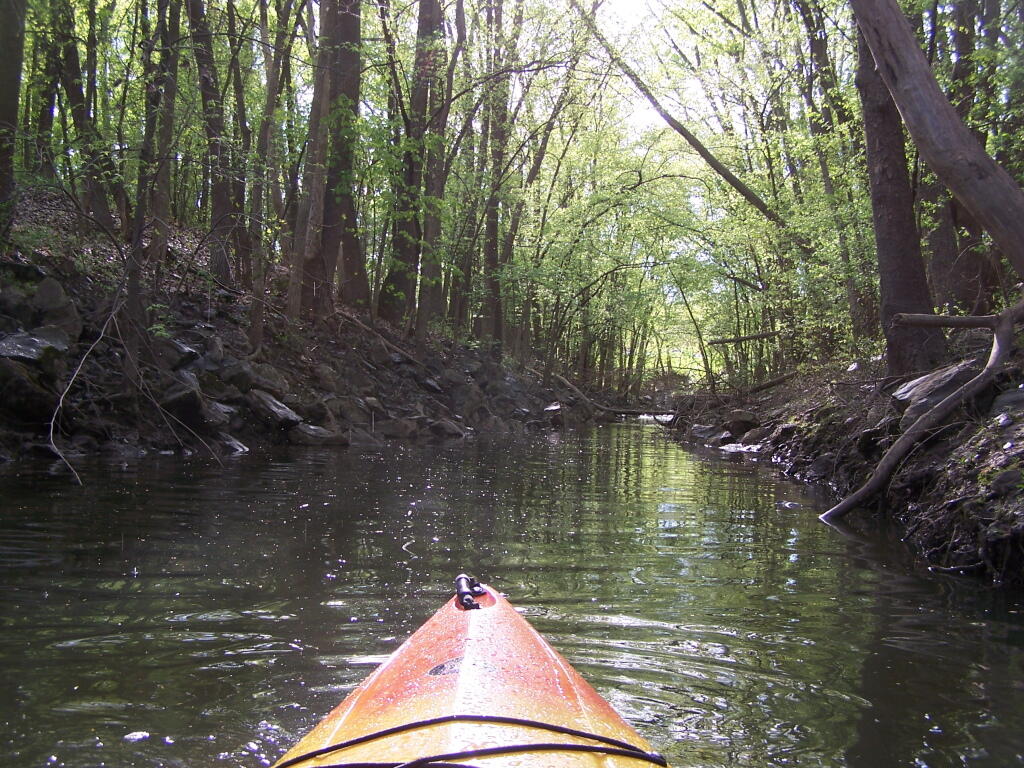
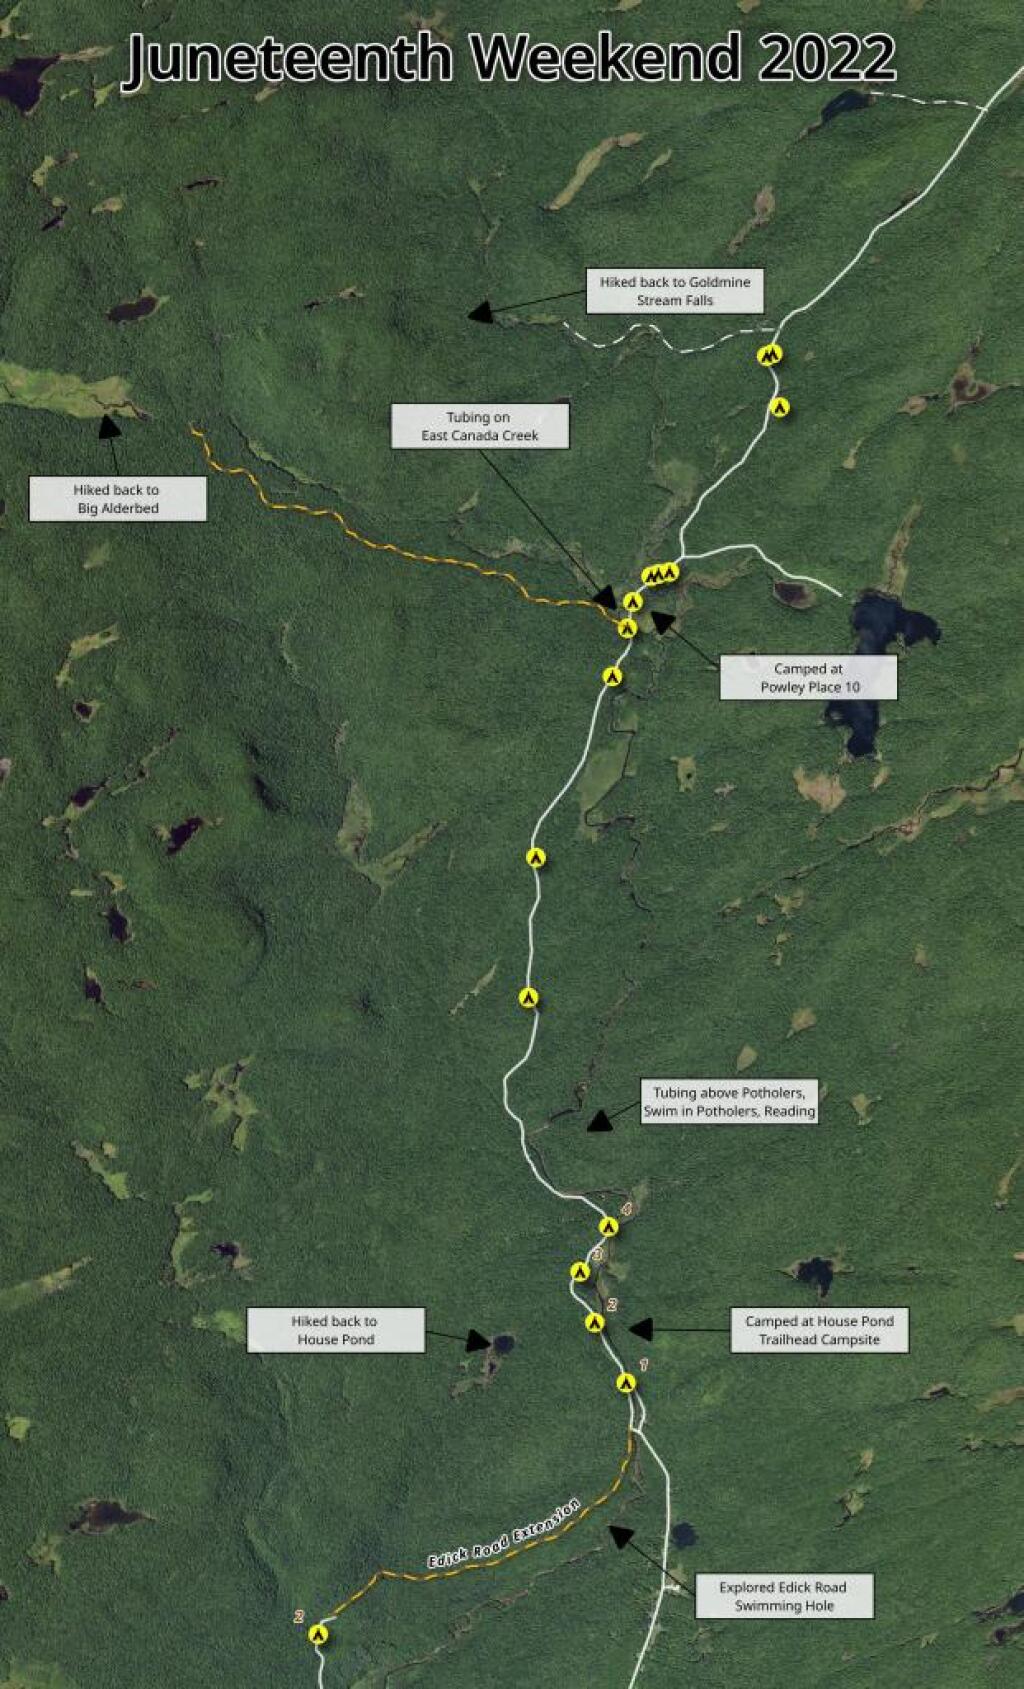
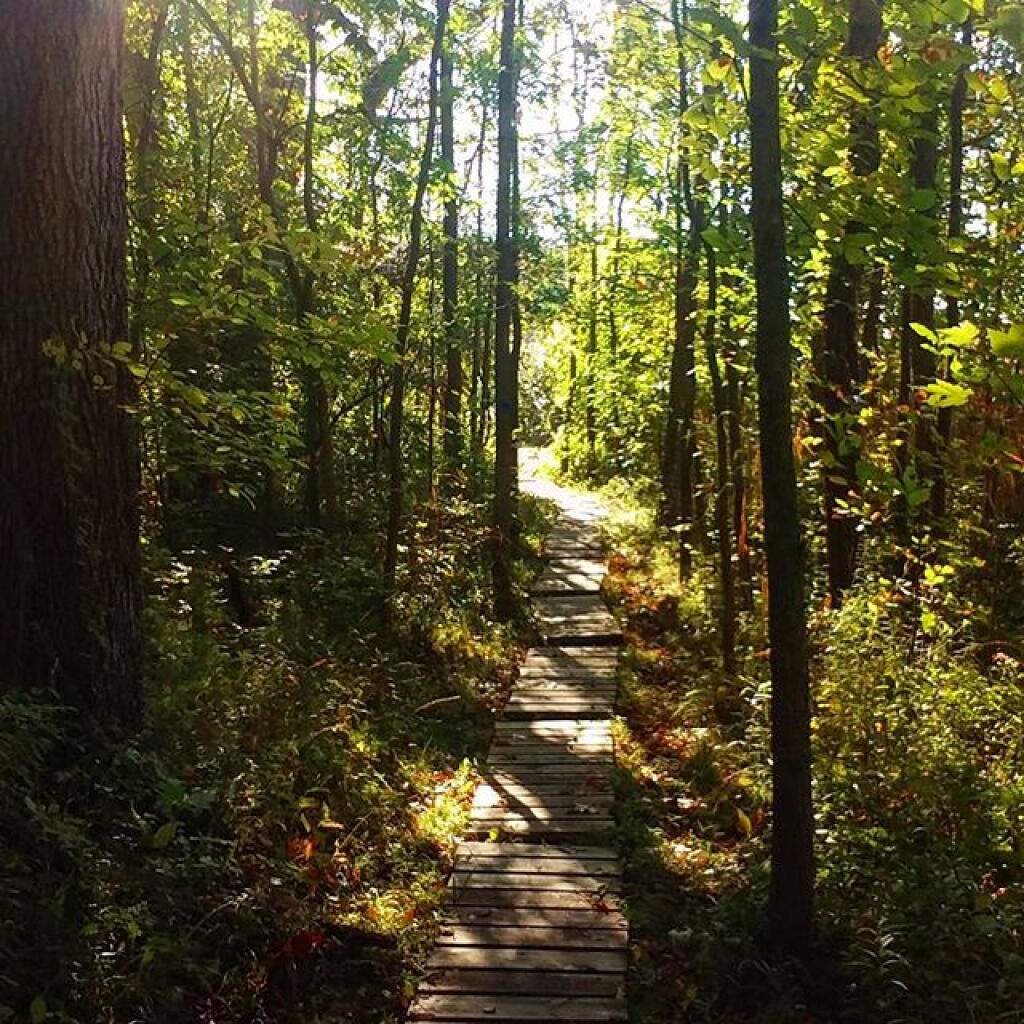
Most people have probably never kayaked between Albany and Troy on the Hudson River. Yet, it’s a trip one should make, because it’s both fascinating and relaxing, as you paddle between two cities through a lush green landscape.
Not only is the Hudson River conviently located between the two cities, a short drive for residents of the Capital Drive, it demostrates the solitude one can get, and still be within a couple of miles of major former industrial cities in Upstate NY.
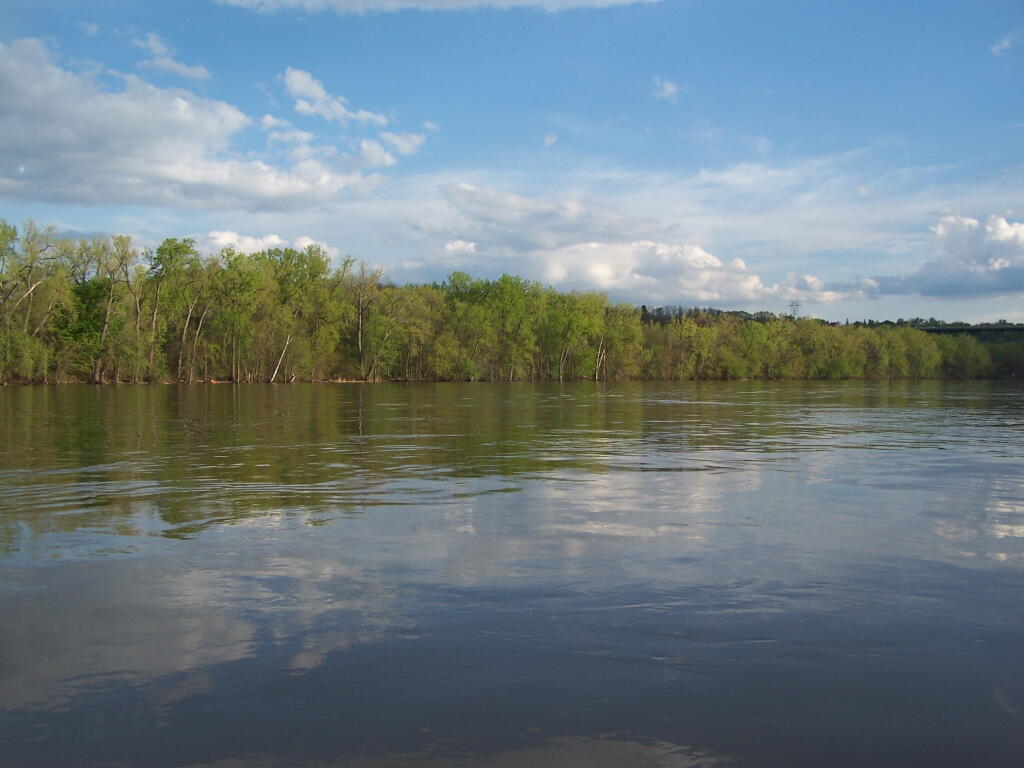
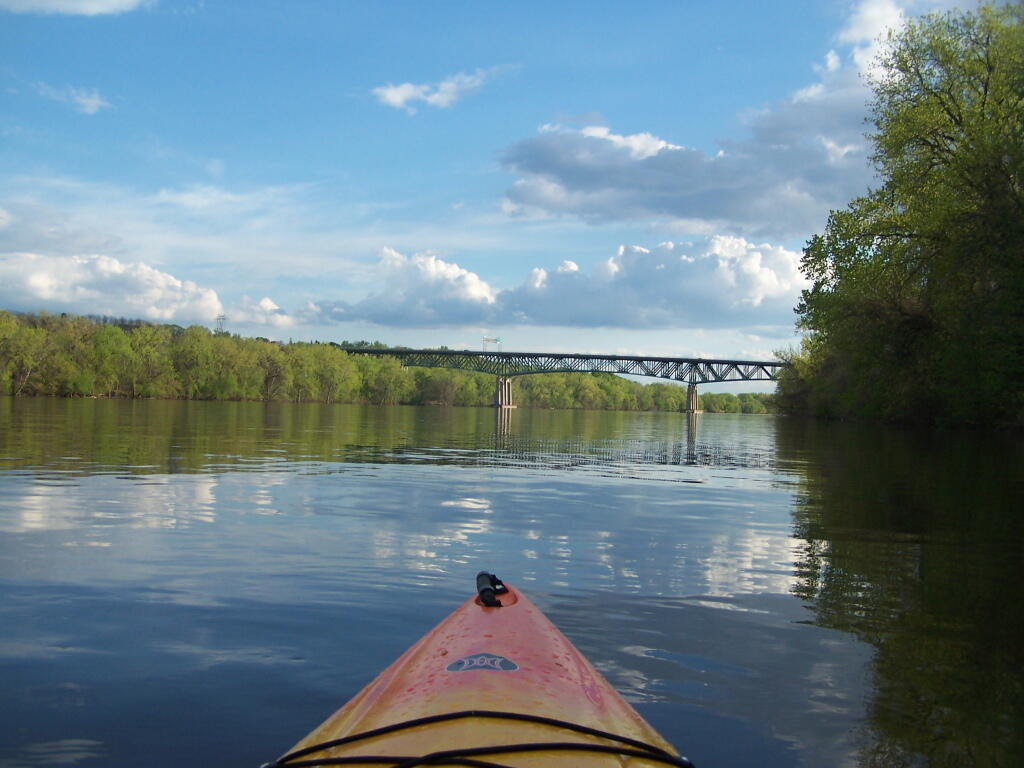
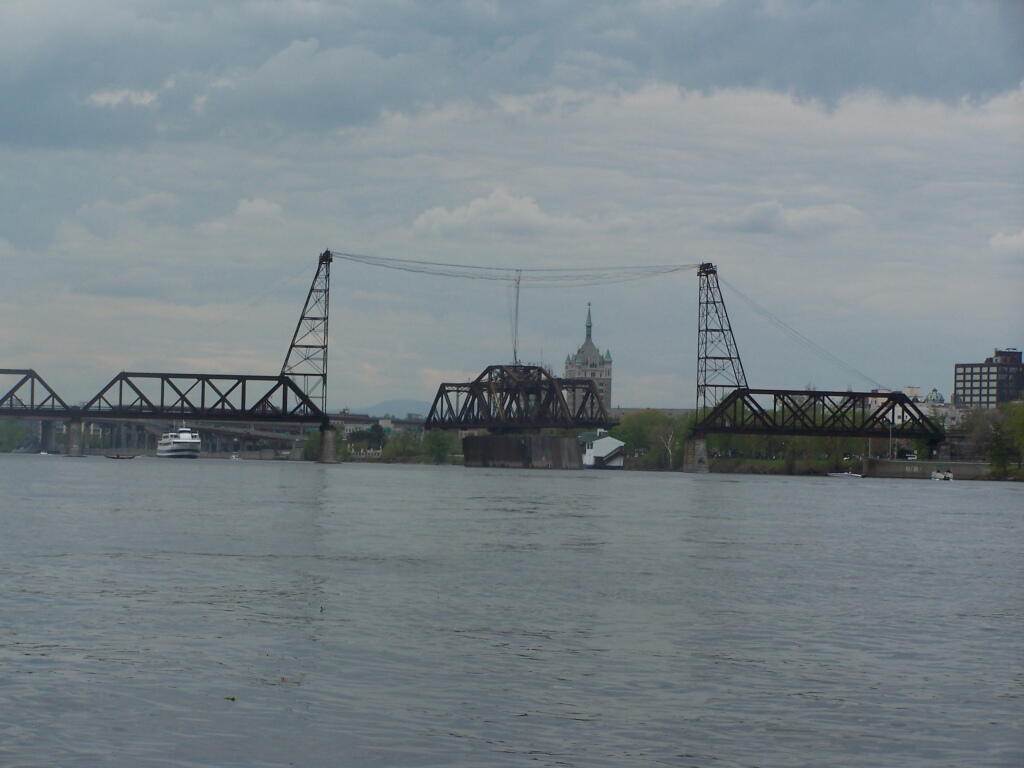
It shows the scale of man’s industrial works up close, as they tower far above you. Who would have ever thought the South Troy Bridge was so tall?
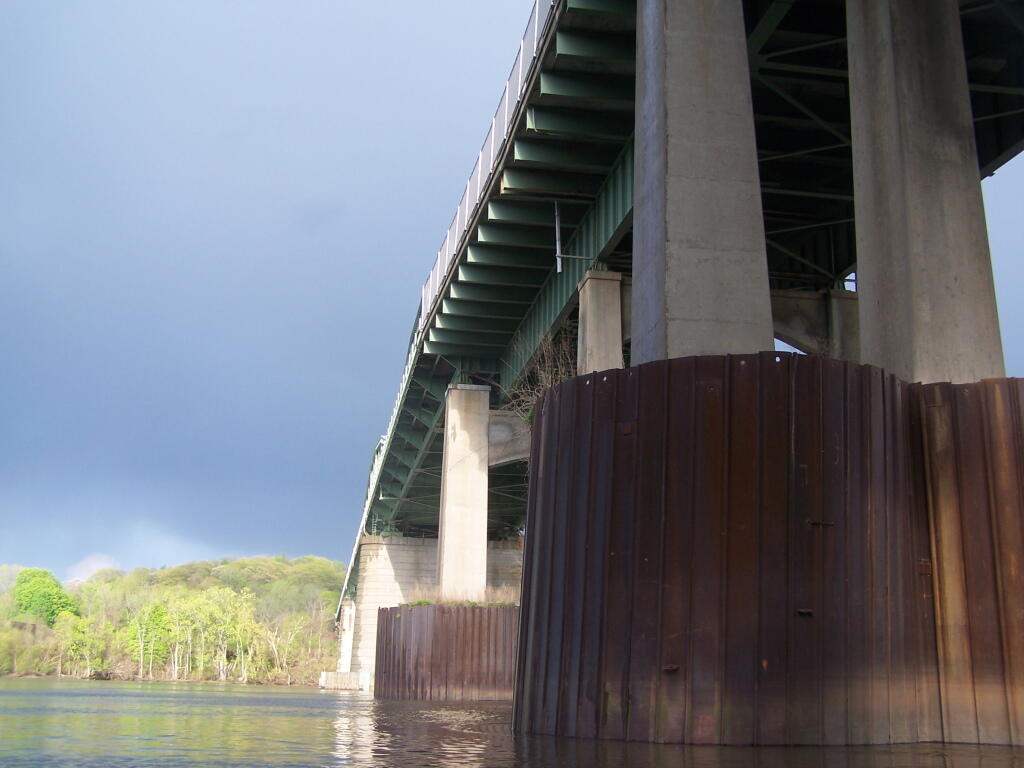
And while the river is much cleaner then yesteryear, you will still smell the raw sewage floating in from some storm drains.
You’ll find secret little tributatories, all but forgotten about in the era of powerboats and superhighways that once buried important little rivers and creeks, and made islands into mainland.
You will get a new impression of the river and it’s many crossings, and the noisey automobile traffic that “flies” over the river.
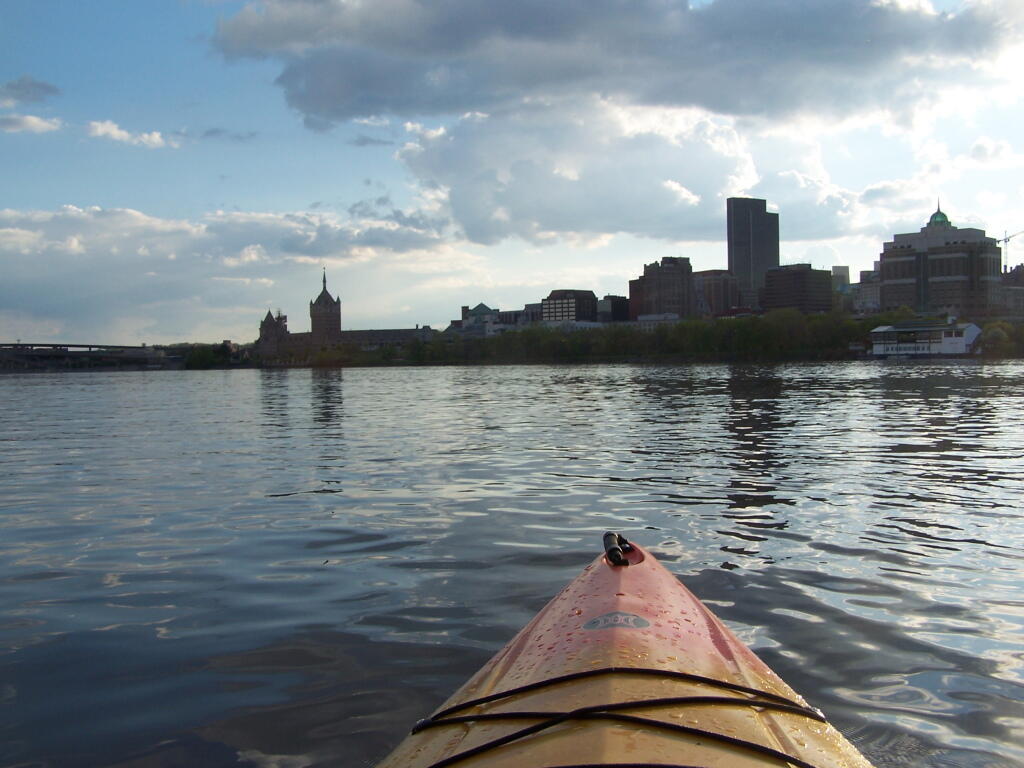
You’ll notice how nature’s creations tower far above our cities and urbanized areas.
And you’ll get a new look at the ordinary city, that often looked at as one passes it buy almost in an ignorant fashion.
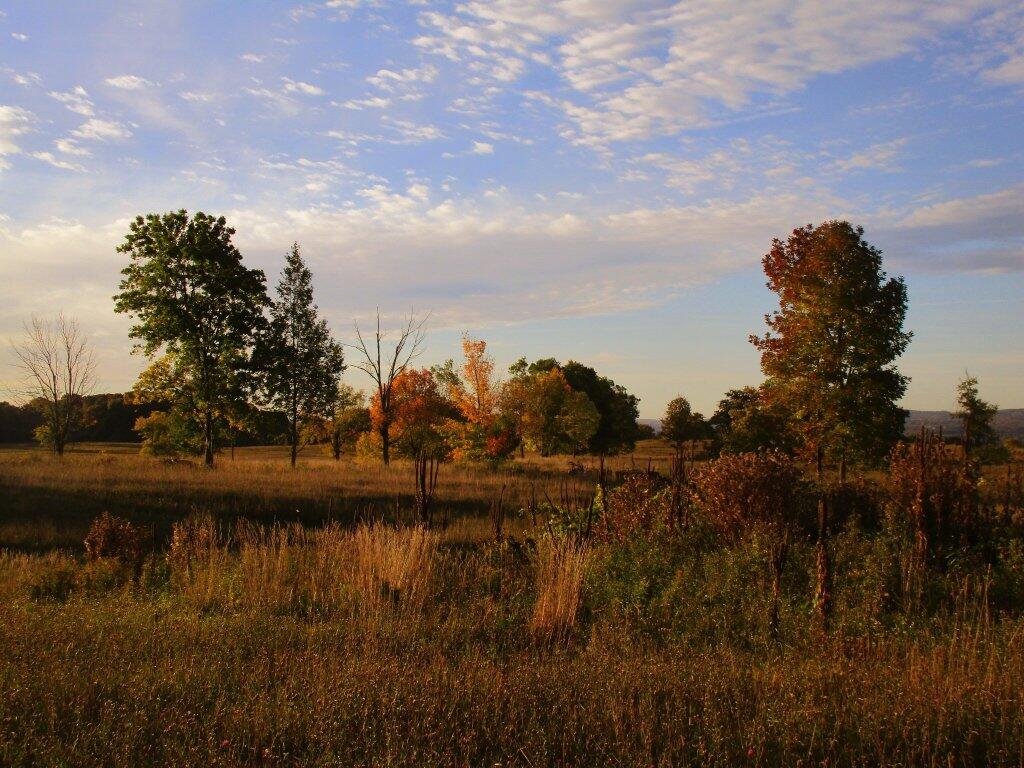
Last night, on my evening walk I was walking on the bike path past the Bethlehem High School, on the outskirts of the developed area of Delmar, looking across Sunnyside Farm and the rural hinderlands beyond it. I looked across the tall grass, and towards the Heldebergs. I saw the setting sun, with Bennett Hill predominately in the background. I felt like I really missed something.
It’s not an unfamiliar scene. Indeed, it’s a comforting one, I’ve seen for most of my life in the city, looking back through office windows towards the Heldebergs. They are just mountains, farm land, forest, and rural homesteads, something not really that uncommon in Upstate New York. Indeed, get a little ways out of any city in Upstate, and your in one of many vast rural areas of Upstate.
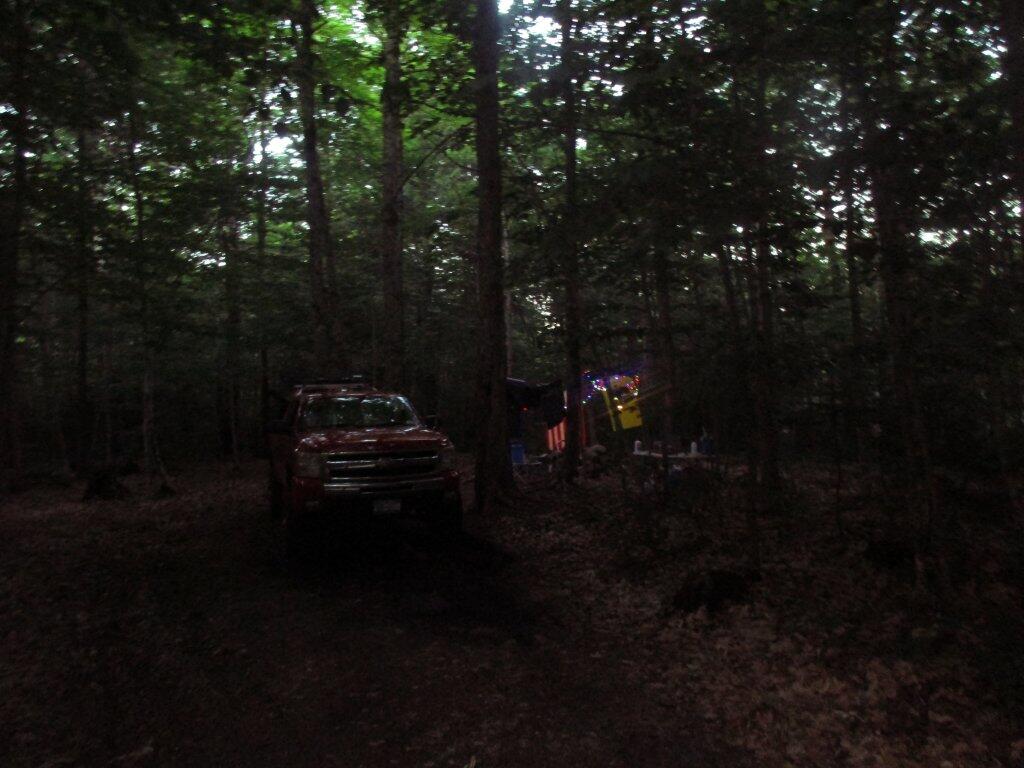
The town I live in is Delmar. I have lived here 5 years, taking the bus downtown every morning to work. I come home on the bus, have dinner, and in the summer months, head down to the park with a book. I walk to the library, the store, and go for delightful evening walks. I rarely use my truck at all on weekdays. It’s kind of nice not having to drive, or fill up the tank on weekdays. I can have a couple of beers after work, and not worry about getting pulled over. I can come home fatigued, and not fear an accident. On weekends I hop in my pickup, go up to woods, to camp, hike, explore.
Yet, I feel something is missing…
I don’t really like living in the city that much. I don’t like the constant noise of traffic, the constraints of city life. While I can always hop in my truck and go places, now that I am in city, I doesn’t happen that much. In city, every place I would want to go – in the hills and mountains always seems so far away.
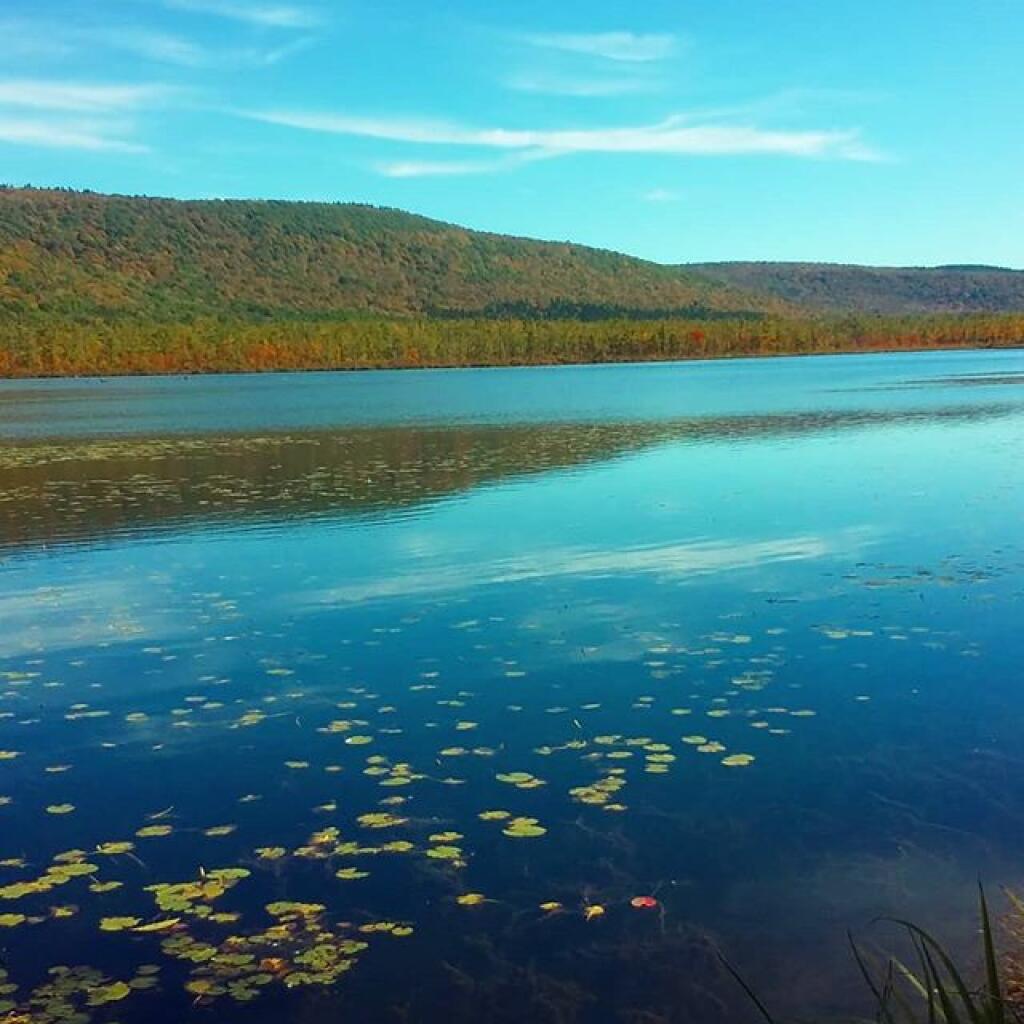
I guess for now I am content with how things are going. The Adirondacks, the Green Mountains, and the hilltowns remain within a fairly short drive, that I can get to on weekends. I can spend my weekends in the city, and then spend the money where I enjoy it most. But still I am less then happy with current arrangements.
Census Block Equivalency – A list of census blocks in each district, generated by the commerical GIS program (such as Mapitude) used for redistricting.
Metes and Bounds – A legal description of each district, used in resolving court disputes over district boundaries, and assisting board of elections on where to put voters whose property might be crossed by a Census block
If you planning on making a map, Metes and Bounds won’t be particularly useful. Computers don’t understand english very well, they need numbers and lists. In contrast, the Census Block Equivalency is very useful for mapping things.
Every year, the Census Bureau puts out series of ERSI Shapefiles known as TIGER/Line. You can download TIGER/Line for any state and county in the United States from their website. They provide many different shapefiles and layers such as a Highway, Faces, Edges, and County Subdivision layers, however the one you will be most interested for making district maps is the Tabulation Block (tabblock) layer.
You can use these files in the free program known as Quantum GIS or QGIS. While this tutorial will not explain the ins and outs of QGIS, this should get you started on making redistricting maps.
The Tabulation Block Layer is the file containing all of the Census Blocks for a particular county. A Census Block is the smallest unit of population gathered by Census Block, and consists of all bordering features (bounds) — roads, rivers, shorelines, along with all imaginary lines (metes) — town lines, village lines, other lines drawn for statisitical purposes.
Each Census Block has a number, that is a subdivision of the Census Block, County ID, and State ID that it resides within. For example, the Governor’s Mansion in Albany is located in Census Block 2000 in Census Track 23.00 (zero padded to 002300) in Albany County (Federal Information Processing Standard — FIPS ID: 01) which is in NY State (FIPS ID: 36). County subdivisions are not applied to Census Tract Numbers, as they may in some cases cross county subdivisions, as is the case of smaller districts.
You put those numbers together to get the GEOID — which is the key used for redistricting block lists and most other block-level census data. The Governor’s Mansion is located at a block with a GEOID 360010023002000.
36
001
002300
2000
State ID
County ID
Zero Padded Census Tract Number
Census Block Number
The block list you get from a redistricting commission typically is in Database Exchange Format (.DBF) or Comma Deliminated Format (.CSV) which are both openable by common spreadsheet applications like Microsoft Excel or OpenOffice Spreadsheet and GIS programs like ArcGIS or Quantum GIS.
This is taken from the LATFOR State Senate Proposed Districts (January 2012) DBF file. It shows you that the Governor resides in Proposed Senate District 44. Across the river in Census Block 4010, Census Tract 524.03, in Rensselear County (FIPS ID 83), NY State (FIPS ID: 36) is located in Proposed Senate District 43.
360010023002000
SD44
360010021002008
SD44
360010021002004
SD44
360010021002001
SD44
360830524034017
SD43
360830524034010
SD43
Download the TIGER/line “Tabulation Block” Shpaefile file for the district you are interested in. You will want the 2010 version. You can download a state-wide tabulation block file, however that is not recommended as the next step will be impossibly slow on most computers. You may also want to open the .CSV or .DBF file in your spreadsheet program and cut out the county you want to speed things up.
You will then want to open up the file in Quantum GIS. You will get a nice map of the county you downloaded, showing all of the Census Blocks.
From there, go to the Vector -> Join Attributes submenu.
Make sure that the Target vector layer matches the Tabulation Block Shapefile you wish to join against, then set Target join field to GEOID10 .
Select click Join dbf table and select the DBF or CSV file you wish to join.
Change the Join field to BLOCK or whatever the GEOID is titled in your redistricting block file.
Enter in a location to save the Output Shapefile
Click okay.
Then wait. A typical county will take 10-40 minutes to join on my 5 year old laptop; your computer may be quicker. If you have a dual processor machine, go on to doing other work in other programs. You will end up with a map that looks like this (stylized for your enjoyment). Each block will be assigned a Senate District (in this example).
Halfway there. Now you need to “dissolve” each Census Block into it’s larger political district. Go to Vector -> Geoprocessing Tools -> Dissolve . Set the Input vector layer to the file you previously joined. Then set the Dissolve field to the field containing the district number — such as DISTRICTID or whatever it is named. Enter a name to safe the file. Click Dissolve.
Outputed will be a Shapefile containing all the political districts in the county you joined and dissolved. This will take 5-20 minutes on my laptop. Other data may exist in that file, such as Census Block number, however at this point that data will be invalid, as only the district number is accurately preserved in such a join. All other data will be picked at random, so delete those columns.
I hope this is helpful. If you just want the Proposed State Senate or State Assembly Districts you can download them from Center for Urban Research. These are the same data, joined using the above process by somebody with a much faster computer. I have also made up a Shapefile containing the Albany County Legislative Districts using this process.
I have in the past made maps up of New York State’s population, divided by population density or actual population per municipality. I almost always have to distort that maps for Upstate to show any detail, because of the extreme population concentration downstate, specifically in New York City.
Simply said, there is nothing in Upstate New York at all like downstate. There simply are not the concentrations of people or dense urban core. Our Upstate cities are dense compared to the surrounding countryside — often as much as 100 times more dense (e.g. 100 times more people per mile), but Manhattan is 9 times more dense then even our most dense upstate cities.
New York is truly a metropolitian area, unlike any other in New York State, and like few in America. I welds immense power not just over itself but the more rural parts upstate, and the surrounding countryside that seems — at least to the city folk — so unimportant compared to their extremely dense and complicated living arrangements.
Most times when you look at maps, they contain a lot more information then just roads. Most maps have parks, water bodies, road names and numbers. Lots of data to make the map useful. Yet, that distracts from the main purpose of roads — a circulatory system for the state’s commerce, to allow goods and people to move freely across the state.
As you will see, Highway Systems could almost be maps of human veins and arteries. Terrain plays a role in highway systems, though modern highways can blast their way through almost any barrier, climb any hill, cross any water body, to be fully connected. Highways go where people have historically chosen to engage in commerce.
Expressways, Primary Arteries.
These are the most traveled and most important arteries of NY State, that allow commerce to flow across state. Not too surprising, but shows how cities across our state are connected.
Various NY State Cities.
Many Upstate Regions have similar looking arterial systems. There is an urban street grid, then a twisty suburban street grid, with major arterial surrounding the cities, often only partially completed after 1973 when Nelson Rockefeller canceled most major urban highway projects due to the recession and increased concern about urban expressway impacts. The arterial system around Binghamton is particularly interesting, as a reflection of the deep alluvial valleys and rugged terrain that surrounds this relatively small city.