All figures are in acres except where noted. Table updated April 2011. Reprinted from the DEC Website.
Land Classification
Region
1
Region
2
Region
3
Region
4
Region
5
Region
6
Region
7
Region
8
Region
9
Catskill
Park Total
Adirondack
Park Total
State
Total
Percent of Total
State Land and
Conservation
Easements
State Forest
16,056
758
31,763
102,248
58,354
221,924
200,419
55,581
99,121
–
16,264 **
786,224
17%
Forest
Preserve
Wilderness
–
–
89,352
53,482
954,601
206,151
–
–
–
142,834
1,160,752
1,303,586
28%
Wild Forest
–
–
75,588
60,368
938,664 **
367,123
–
–
–
135,956
1,305,787
1,441,743
31%
Primitive
–
–
–
–
31,309
15,704
–
–
–
–
47,013
47,013
1%
Primitive Bicycle
Corridor
–
–
15
283
–
–
–
–
–
298
–
298
0.006%
Canoe
–
–
–
–
18,989
–
–
–
–
–
18,989
18,989
0.4%
Intensive Use
–
–
4,104
1,542
21,591
1,828
–
–
–
5,646
23,419
29,065
0.6%
Administrative
–
–
392
0 ***
384
7
–
–
–
392
391
783
0.02%
Historic
–
–
–
–
531
–
–
–
–
–
531
531
0.01%
Pending
Classification
–
–
–
–
259
111
–
–
–
–
370
370
0.007%
Under Water*
(Unclassified)
–
–
–
–
17,395
6,534
–
–
–
–
23,929
23,929
0.5%
Detached
Parcel
–
–
1,382
4,141
1,441
4,318
–
–
–
–
–
11,282
0.2%
Total Forest Preserve
–
–
170,833
119,816
2,001,313
601,776
–
–
–
285,126
2,597,267
2,893,738
61%
Wildlife Management Area
6,007
–
12,021
18,518
6,524 **
46,371
49,562
41,462
17,178
407 ***
2,755 **
197,643
4%
Conservation Easement
108
21
7,264
7,286
488,463
336,783
436
–
10
9,437
769,579
840,371
18%
TOTALS:
22,171
779
221,881
247,868
2,554,654
1,206,854
250,417
97,043
116,309
294,970
3,385,865
4,717,976
100%
Notes from the DEC.
* Certain lake beds are considered Forest Preserve, despite some level of private ownership adjacent to the lakes. These underwater lands are not classified. For the purposes of this table, however, lakes and ponds that are completely surrounded by Forest Preserve have been classified the same as the adjacent land.
** Where State Forests and Wildlife Management Areas exist within the Adirondack Park, the Adirondack Park State Land Master Plan also classifies these lands as Wild Forest. However, since these lands are not Forest Preserve, State Forest and Wildlife Management Area acreages within the Adirondack Park were NOT included in the Wild Forest category.
*** Where Wildlife Management Areas exist within the Catskill Park, the Catskill Park State Land Master Plan also classifies these lands as Administrative. For calculation purposes in this table, however, Wildlife Management Area acreage within the Catskill Park was NOT also included in the Administrative category.
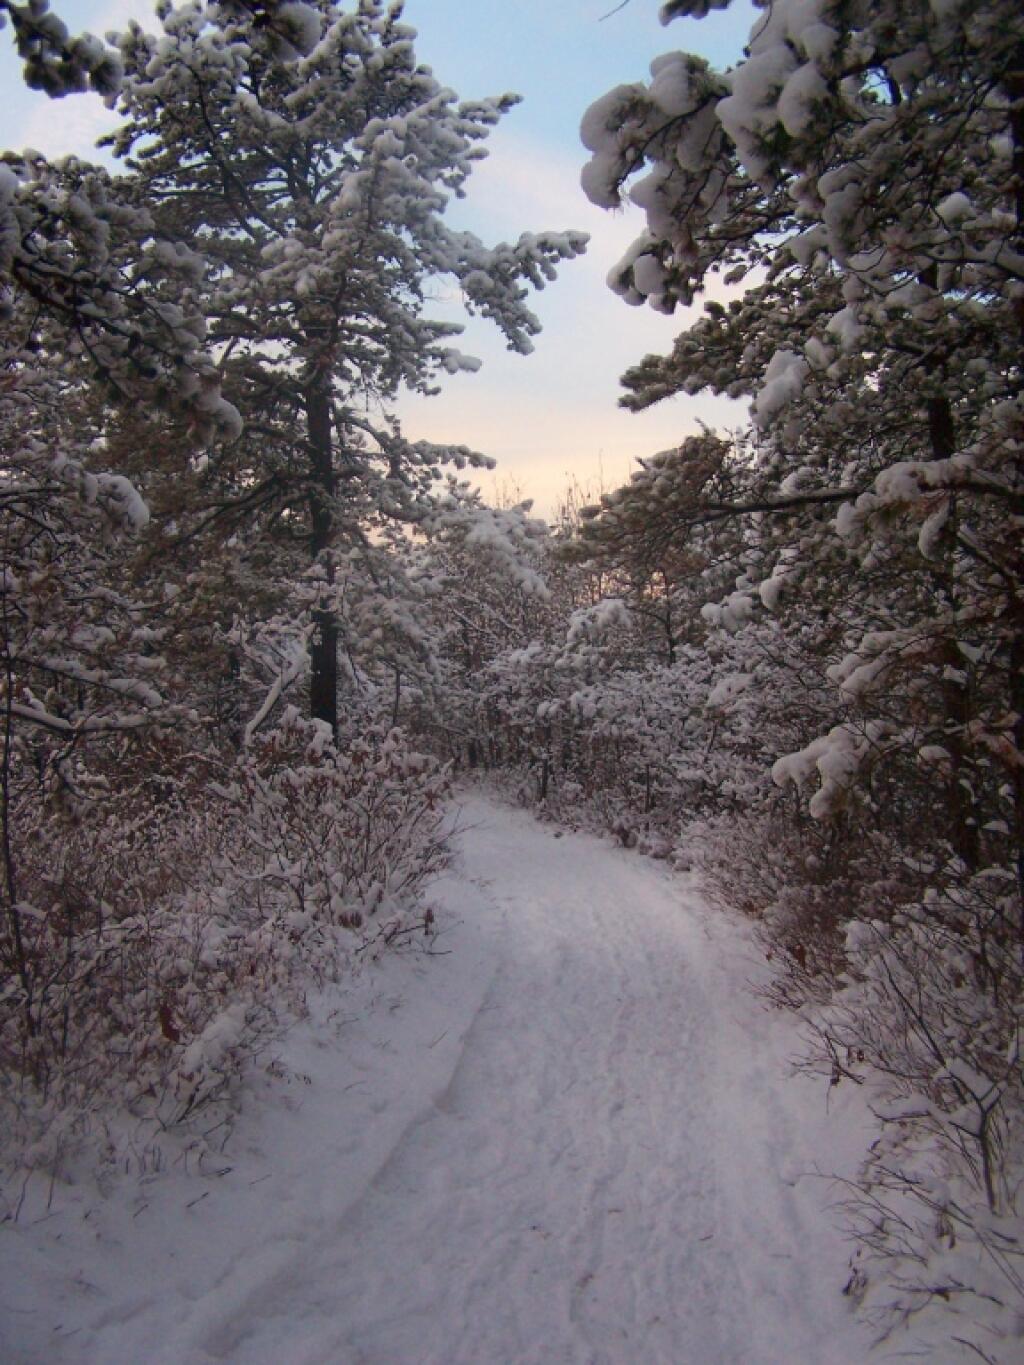
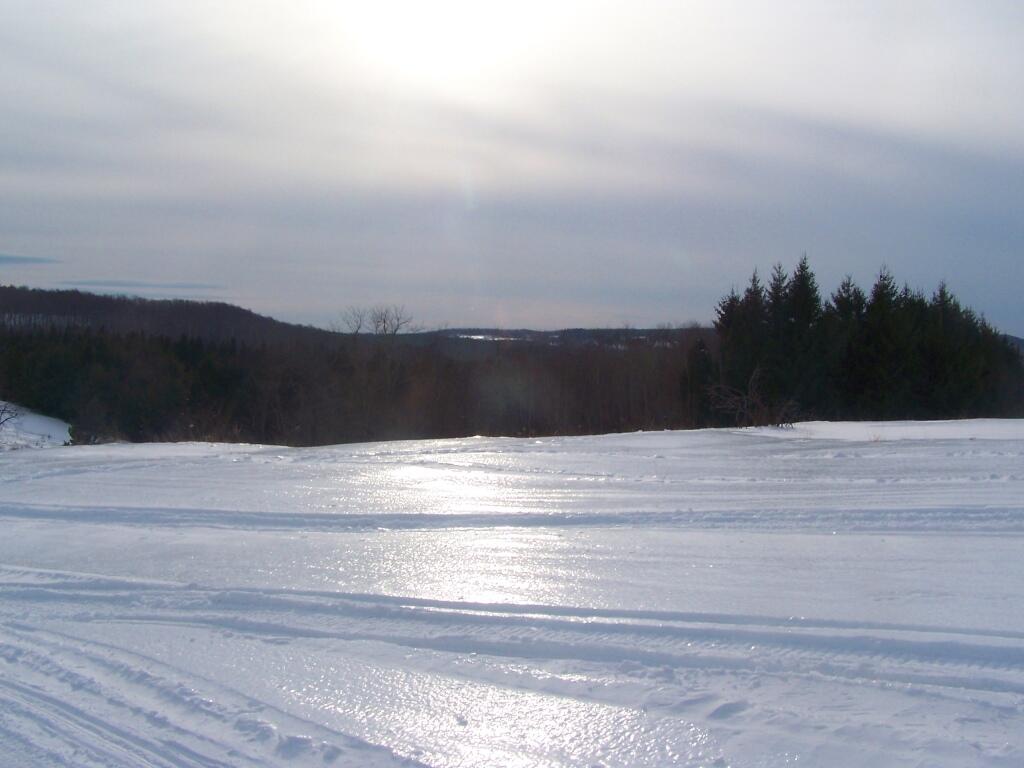
After a fresh snow fall it was a winter wonderland in the Albany Pine Barriens, a forever wild ecosystem on the outskirts of the city. It felt like one was walking through a marshmallow forest.
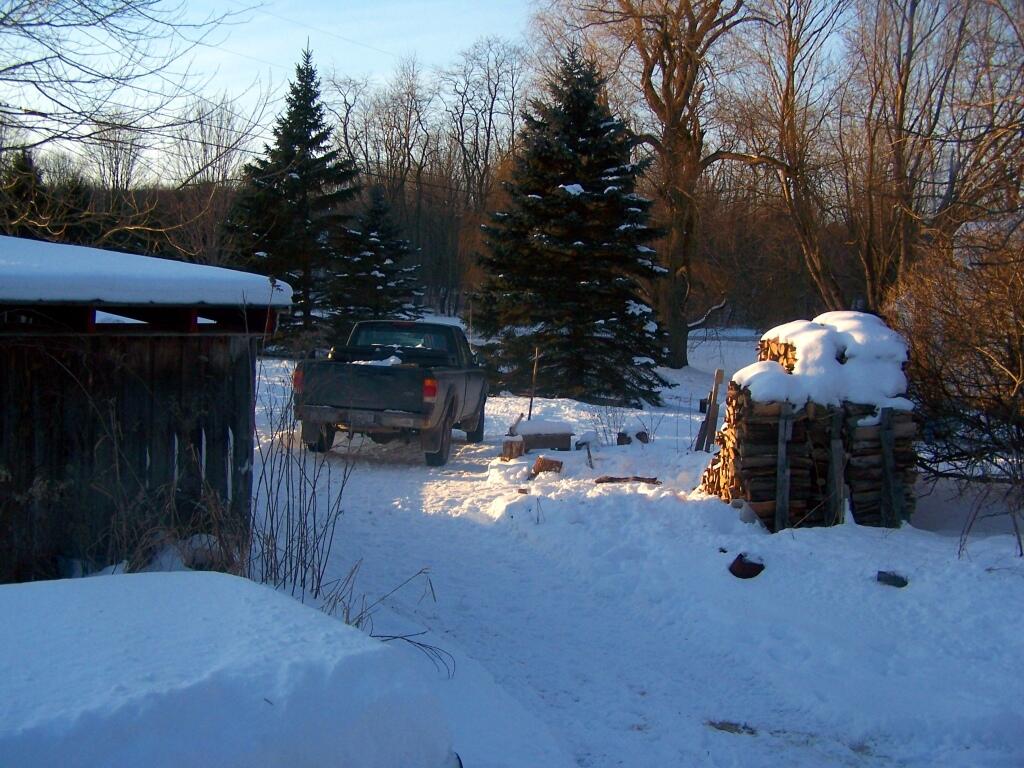
A cold winters day at my parents house in late January, after a long cold spell that never seemed to want to end.
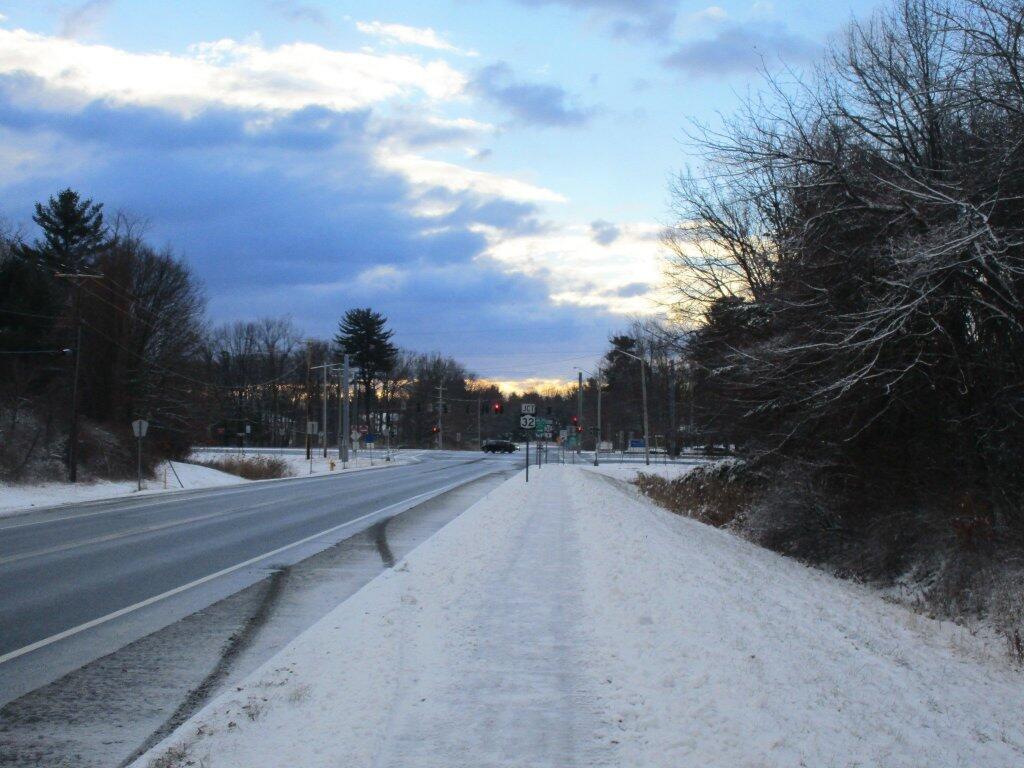
February.
A icy sheen shown on the snow at Partridge Run, as I went for an afternoon walk with the dogs up there in the middle of the month.
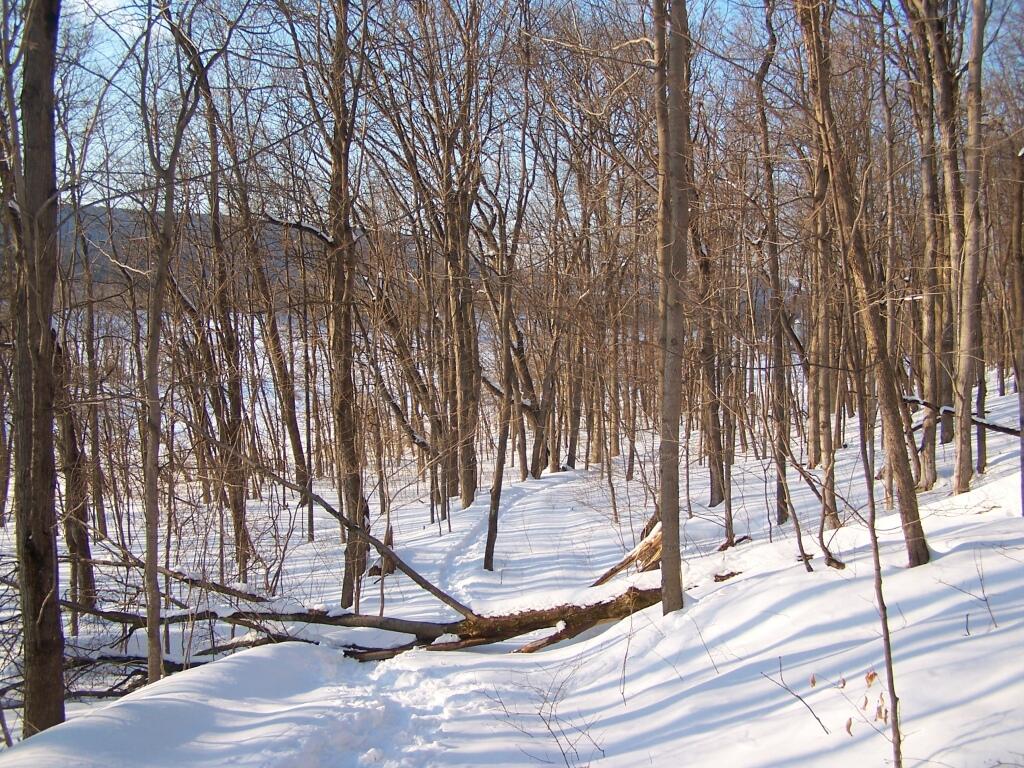
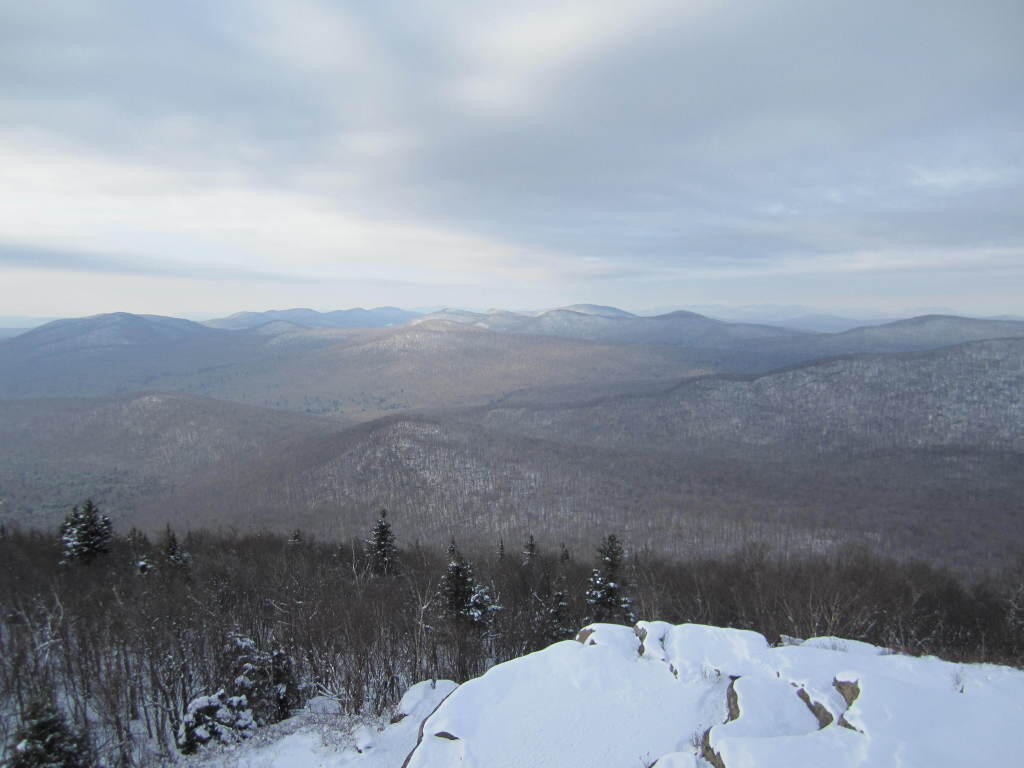
Snowshoeing back down Bennett Hill in late February.
March.
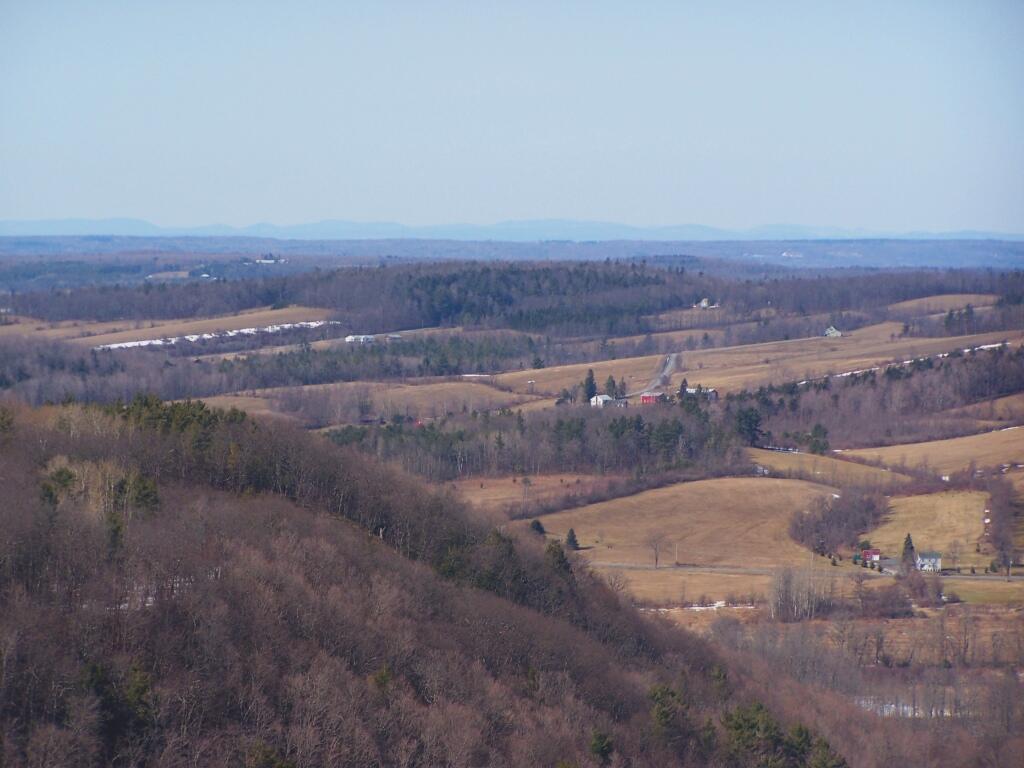
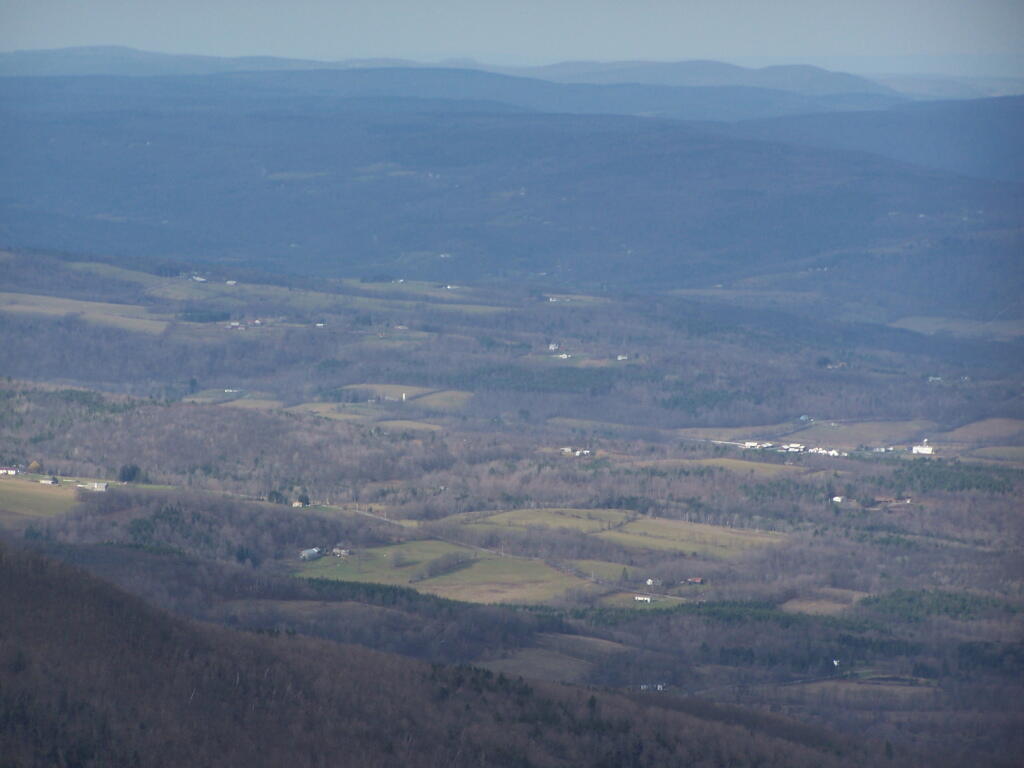
A recently logged section of Cole Hill provided breath-taking views of Irish Hill and the Fox Kill Valley down in Berne.
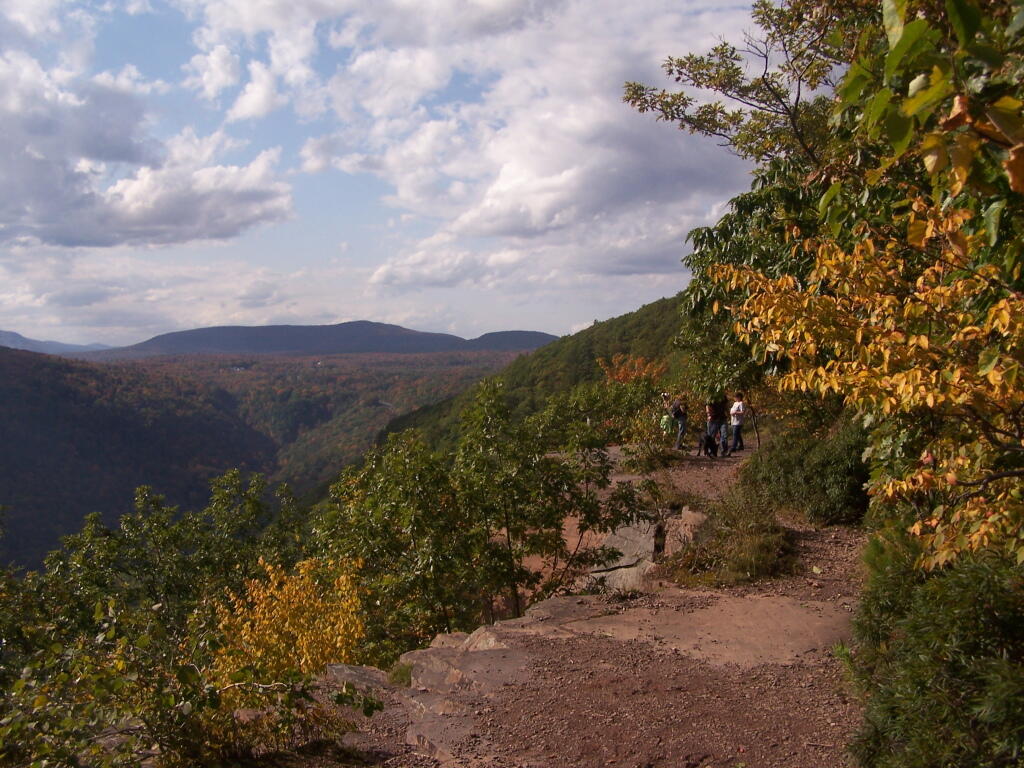
What a clear spring day up at Horseshoe Clove at Thacher Park. Warmer, nicer days can’t be far way.
April.
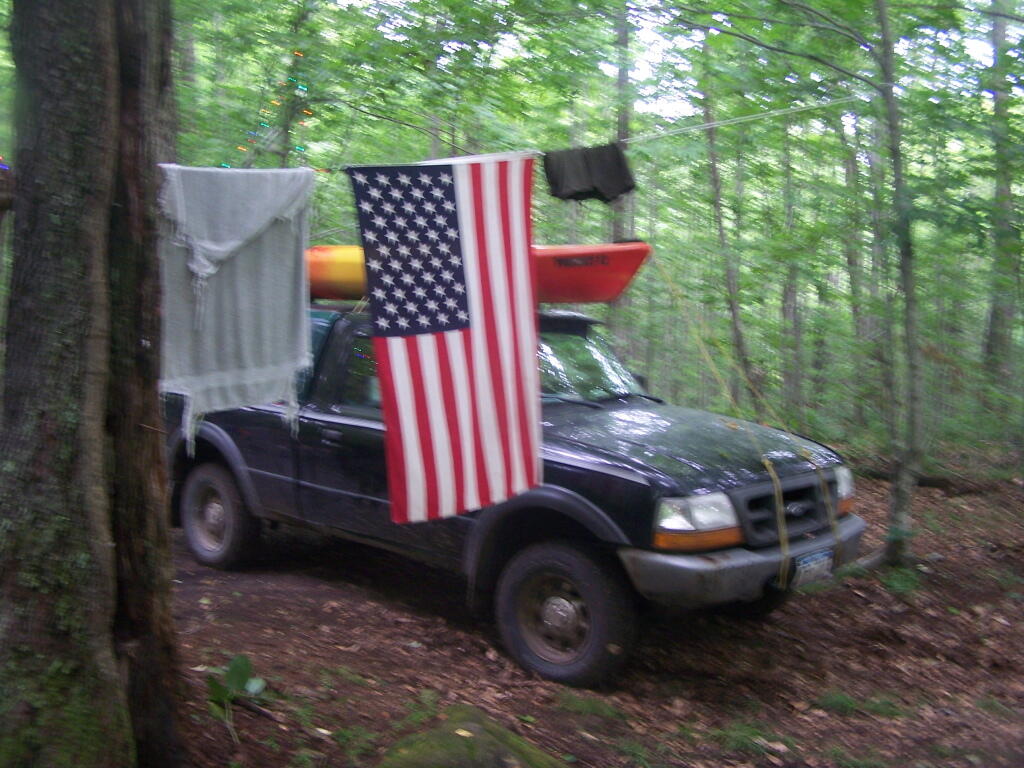
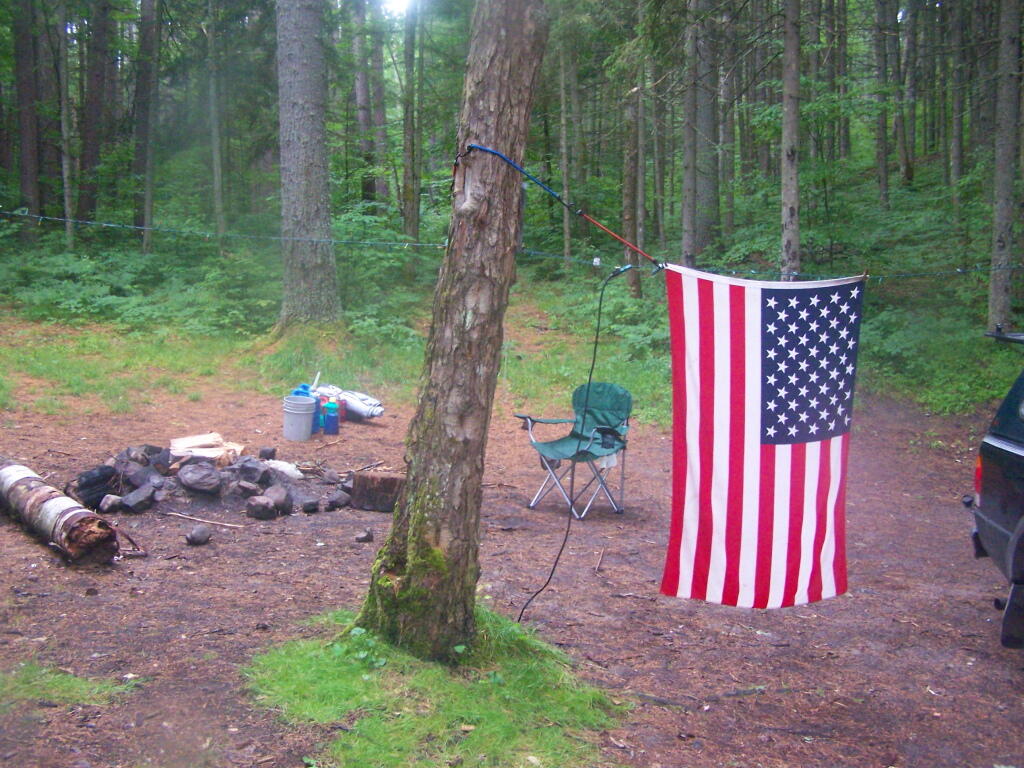
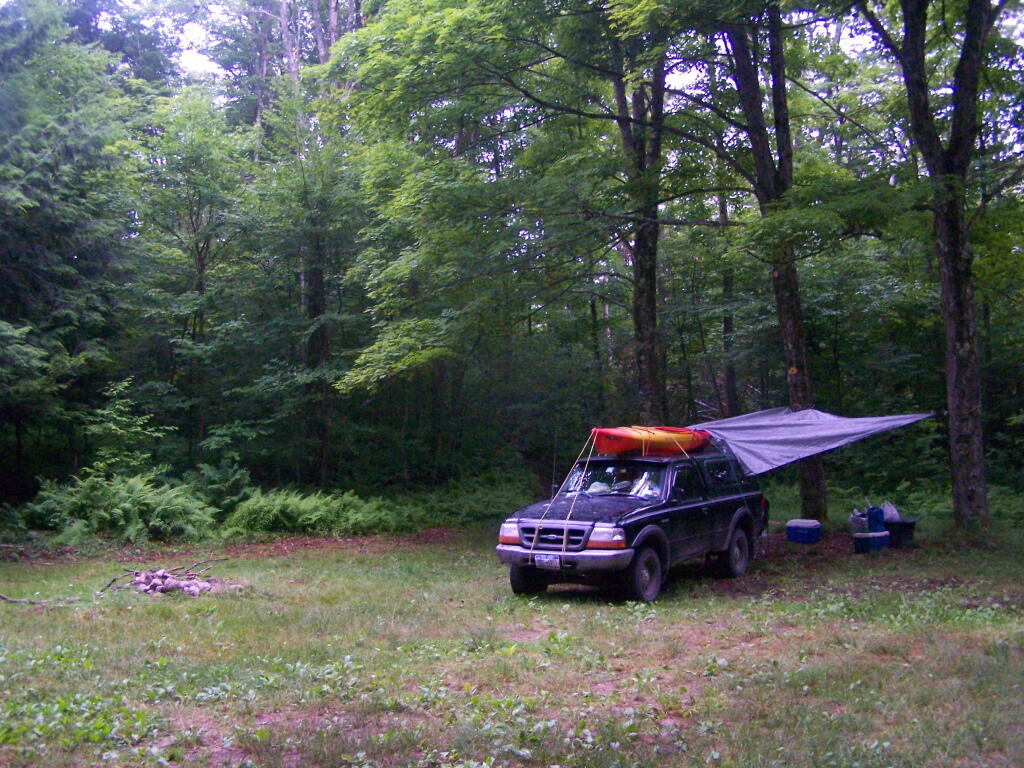
April 9th was the first day I got out camping in 2011. Spent the day exploring Rogers Environmental Center, camped at Moscow Hill Horse Assembly Area.
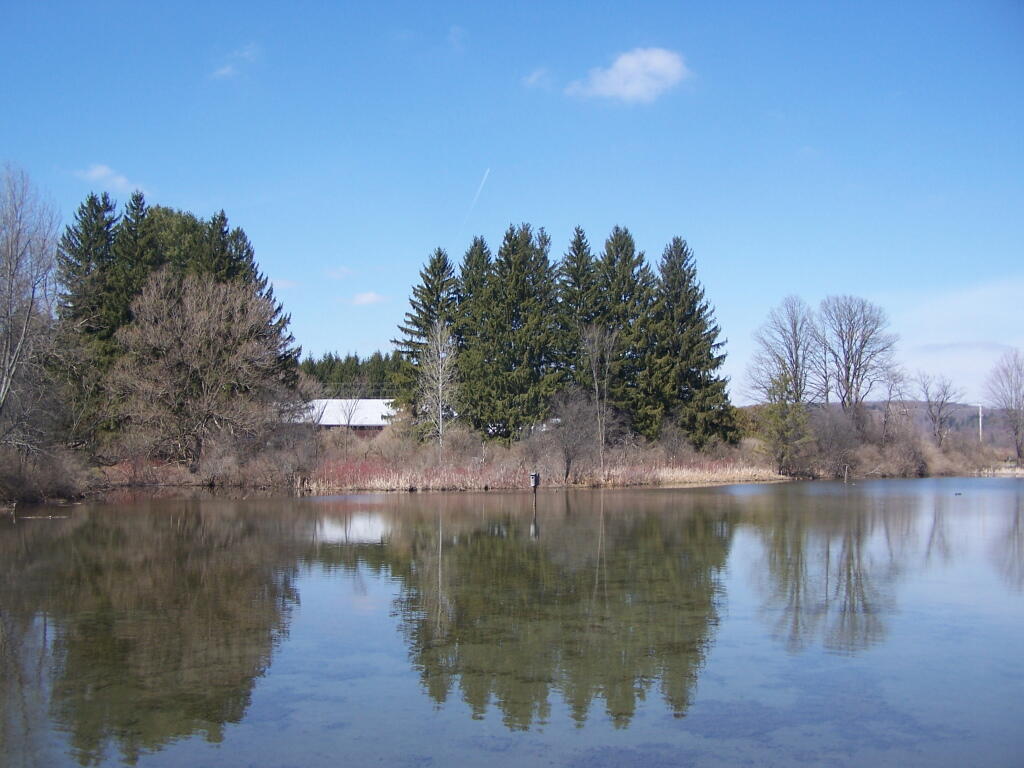
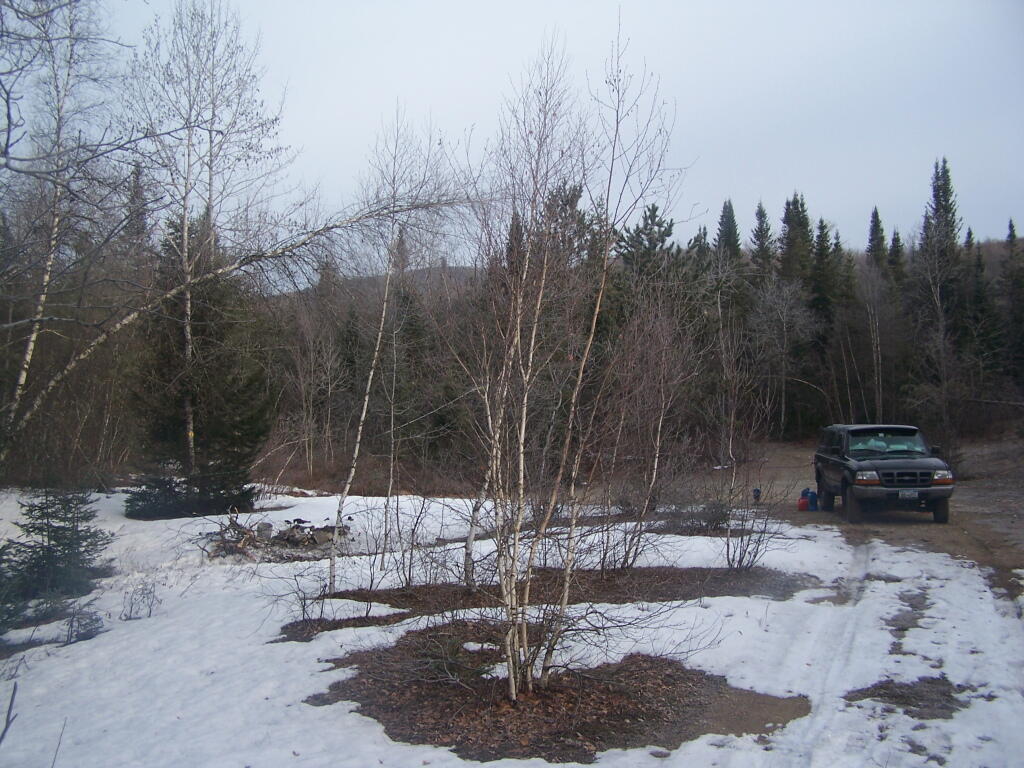
It may start to warm up earlier in lower elevations, but winter is still very much a force in late April in the Adirondacks. The East Sacanadaga River on this morning looks icy and cold.
May.
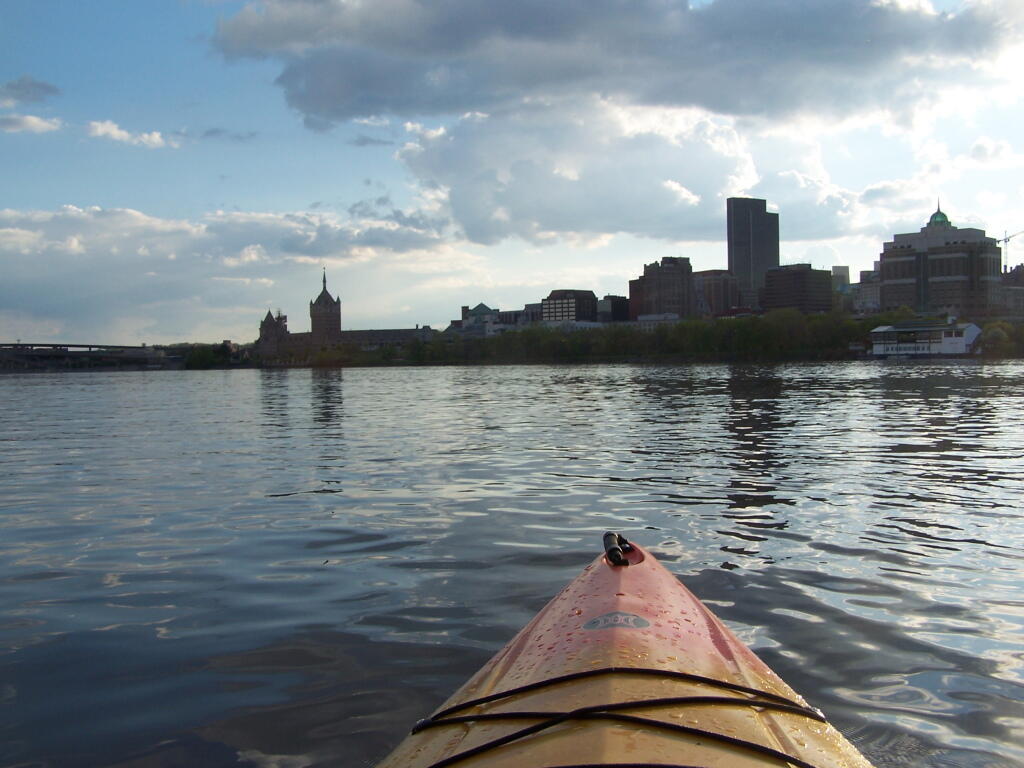
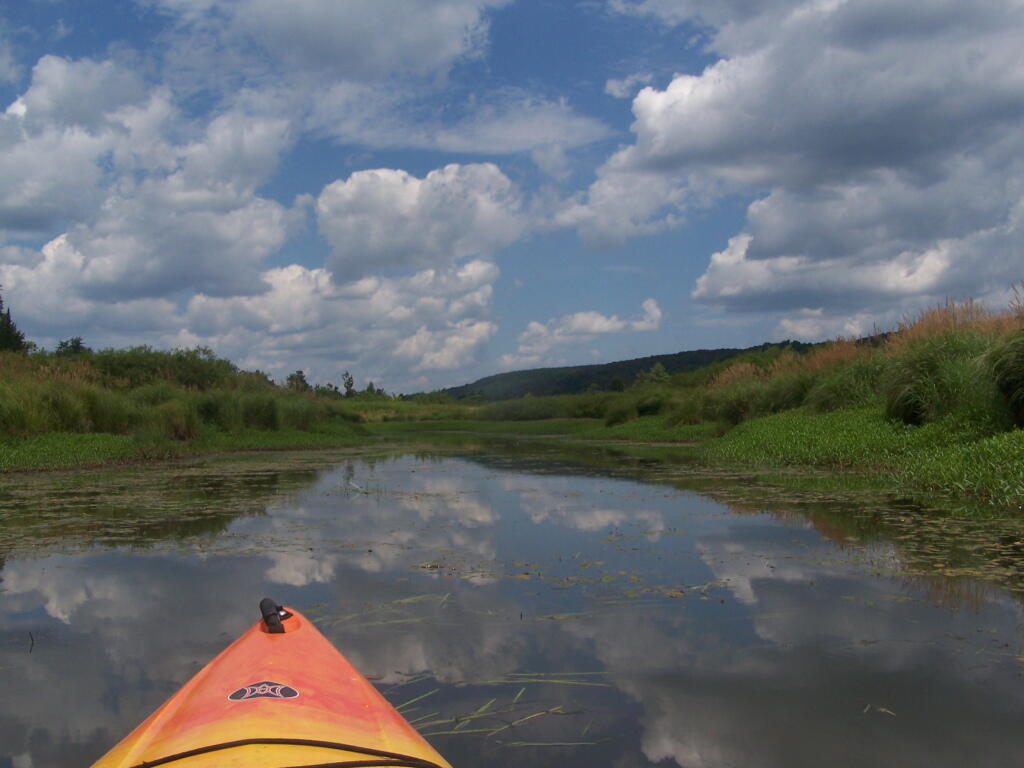
There’s Albany! From my kayak. I kayaked up to Downtown Troy from the Corning Preserve.
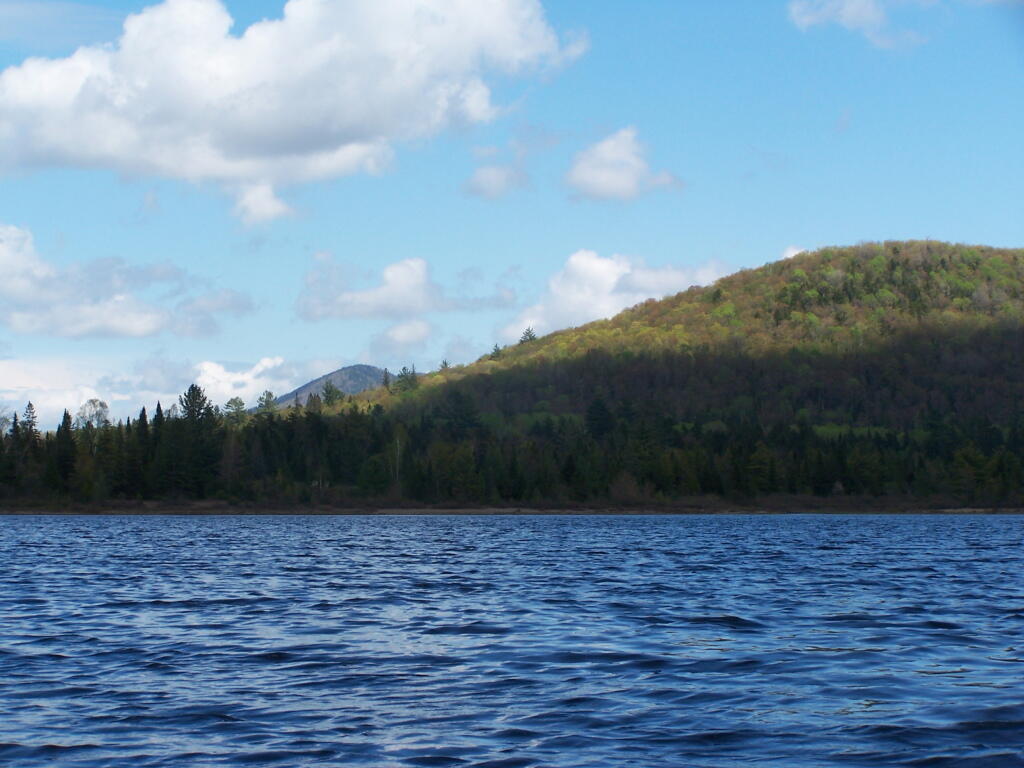
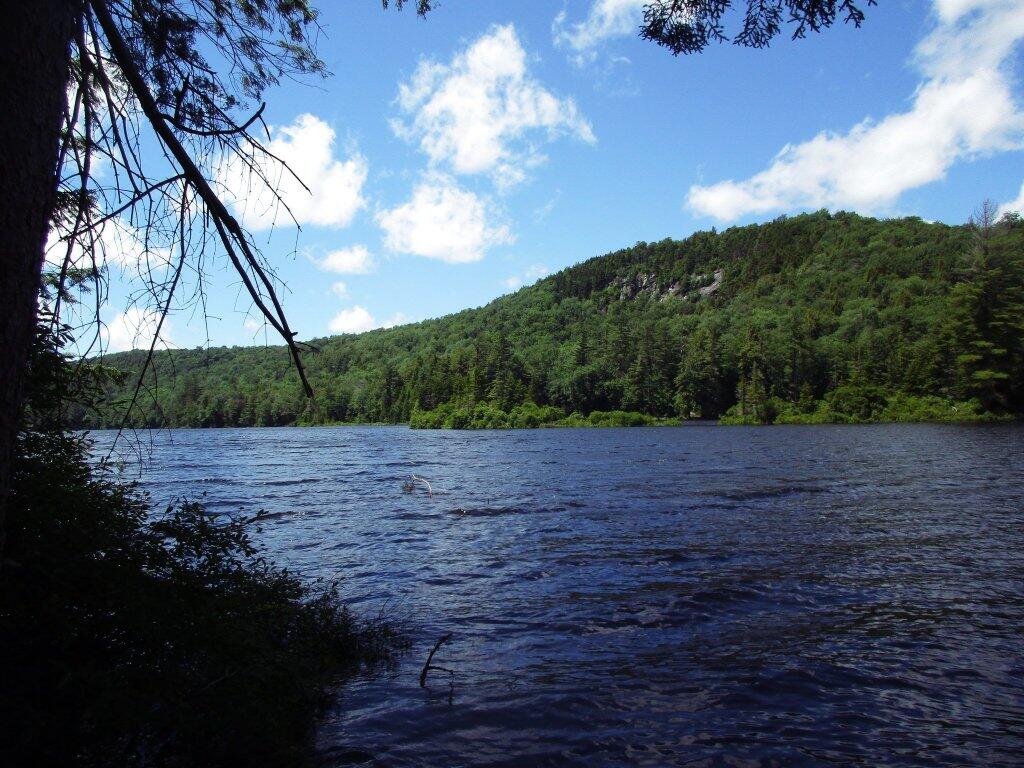
Spring finally comes to Adirondacks by late May. Paddling around Cheney Pond, looking towards Sand Mountain in the distance, on the other side of Hoffman Notch.
June.
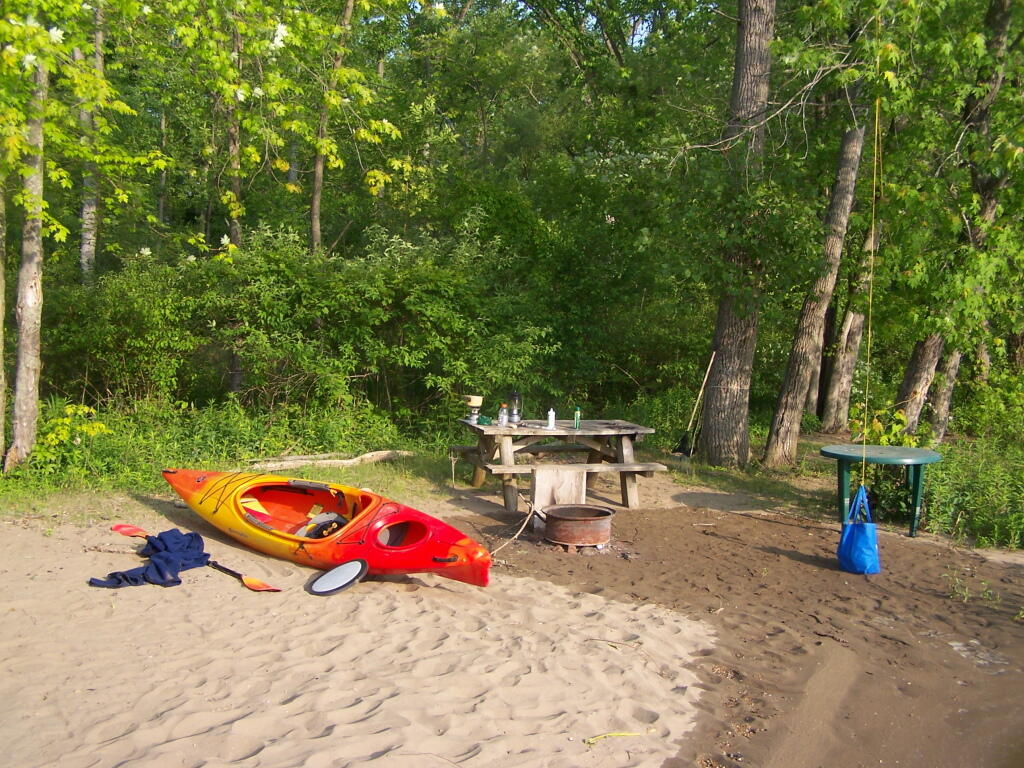
Kayak camping on Stockmans Island in the middle of the Hudson River. What an adventure, one I picked on a night when they had fireworks up at the Coxscake Town Park.
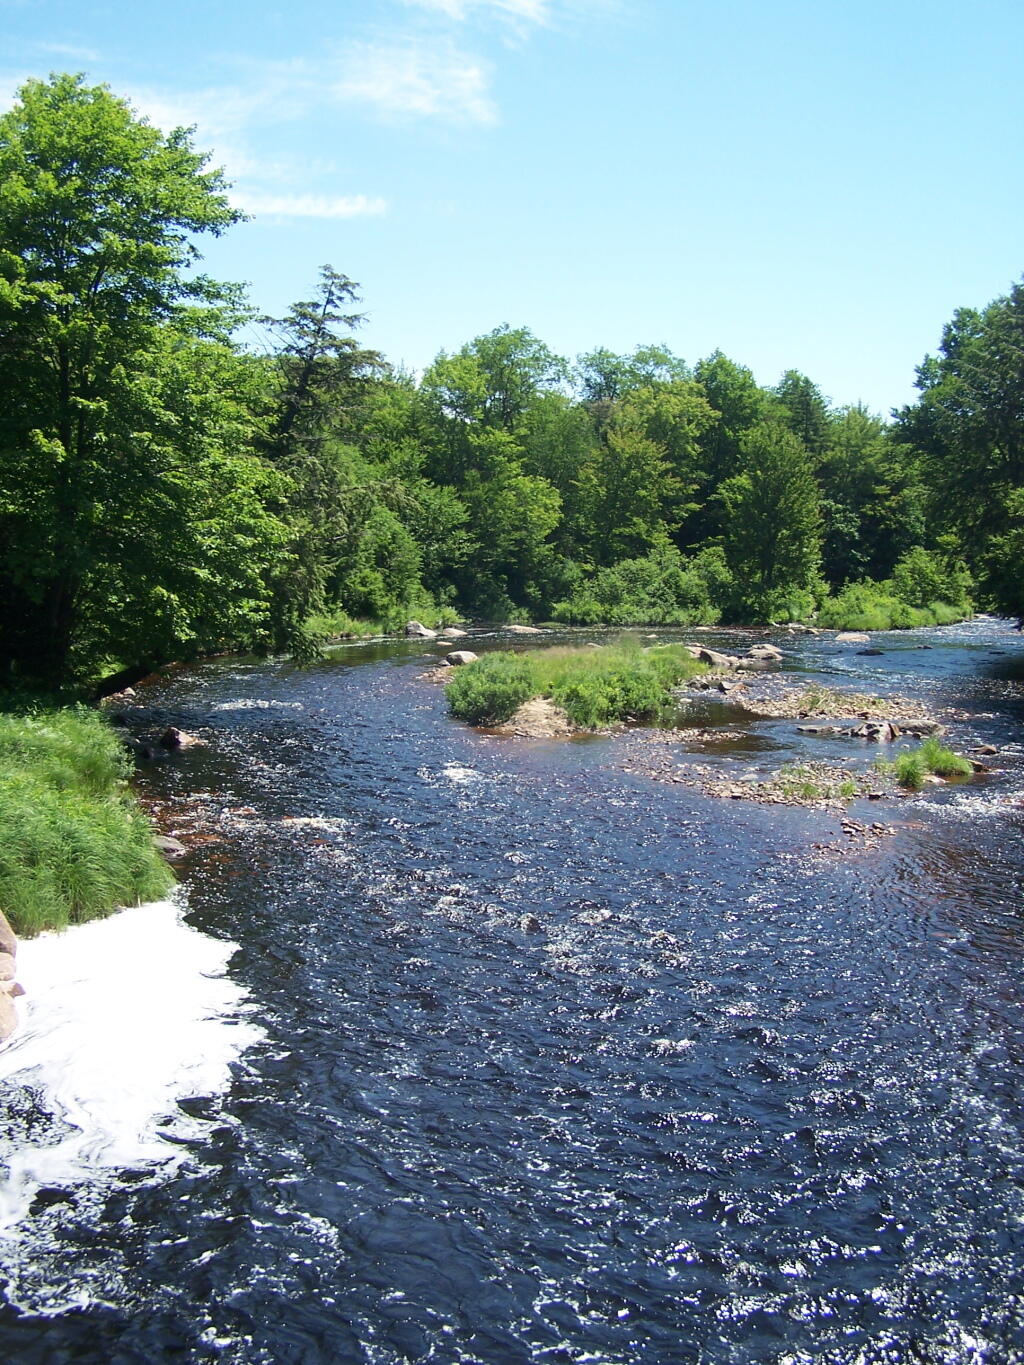
Oswegatchie River up in Watson’s Triangle in Adirondacks. There are few places as remote as this that you can drive on largely unmarked and rarely traversed back country roads. Watson’s Triangle is a place far of the beaten path.
July.
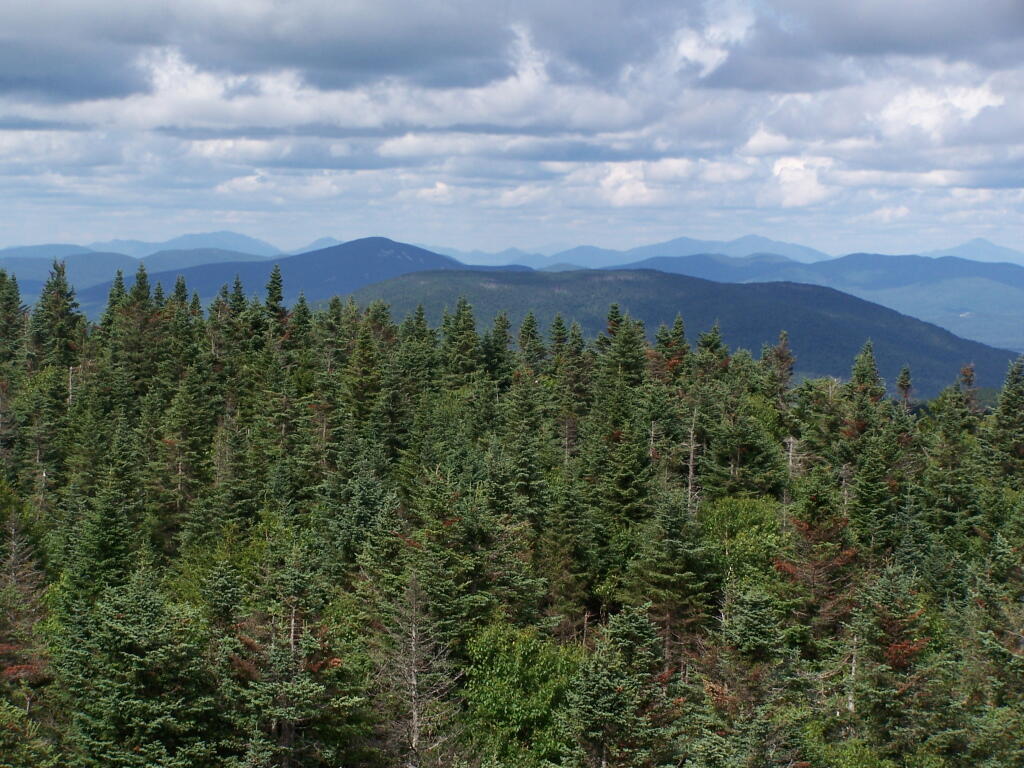
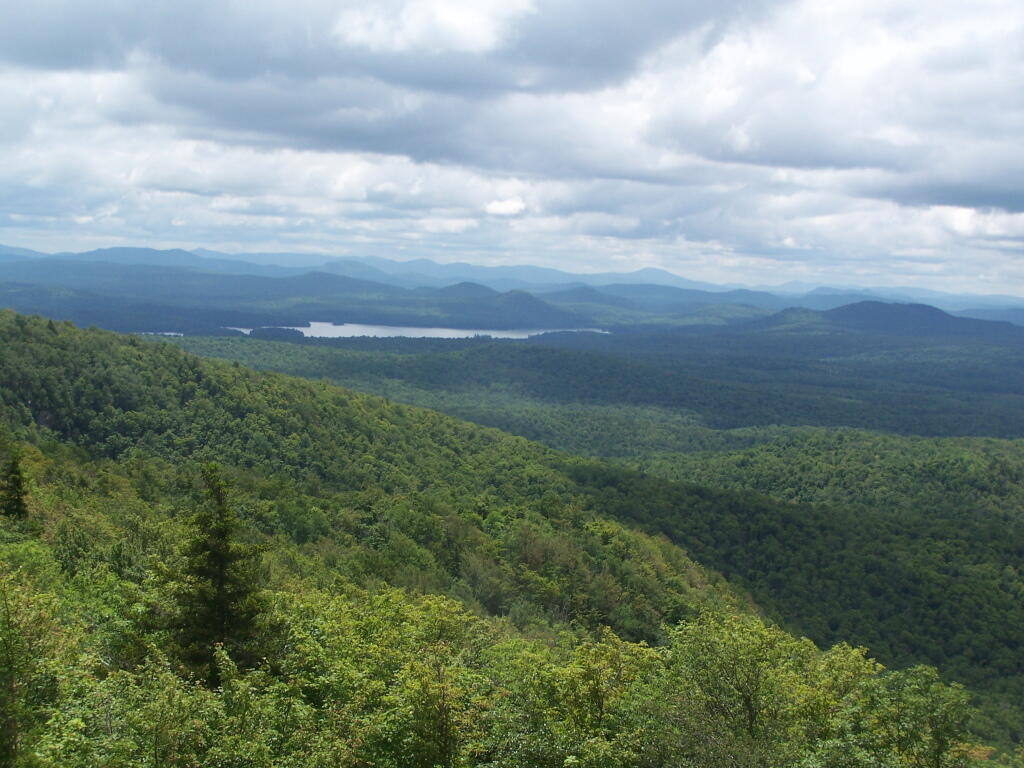
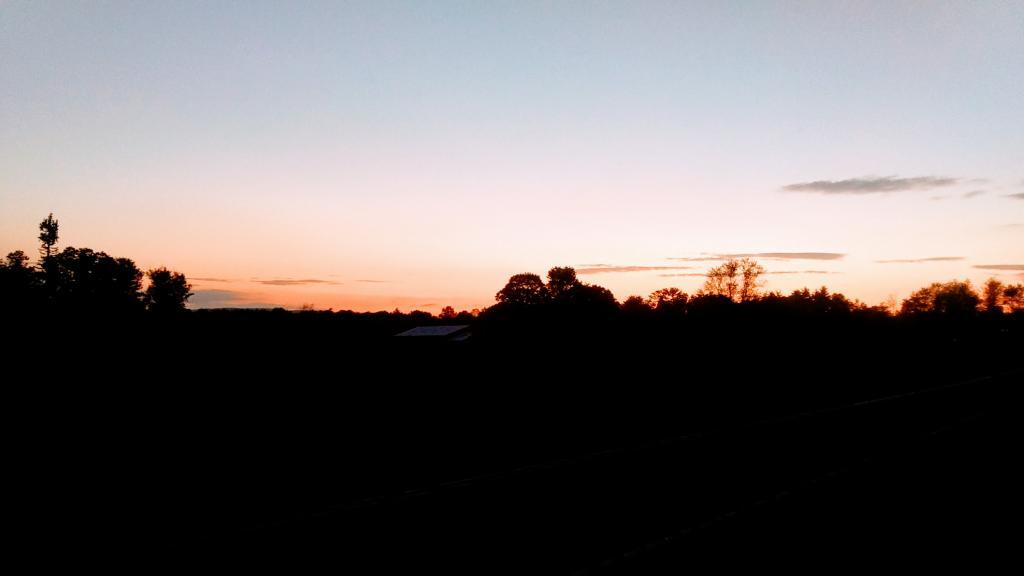
A dramatically cloudy day, looking down towards Tupper Lake from Mount Arab.
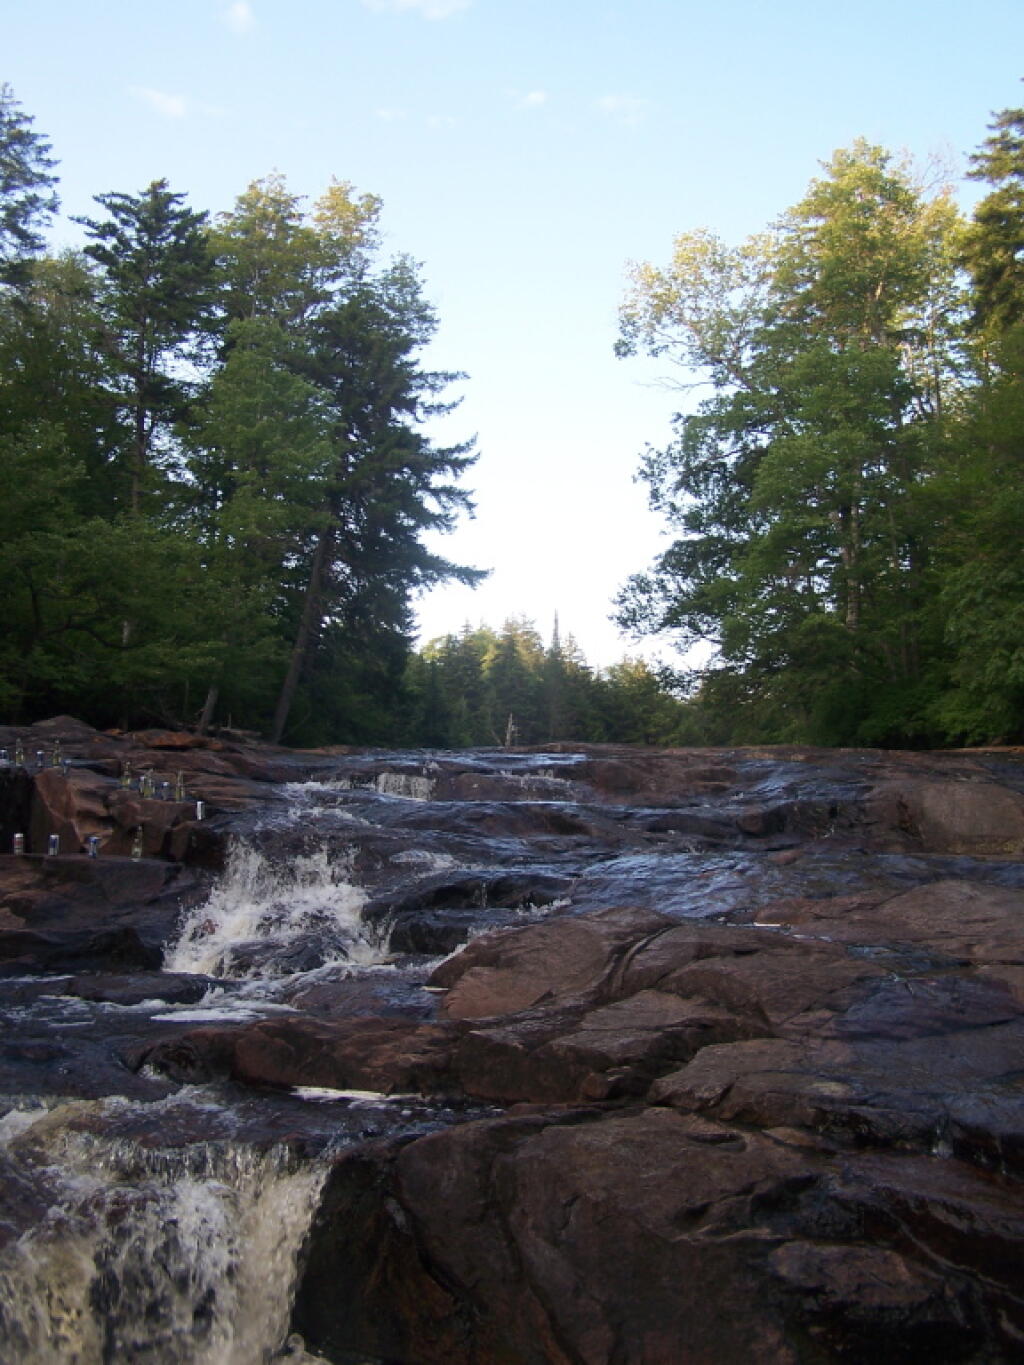
Cooling off at the Potholers on an oppressively humid summer’s day.
August.
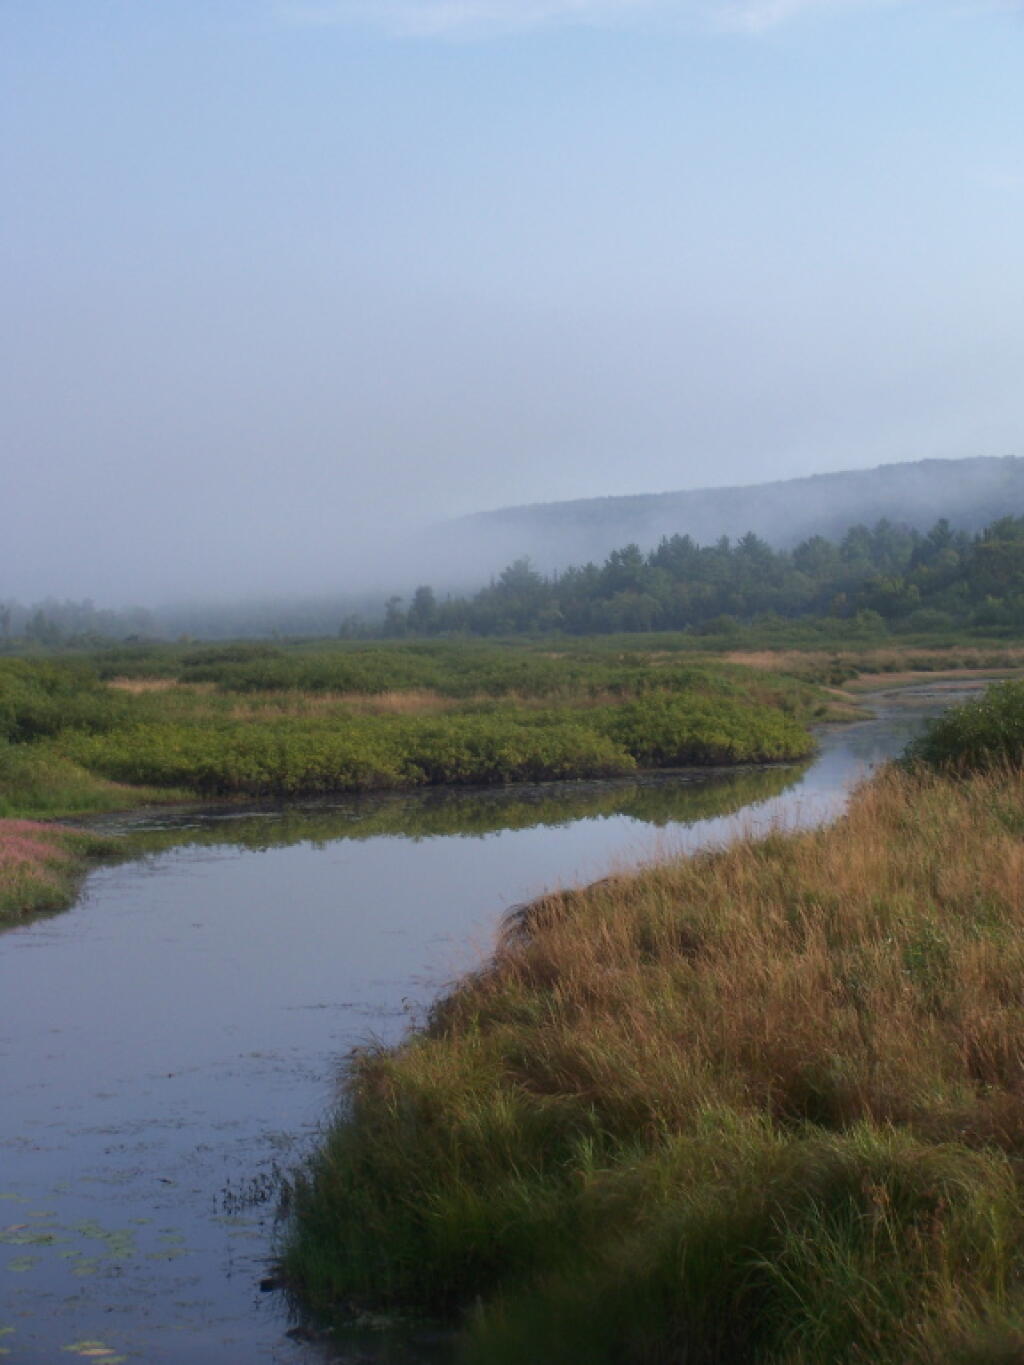
Exploring Beaver Creek at the Brookfield Railroad State Forest in Brookfield, NY.
Watching the fog burn off Beaver Creek at Brookfield Railroad State Forest on a summer morning..
September.
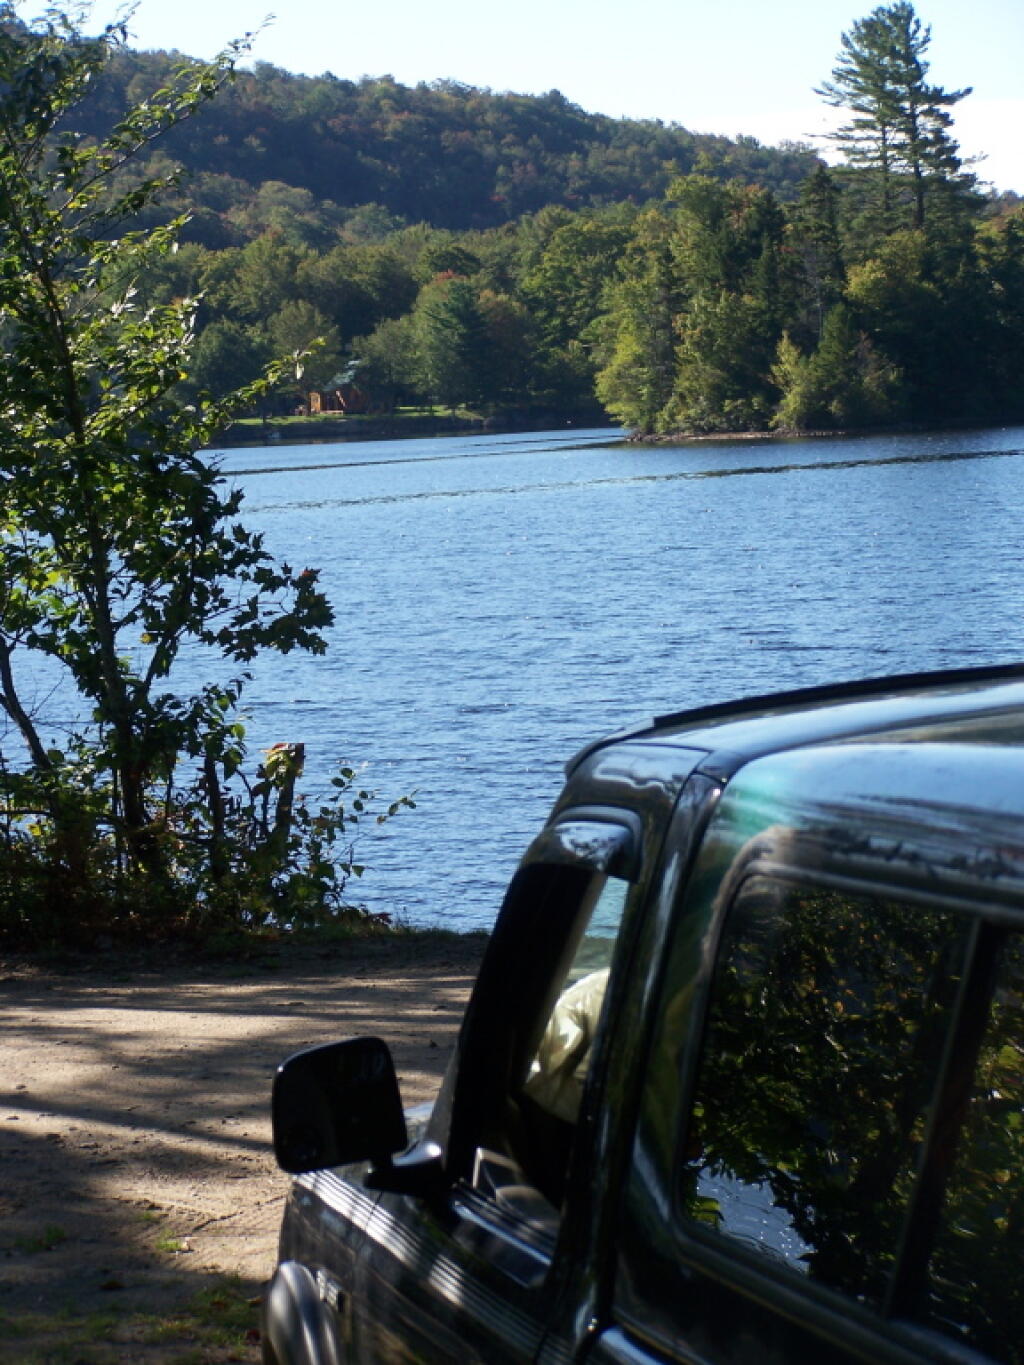
A beautiful late summer morning at North Lake in Adirondacks. North Lake is such a jewel, especially as you head farther north on the largely undeveloped portion of the lake.
Fall was well underway, and even past peak at Moose River Plains by September 20th.
October.
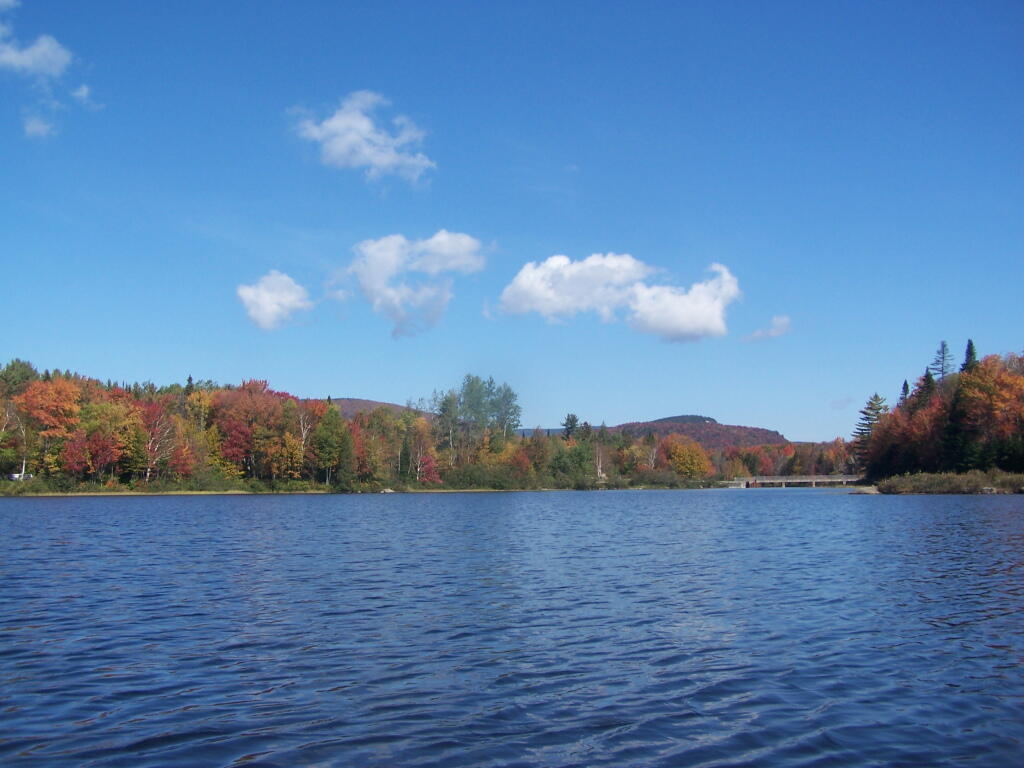
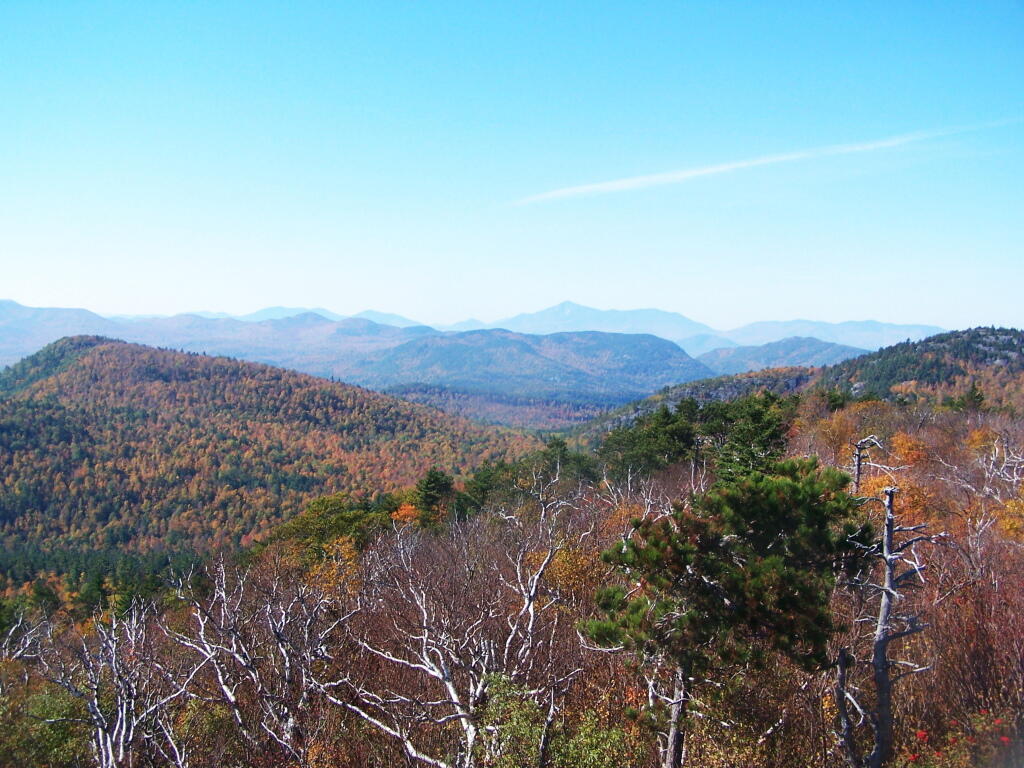
Second week of October, I went up to the North Country for some leaf peeping, hiking, and kayaking. The colors may be faded in Central Adirondacks, but still were good in lower elevation parts of the Northern Adirondacks.
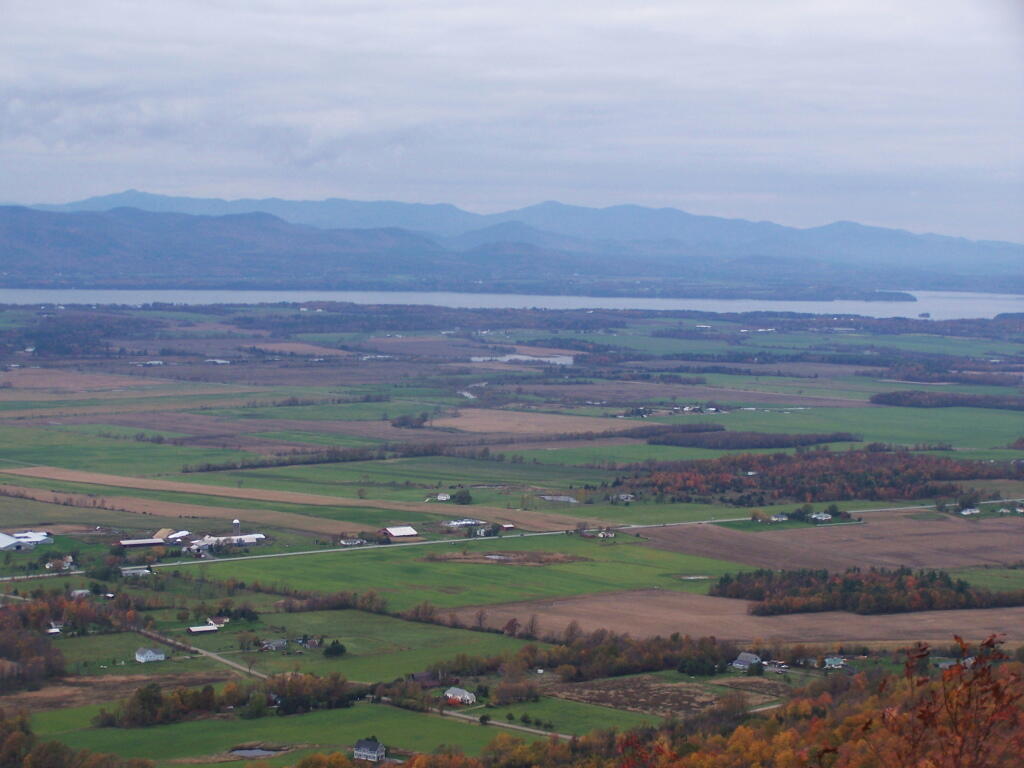
And later in October, I drove up to Snake Mountain in Vermont, overlooking the Champlain Valley and the Adirondacks. Colors lasted the longest
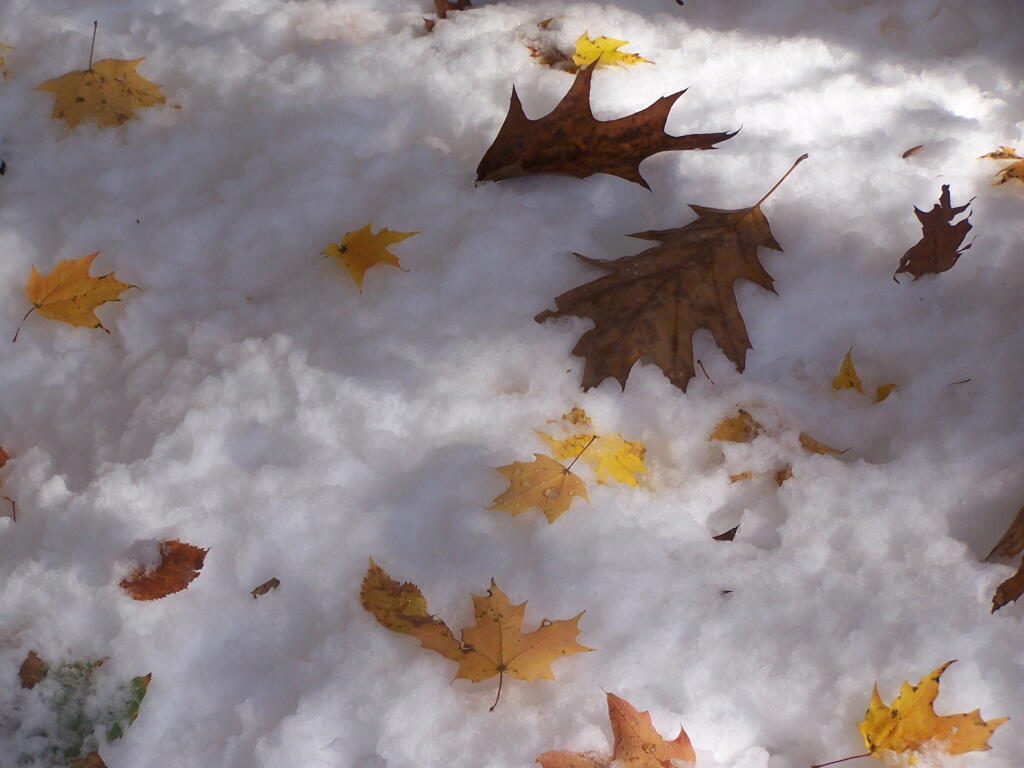
And by October 30th, we had snow, actually several inches, as seen up at Lake Taghkanic State Park.
November.
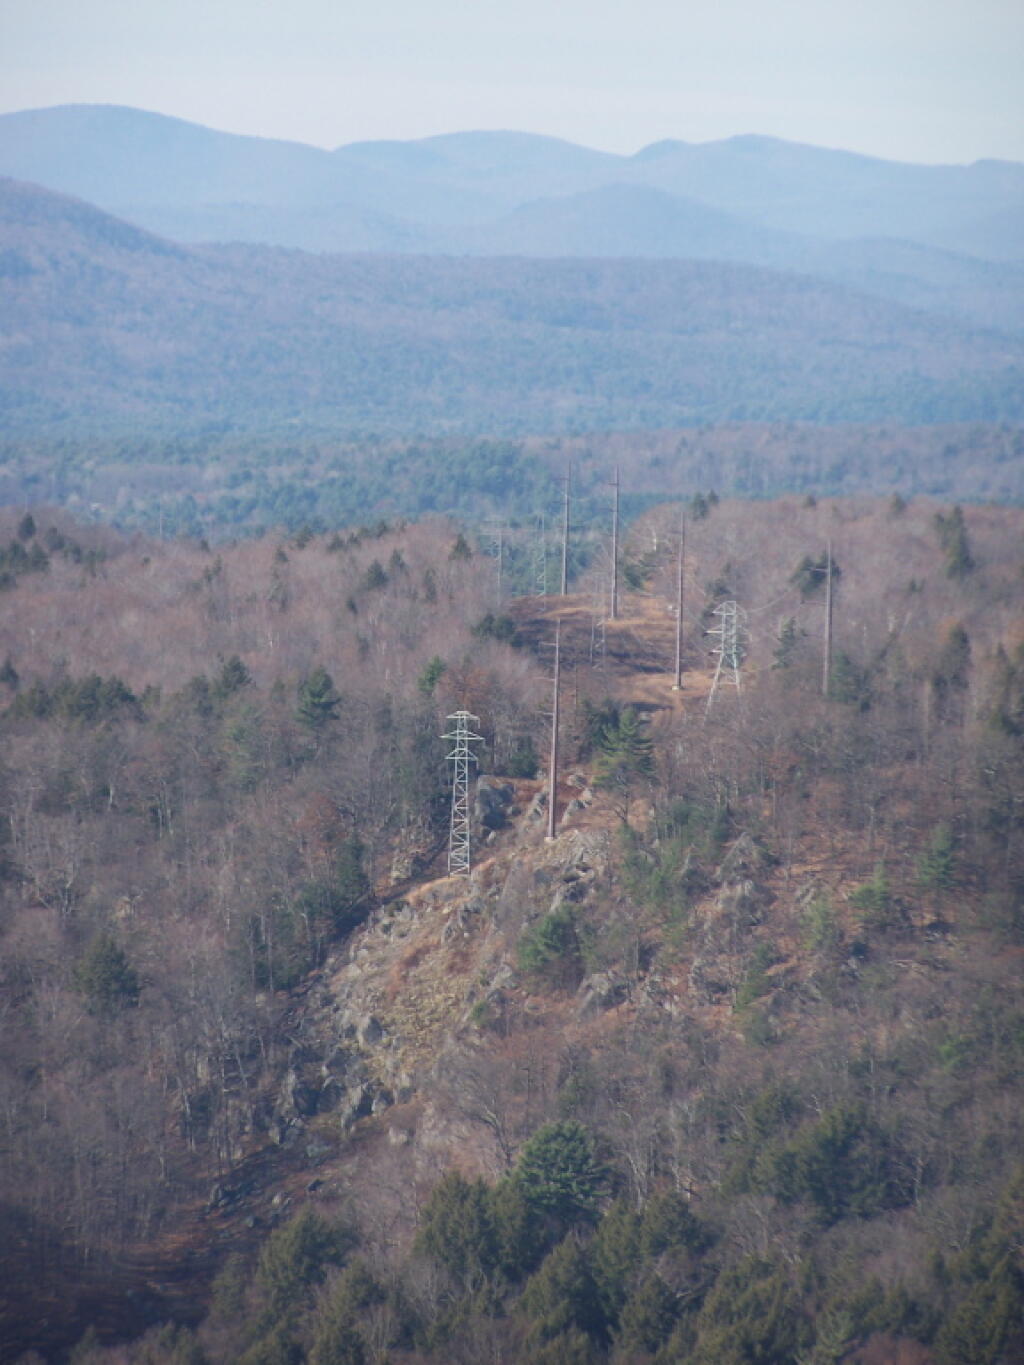
In November I visited Monreau Lake State Park for the first time, and checked out the Palmerstown Ridge above the Hudson River and Spier Falls. These power lines transfer power from Spier Falls Hydro Dam over to Corinth.
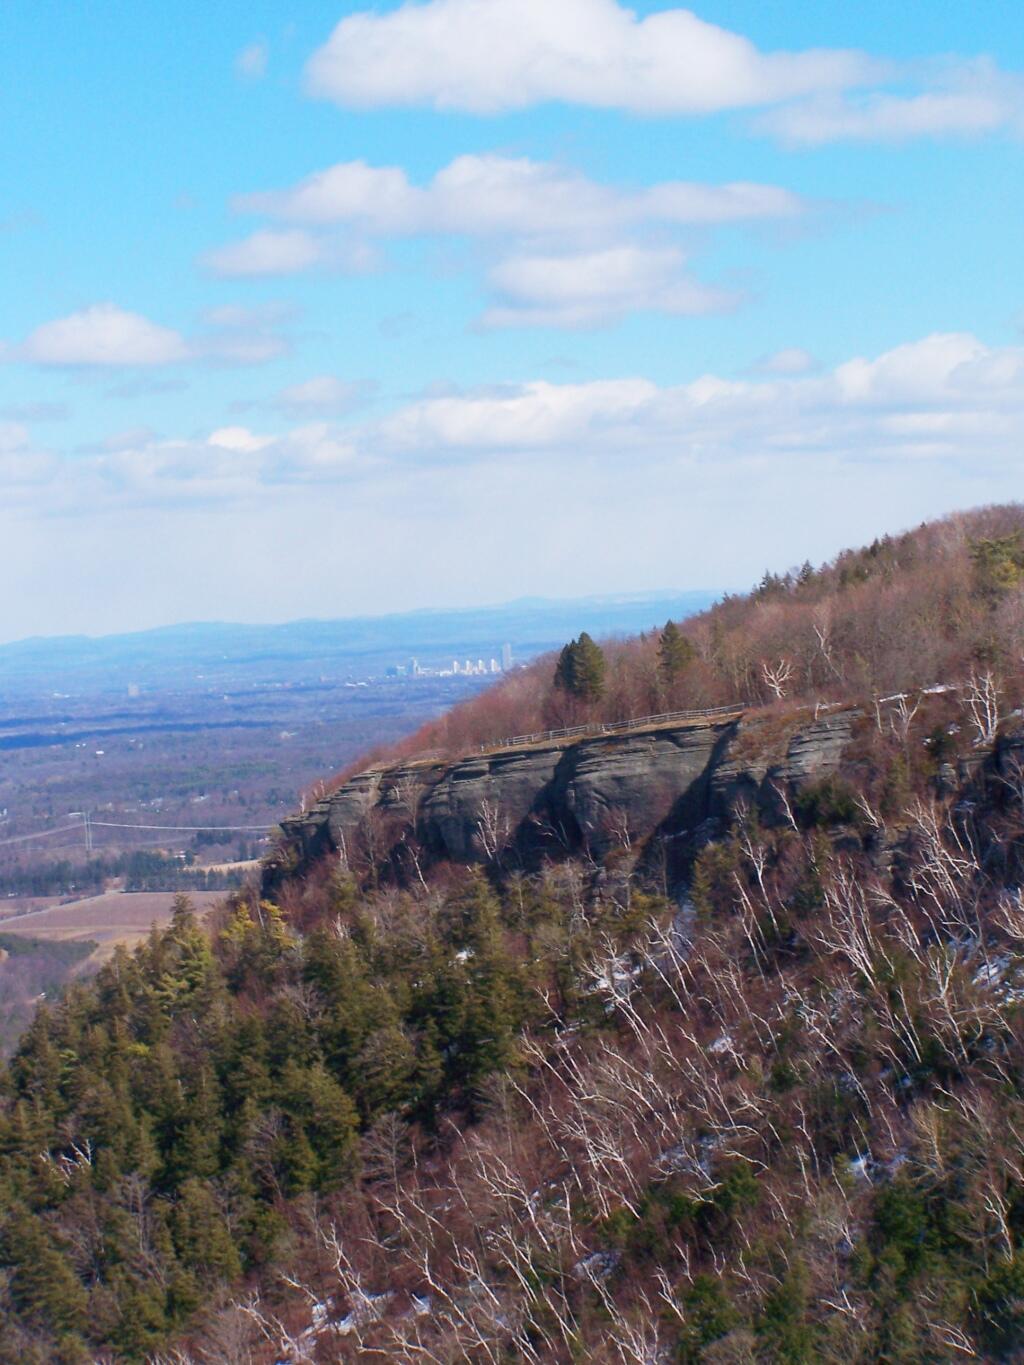
I also hiked up Windham High Peak. I hadn’t been there in many years, and it was interesting to look down at Preston Hollow and Medusa, far, far below.
December.
On Christmas Day, I hiked up Hadley Mountain. While cloudy and cold, it was very beautiful.
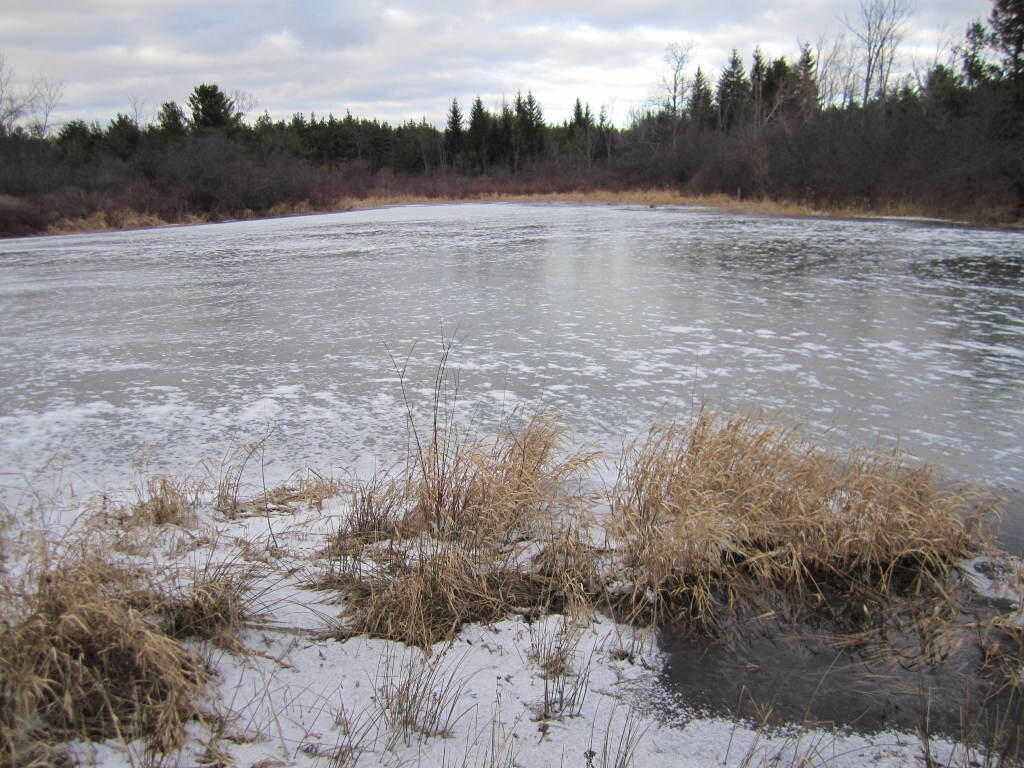
While the pond at Thacher Park was frozen, there still is very little snow locally.
Today will take a look back at Year of 2011 in photos. Next week, I plan on doing an article featuring the Best of Photos of 2011. UNIX_TIMESTAMP(‘2011-1-1’) AND `date` < UNIX_TIMESTAMP('2012-1-1') ORDER BY `date` ASC";
$query = mysql_query("$sql");
while ($series = mysql_fetch_assoc($query) ) {
$date = strtotime($series['dated']);
if ($prevdate != date('F', $date) ) {
echo '
$sql = “SELECT `phototypes`.`filename` AS ‘type’, `photos`.`filename` FROM `photos`,`phototypes` WHERE `photos`.`typeid` = `phototypes`.`id` AND `date` > $min AND `date` < $max AND `phototypes`.`filename` NOT LIKE 'maps%' ORDER BY rand() LIMIT 1";
$pquery = mysql_query("$sql"); $photo = mysql_fetch_assoc($pquery);
echo "
It takes the NY State Department of Labor a long time to produce data on the Unemployment Rate. It usually is not released until the middle of the month proceeding month, so the data for September, was not released until around October 20th. The NYS DOL breaks unemployment data down by county, which is relatively easy to merge with Census TIGER Shapefiles, and produce some nice maps. Which is what I did.
Here is the NY State Unemployment Rate by County.
Notice how Rural Western NY has some of the lowest unemployment in the state, though the rate in Saratoga County, along with NY City suburbs of Putnam, Rockland, and Westchester Counties shows the economy is relatively strong in that portion of state too.
Unemployment tends to peak in the Southern Tier and also in the counties impacted by Hurricane Irene that month, e.g. those of the Catskills and the Central-Leatherstocking Region of state.
Here is the Change in NY State Unemployment Rate from September 2010 to 2011.
Notice how Western NY is creating jobs while the economy is stagnant or losing jobs in the regions impacted by Hurricane Irene. Those Hurricane-related job losses may be temporary, and not reflected in the October numbers, but they do suggest that there is a lot of growth occurring in Western NY, not occurring in the Eastern portion of state.
Also, note the weak economy in the Tug Hill Plateau region between 2010 and 2011. Unemployment has increased in Jefferson and Lewis County during that time period, while remaining stagnant in Oneida County. Definitely not good news in that rural part of state.
I probably will do a new series of maps come the release of the October numbers later in the month.
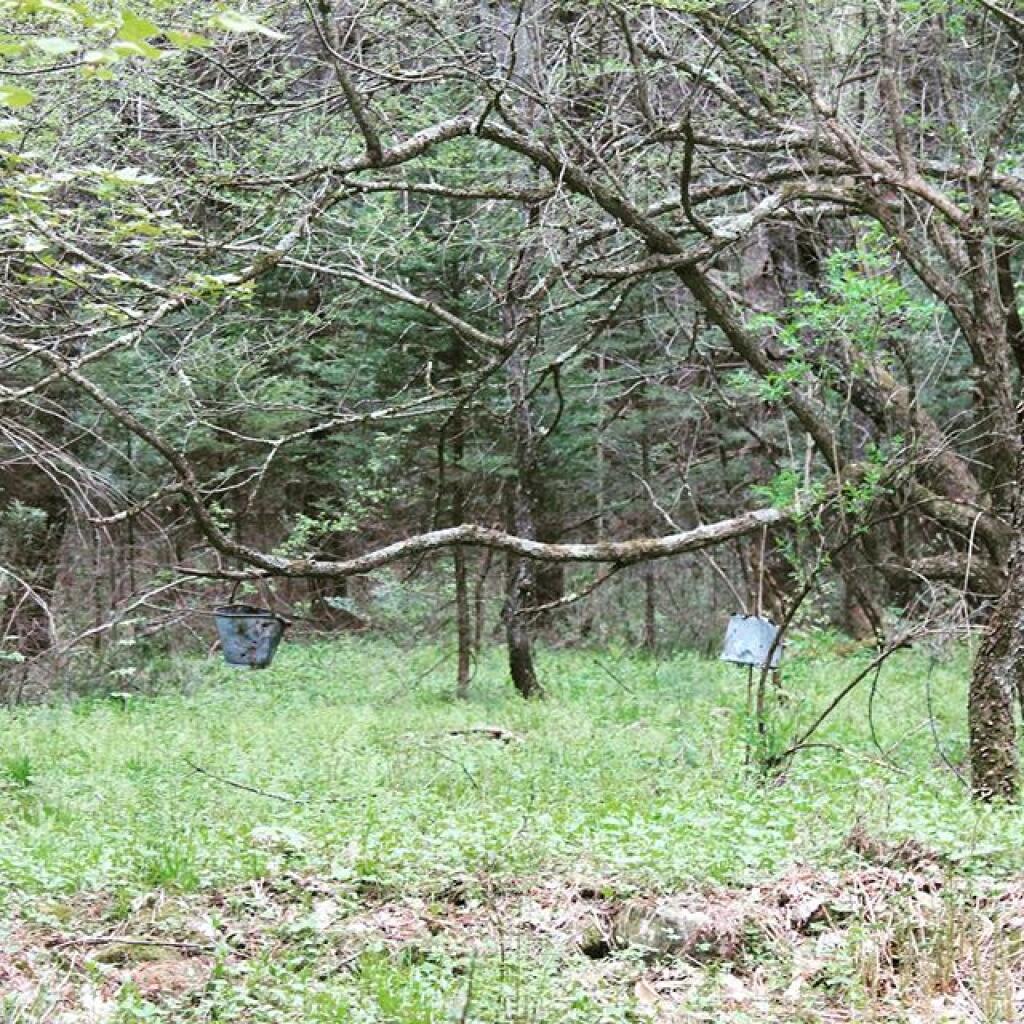
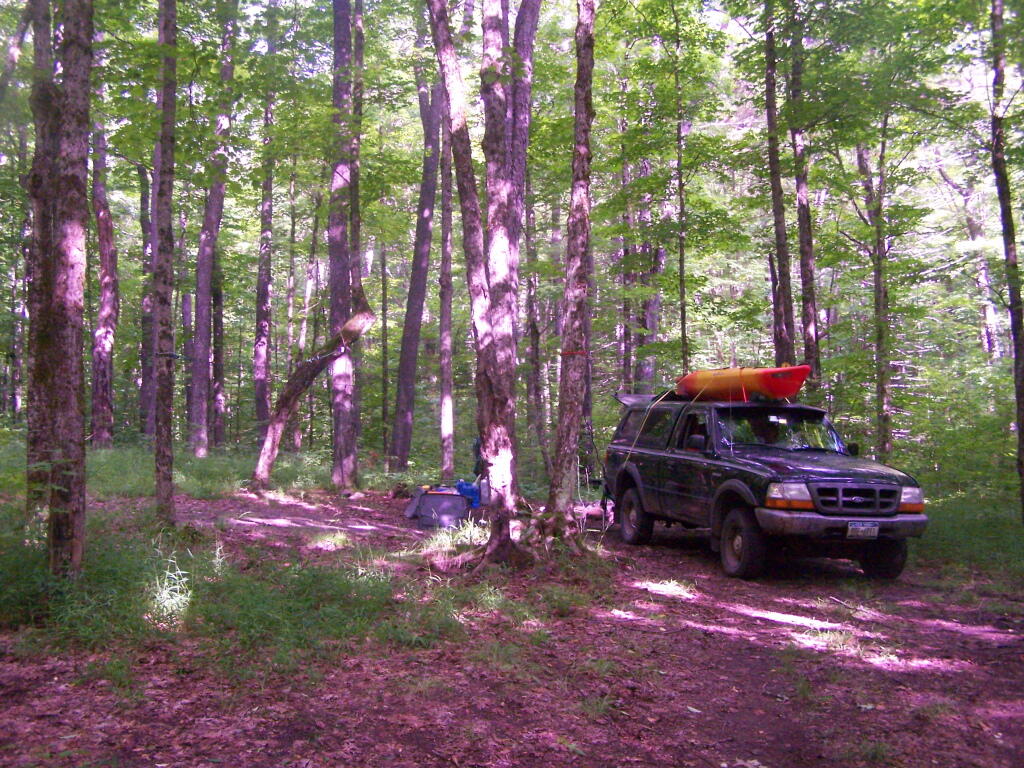
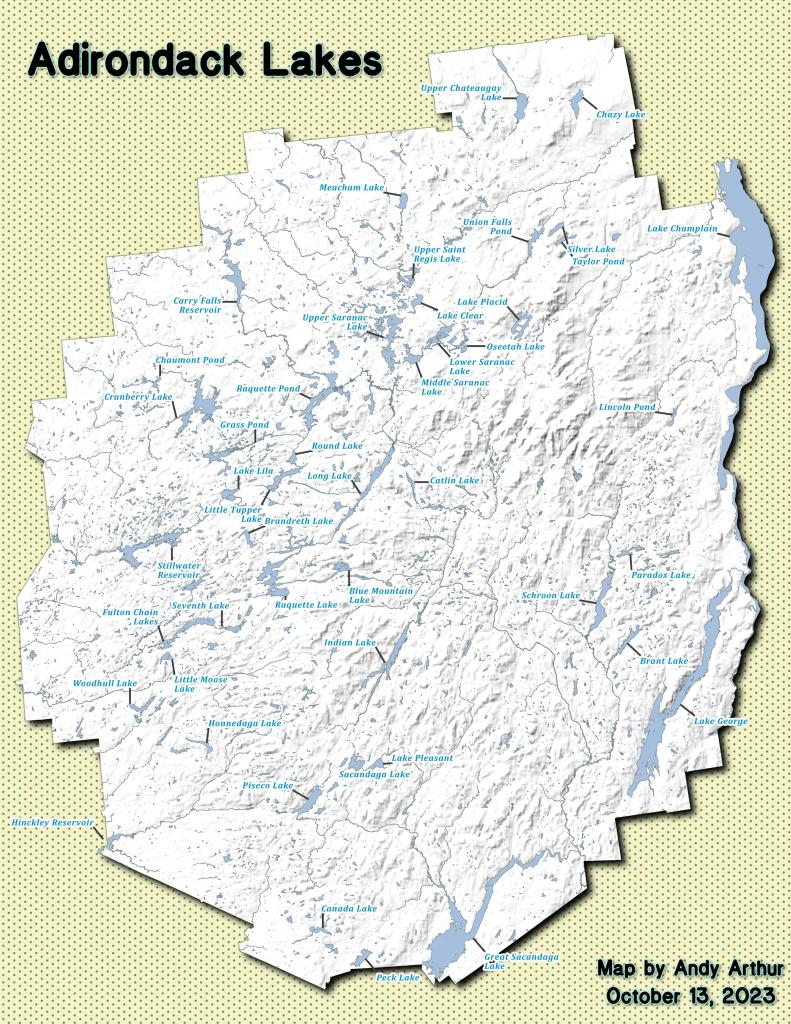
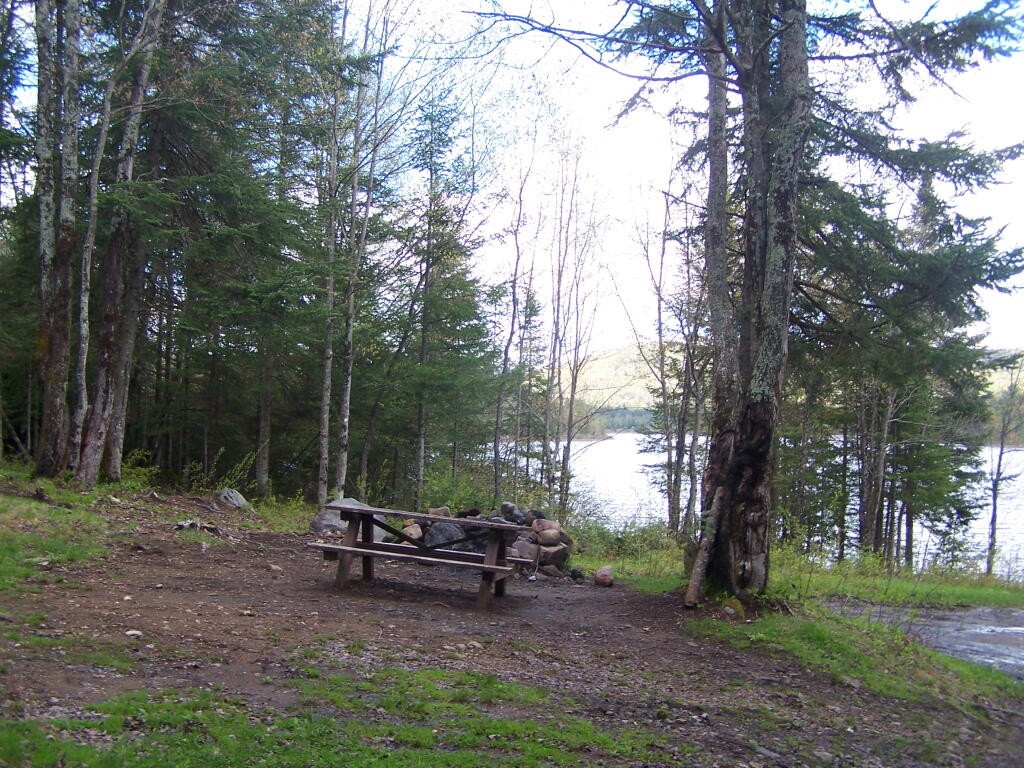
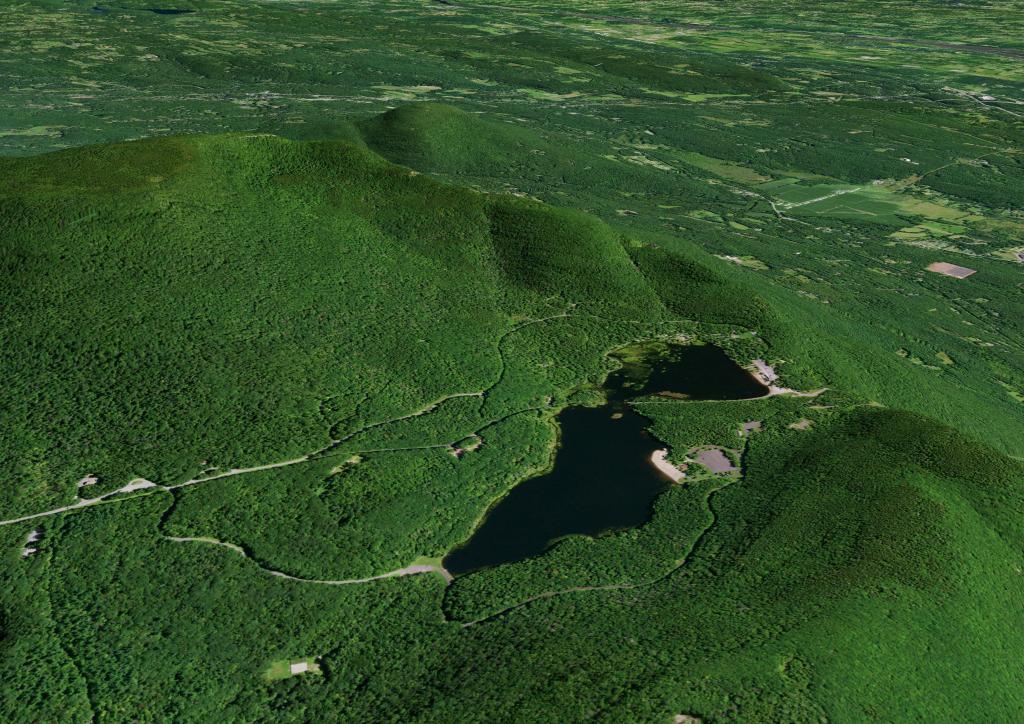
This past year, I got up to nine different Adirondack Wild Forests as part of my explorations of the Adirondack Park. Did a lot of hiking, kayaking, and camping. The map below shows the Adirondack Park’s various units.
I camped in Aldrich Pond (1 night), Black River (4), Debar Mountain (3), Ferris Lake (5), Independence River (2), Moose River Plains (3), Taylor Pond (2), Vandwhacker Mountain (1), and Wilcox Lake (4). My preference for certain Wild Forests over others, is not just based on scenic beauty or activities to do, as much as closeness to Albany and compatability with weekend plans.
I saw quite a bit of Adirondack Park for sure.
Aldrich Pond (1 night)
Camped one night on Streeter Lake Road in Aldrich Pond Wild Forest near the hamlet of Oswagatchie. Paddled part of Little River and Streeter Lake.
Black River (4 nights)
Camped two nights at Wolf Lake Landing Road. Paddled around Woodhull Lake, hiked over to Remsen Falls.
Camped two nights at North Lake. Sat down by the lake, enjoyed the moonlight. Explored Atwell and part of South Lake.
Debar Mountain (3 nights)
I camped for two nights at Mountain Pond near Paul Smiths, NY, while visiting the Saint Regis Canoe Area.
Then coming back from North Country, I decided to spend a night at Jones Pond, which is between Rainbow Lake and Paul Smiths.
Ferris Lake (5 nights)
I did two weekend trips up to Ferris Lake Wild Forest. The first was during Memorial Day Weekend, which was pretty wet and rainy for most of the weekend. The second was during the mid-summer on a super oppressive, hot and humid day out. While I explored Edick Roadside Camping, and also Good Luck Lake, both times I roadside camped on Piseco-Powley Road, three nights at PR 9, one night at PR 4, and one night at 11.
Independence River (2 nights)
Camped two nights at Independence River Wild Forest on Smith Road, at field Campsite 1. There are ten campsites on this road, including one with an outhouse. Several of them are located in old logging load pads, that are now mowed as fields for camping. Nothing particularly fancy here.
Moose River Plains (3 nights)
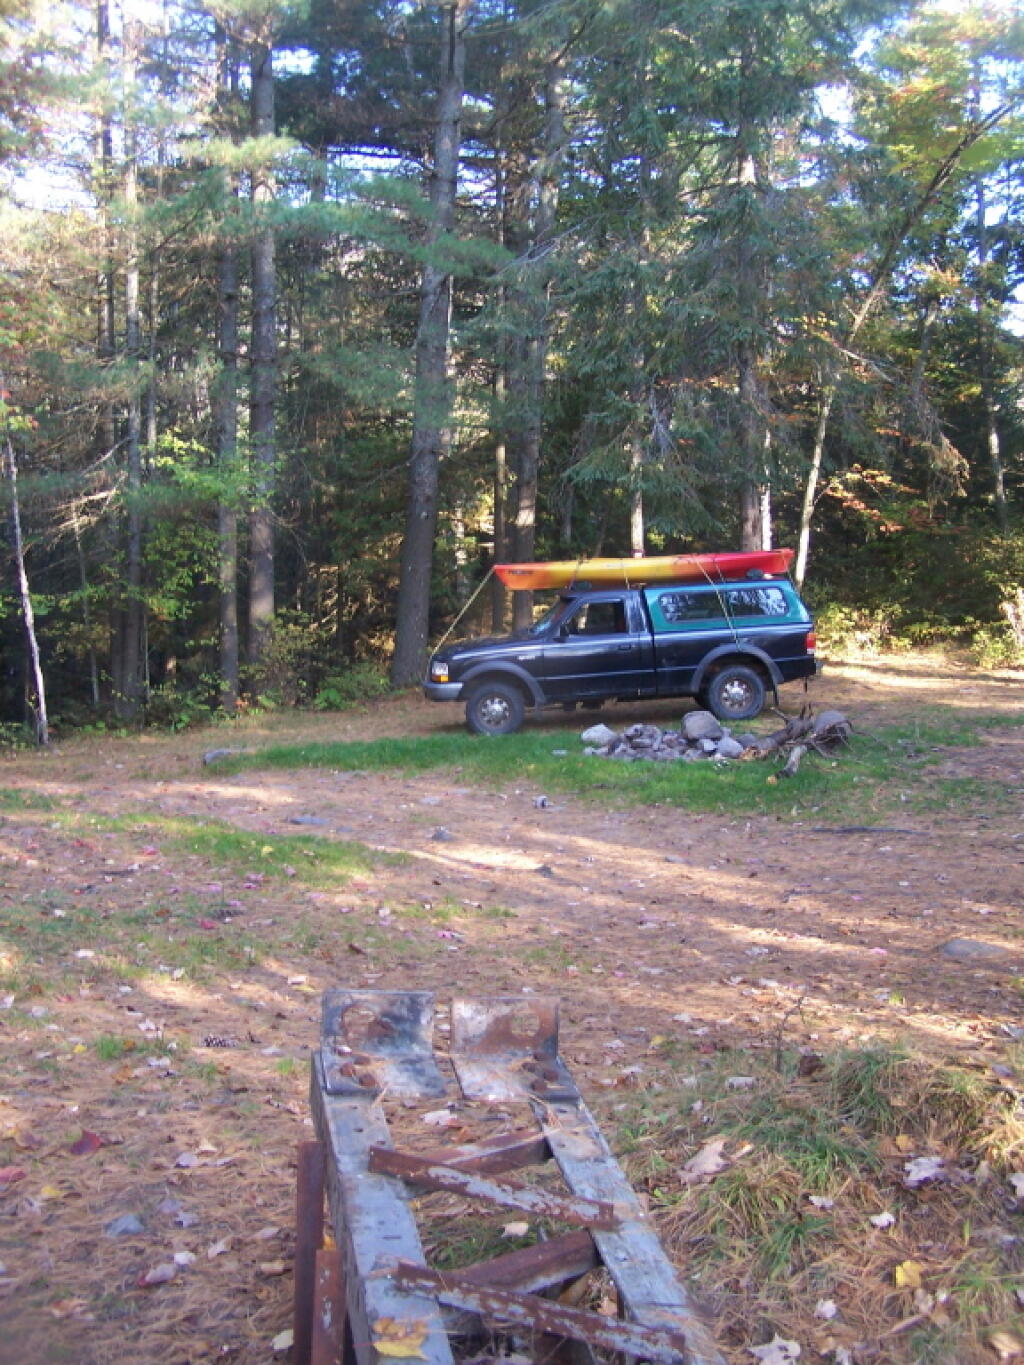
Planned to spend a week at Moose River Plains, brakes failed on third day up there. Still got three days of fall camping in along Cedar River – Limekiln Lake Road. Camped one night at Campsite 24, and two at Campsite 57 this year.
Taylor Pond (2 nights)
Camped up at Union Falls for two nights in the fall, while hiking and exploring several locations in Clinton County and eastern portion of the North Country.
Vandwhacker Mountain (1 nights)
Camped one night at Cheney Pond at the Vanderwhacker Wild Forest.
Wilcox Lake (4 nights)
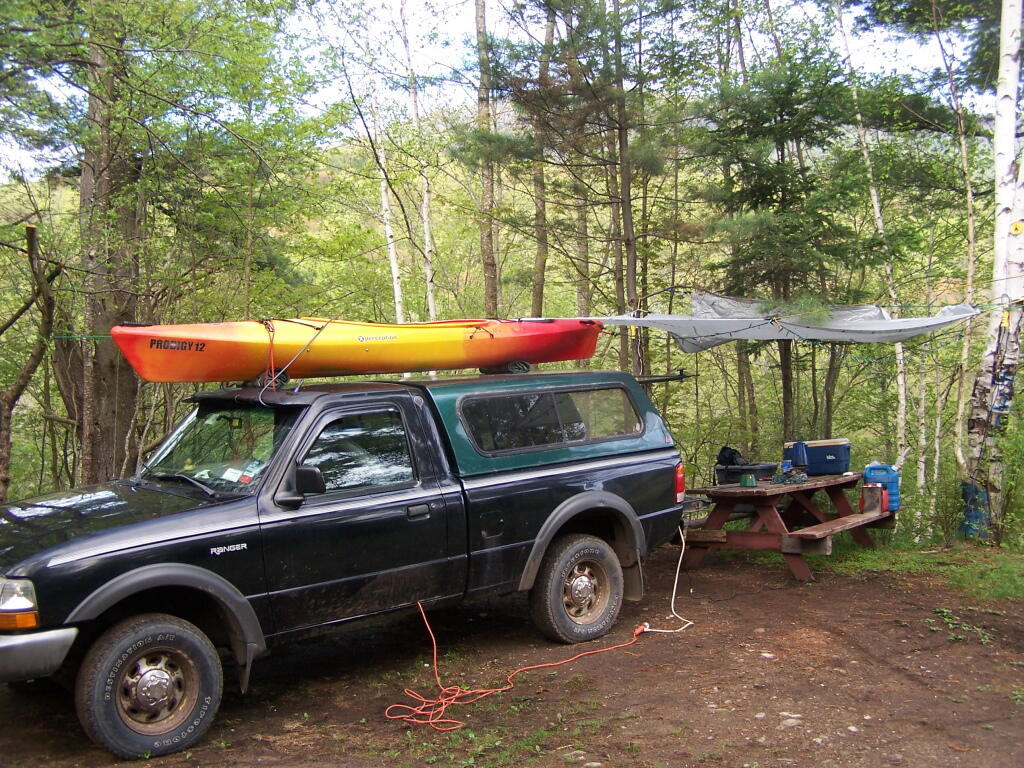
Camped three nights up off of NY 8 — one at an old Gravel Pit along the East Sacandaga River in April when the snow was still there, two nights at Fox Lair Campsite, and one night at Hope Falls Road, which is off of NY 30, near Northville.
No current legislative district in Albany County recieved less then 50% a 2010 Average Democrats Performance. That said, with swing and other factors (e.g. candidate quality, local issues), certain Democrats are expected to lose races that a Generic Democrat could have won in the same location.
…However, In Many of Those Districts, Swing Is Very High.
In the suburban districts, while many may have gone strongly for Governor Cuomo, many chose to vote for Republicans for State Assembly or State Senate. This suggests things may not be as rosy from Democrats in the County as the Average Democratic Performance makes it seem.
Here is a list of safe districts, marginals, along with the swing and average ADP for Voting Tabulation Districts in each Legislative District.
The 2010 Average Democratic Performance (ADP) is based on US Senate, US Congress, Governor’s Race, State Senate, State Assembly, State Comptroller and State Attorney General Races, broken down by voting tabulation district, then all Democrats added together and divided by the total number of Democratic and Republican votes. Swing is a caculation of Maximum Statewide Democratic Candidate Preformance, subtracted by Minimum Statewide Republican Candidate Preformance.
Election Districts have changed in Albany County since the redistricting by the County Legislature. The data used to compute Average Democratic Preformance is based on Census Standard Voting Tabulation Districts, which have in many cases changed with redistricting. The largest geographic portion of the Census Standard Voting District was counted in the legislative district it exists in.
I computed safe seats as those with a 2010 ADP – 2010 Swing greater then 50%. Marginal districts, are those where Democrats recieved a less then 55% ADP. Normally one would use less then 50% to define marginal, however Andrew Cuomo polled so highly in many districts that he distored the statistics used. The lowest 2010 ADP Standard Voting Tabulation district in all of Albany County was only 43% ADP, which is remarkably high for anywheres in Upstate NY that is not highly urbanized.