- Different parties represent different segments of the population — differences in region, population density, gender, race, occupation
- Increases compromise on legislation, ensuring a variety of viewpoints are represented in final law.
- Stops or at least modifies bad laws that would screw one segment of the population to appease another segment of population’s ideological beliefs.
- Increases constitutional protections by allowing one party to raise constitutional questions related to their ideological beliefs.
- Allows one party to investigate the other party, increasing honesty in government.
NPR
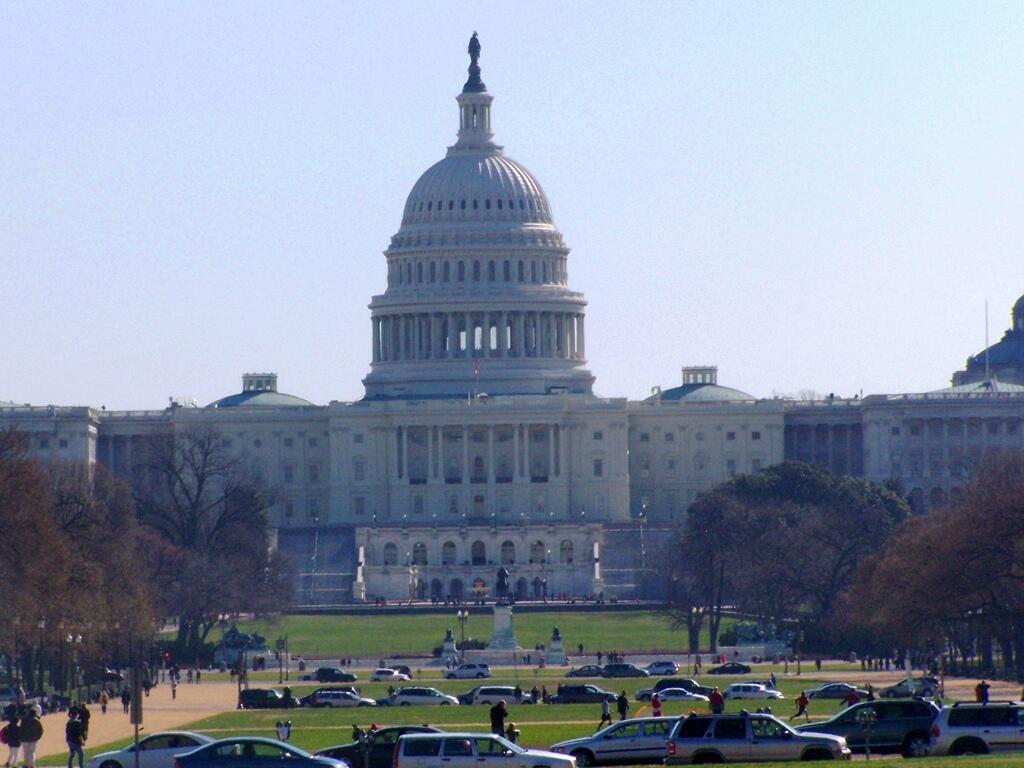
The Virginia General Assembly unanimously elected Democrat Don Scott as house speaker on Wednesday, making him the first Black speaker in the Virginia House of Delegates' history.
Del. Scott approached the podium to cheers and a standing ovation as he took the oath of office and began his term as the leader of the House.
Americans’ Approval Of Congress Near Historic Low
I really like my congressman, Paul Tonko. He's really great. The problem is the other 434 Congresspersons who do not represent me or my views.
The Notable Decline in Congressional Represenation
NY State had 45 Congressional Districts as of 1950. It dropped to 36 by 1980, and by 2010 was only 27 districts …
That means in NY State has 40% less representation in Congress then we had in 1950.
In 1950, New York had 14.8 million residents. It was the most populous state in 1950. By 2010 that number had grown to 19.3 million.
However in the mean-time, California grew to 37.3 million people from 10.6 million in 1950, Texas to 25.2 million from 9.8 million in 1950.
Does the US Senate or US House Represent Rural Folks More?
That’s an interesting thought. The United States Senate has two senators for each state, while the US House is propotionally represented. While an urban state like New York State recieves 29 representives, we only get two senators, a rural state like Vermont recieves only 1 representive and 2 senators.
In theory, that would mean a rural state like Vermont, Wyoming, North Dakota, or even Iowa would have have a disproptionate impact on the legislation through the US Senate. While it’s true that such states have more of a voice in the US Senate, it’s not clear rural residents get more representation in the US Senate.
Why not? For one thing, US Senate districts are larger. Much larger, typically covering whole states. The problem is that by representing complete states, every senator represents both urban and rural areas, and in most states, urban populations outnumber rural portions of states.
If any thing, urban consituencies have more power in the US Senate then the US House. There are representives in US House Districts that are predominately rural, in contrast to even rural states, where population is dominated by urban centers — such as Burlington, Vermont.
How To Make Maps from Redistricting Block Lists
When a city council, county legislature, or state legislature redistricts itself to reflect changing population, they usually release data in two formats:
- Census Block Equivalency – A list of census blocks in each district, generated by the commerical GIS program (such as Mapitude) used for redistricting.
- Metes and Bounds – A legal description of each district, used in resolving court disputes over district boundaries, and assisting board of elections on where to put voters whose property might be crossed by a Census block
If you planning on making a map, Metes and Bounds won’t be particularly useful. Computers don’t understand english very well, they need numbers and lists. In contrast, the Census Block Equivalency is very useful for mapping things.
Every year, the Census Bureau puts out series of ERSI Shapefiles known as TIGER/Line. You can download TIGER/Line for any state and county in the United States from their website. They provide many different shapefiles and layers such as a Highway, Faces, Edges, and County Subdivision layers, however the one you will be most interested for making district maps is the Tabulation Block (tabblock) layer.
You can use these files in the free program known as Quantum GIS or QGIS. While this tutorial will not explain the ins and outs of QGIS, this should get you started on making redistricting maps.
The Tabulation Block Layer is the file containing all of the Census Blocks for a particular county. A Census Block is the smallest unit of population gathered by Census Block, and consists of all bordering features (bounds) — roads, rivers, shorelines, along with all imaginary lines (metes) — town lines, village lines, other lines drawn for statisitical purposes.
Each Census Block has a number, that is a subdivision of the Census Block, County ID, and State ID that it resides within. For example, the Governor’s Mansion in Albany is located in Census Block 2000 in Census Track 23.00 (zero padded to 002300) in Albany County (Federal Information Processing Standard — FIPS ID: 01) which is in NY State (FIPS ID: 36). County subdivisions are not applied to Census Tract Numbers, as they may in some cases cross county subdivisions, as is the case of smaller districts.
You put those numbers together to get the GEOID — which is the key used for redistricting block lists and most other block-level census data. The Governor’s Mansion is located at a block with a GEOID 360010023002000.
| 36 | 001 | 002300 | 2000 |
| State ID | County ID | Zero Padded Census Tract Number | Census Block Number |
|---|
The block list you get from a redistricting commission typically is in Database Exchange Format (.DBF) or Comma Deliminated Format (.CSV) which are both openable by common spreadsheet applications like Microsoft Excel or OpenOffice Spreadsheet and GIS programs like ArcGIS or Quantum GIS.
This is taken from the LATFOR State Senate Proposed Districts (January 2012) DBF file. It shows you that the Governor resides in Proposed Senate District 44. Across the river in Census Block 4010, Census Tract 524.03, in Rensselear County (FIPS ID 83), NY State (FIPS ID: 36) is located in Proposed Senate District 43.
| 360010023002000 | SD44 |
| 360010021002008 | SD44 |
| 360010021002004 | SD44 |
| 360010021002001 | SD44 |
| 360830524034017 | SD43 |
| 360830524034010 | SD43 |
Download the TIGER/line “Tabulation Block” Shpaefile file for the district you are interested in. You will want the 2010 version. You can download a state-wide tabulation block file, however that is not recommended as the next step will be impossibly slow on most computers. You may also want to open the .CSV or .DBF file in your spreadsheet program and cut out the county you want to speed things up.

You will then want to open up the file in Quantum GIS. You will get a nice map of the county you downloaded, showing all of the Census Blocks.

- From there, go to the Vector -> Join Attributes submenu.
- Make sure that the Target vector layer matches the Tabulation Block Shapefile you wish to join against, then set Target join field to GEOID10 .
- Select click Join dbf table and select the DBF or CSV file you wish to join.
- Change the Join field to BLOCK or whatever the GEOID is titled in your redistricting block file.
- Enter in a location to save the Output Shapefile
- Click okay.
Then wait. A typical county will take 10-40 minutes to join on my 5 year old laptop; your computer may be quicker. If you have a dual processor machine, go on to doing other work in other programs. You will end up with a map that looks like this (stylized for your enjoyment). Each block will be assigned a Senate District (in this example).

Halfway there. Now you need to “dissolve” each Census Block into it’s larger political district. Go to Vector -> Geoprocessing Tools -> Dissolve . Set the Input vector layer to the file you previously joined. Then set the Dissolve field to the field containing the district number — such as DISTRICTID or whatever it is named. Enter a name to safe the file. Click Dissolve.

Outputed will be a Shapefile containing all the political districts in the county you joined and dissolved. This will take 5-20 minutes on my laptop. Other data may exist in that file, such as Census Block number, however at this point that data will be invalid, as only the district number is accurately preserved in such a join. All other data will be picked at random, so delete those columns.

I hope this is helpful. If you just want the Proposed State Senate or State Assembly Districts you can download them from Center for Urban Research. These are the same data, joined using the above process by somebody with a much faster computer. I have also made up a Shapefile containing the Albany County Legislative Districts using this process.
Do State Political Districts Group Together Rural, Suburban, Urban Communities?
I have always disliked political districts that leave constituencies with elected officials that do not represent their views. In many cases, political views can not be categorized as being partisan, but more representative of where a person lives, and the lifestyle choices of living in a certain area. A rural Democrat or suburban Democrat will have distinctively different views then a urban Democrat, especially if he or she wants to be reelected.
I remember writing to my State Senator years ago, and he expressed a viewpoint totally contrary to my own, and most of my neighbors,primarily because he represented an urban area, plus a fringe of other lands cut up in rural hinder lands. Ironically, the way his district was cut up, he had almost no suburban areas, so the only people with a voice or a vote, where the urban folk, with rural folks in his district having no vote.
The needs and wants of a rural resident are distinctively different then that of a suburban or rural resident. So I wondered how many other people in NY State are stuck either living in a city,but with a politician primarily representing rural areas, in a suburb with politician representing mostly city folk, or a city folk with a rural politician.
I the current 2010 Census town-wide population density data, and combined it with 2002 State Legislative districts…
Some districts are pretty consistent, and others are pretty wild,and gerrymandered to pick up Democratic or Republican seats, with no attempt to try to group similar constituencies, or keep rural,suburban, and urban areas together. Even worst are districts that merge slices Then again, when the game is maximize as many seats for your particular political party, it’s not surprising to see such games played, at the cost of representative government.
