The two longest back country roads in Adirondacks — Cedar River-Limekiln Lake Road and Piseco-Powley Road — are generally closed during mud season. Other dirt roads like Moose Club Way tend to be muddy, and their is a risk you’ll get stuck back there.
It’s always a good idea to bring extra weight in your truck bed, a come-a-long or whinch, and snow shovel. You might not be far from a blacktop road at these campsites, but that is no guarantee you won’t get stuck.
1) NY Route 8 / East Branch of Sacandaga River
The campsites are all off NY 8, an all season plowed and maintained asphalt road. Some sites are reinforced with gravel. Be aware some sites may be plowed full of snow from the winter clearing of NY 8. Roughly 15 campsites along this road, however some may be too muddy for this time of year.
2) South of Arietta Town Line on Piseco-Powley Road
There are 7 campsites along Piseco-Powley Road, north of Stratford, prior to the Arietta Town Line gate, which is near the Potholers on East Canada Creek. This road is well packed dirt, reinforced with gravel up to gate, and should be accessiable year round, minus the snow.
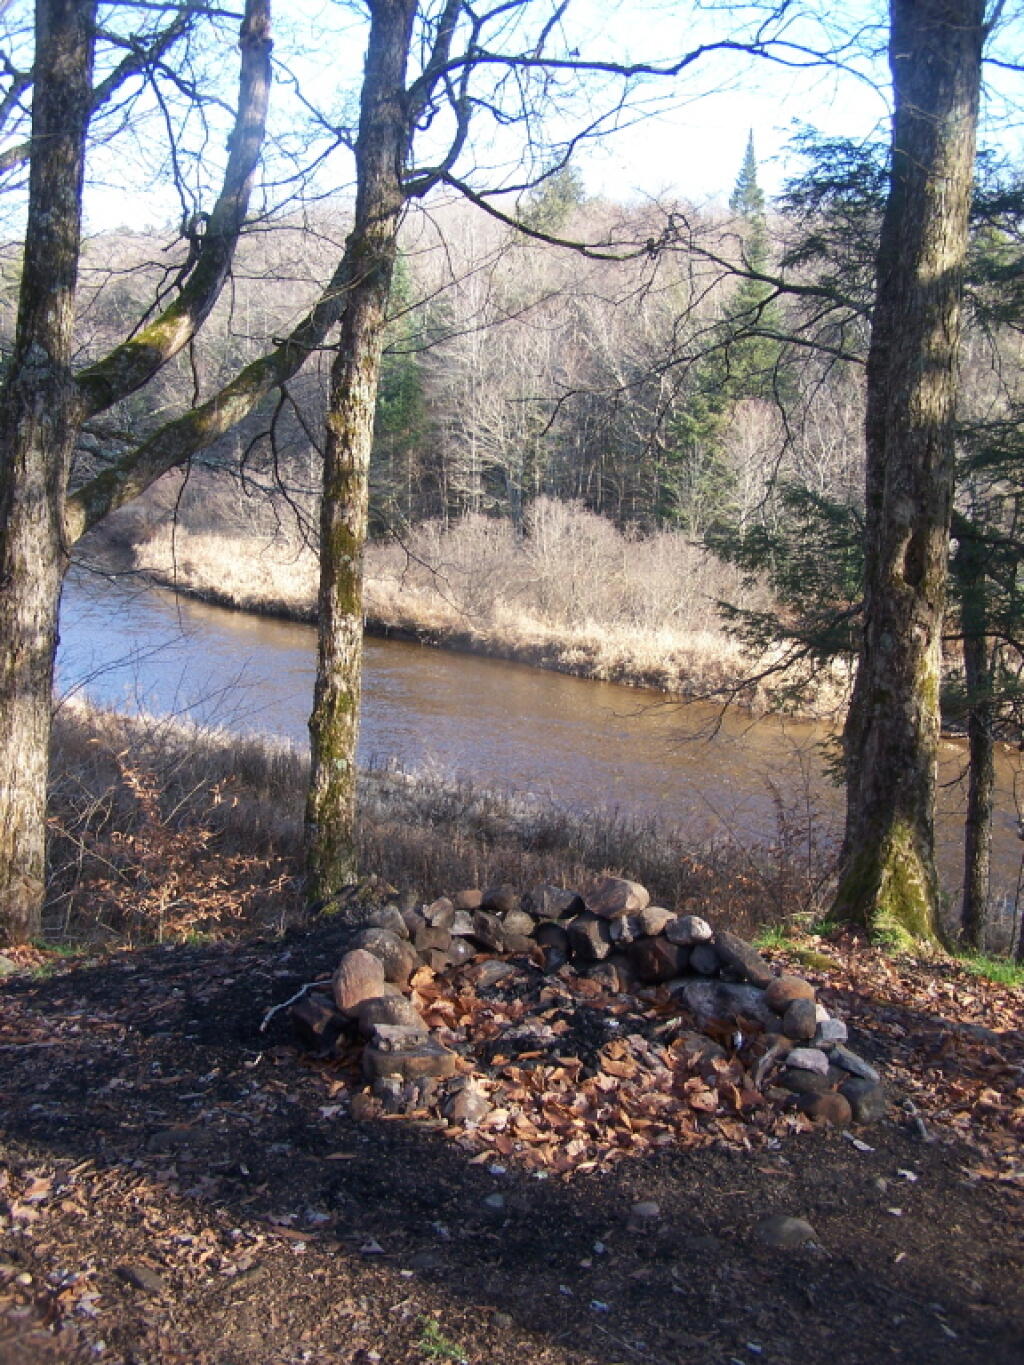
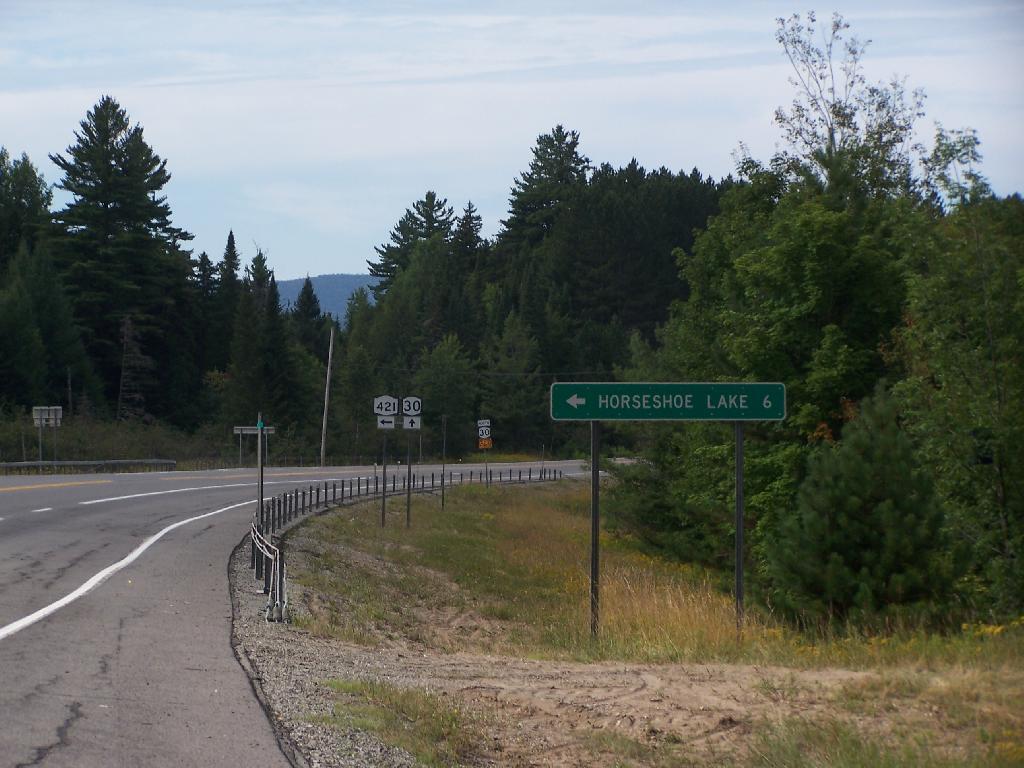
3) NY 421 at Horseshoe Lake
NY 421 is an asphalt road, and there are 4 campsites prior to the gates for Horseshoe Lake Road and Lows Lower Dam Road. These gates will be closed, but the sites along NY 421 before the asphalt runs out should be good as long the snow is off of NY 421..
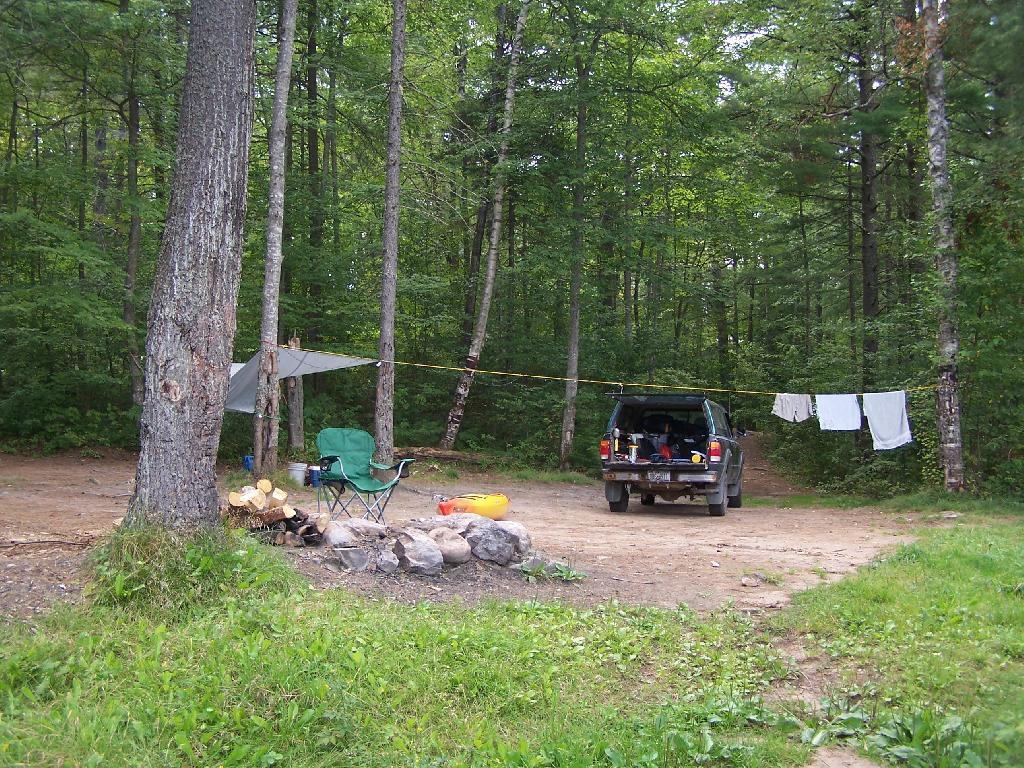
4) Mountain Pond
Mountain Pond Campsites are on an old routing of NY 30. While now unplowed in the winter, the road is mostly hard asphalt, asphalt chips, and gravel. Many of the campsites are reinforced with gravel, but be careful with some of the sites.
5) First Campsite on Wolf Lake Road.
There is a campsite on Wolf Lake Road, right before the parking area and winter road gate for Wolf Lake Road Extension. This campsite is grass, however if it’s relatively dry, snow and mud free, this is possiblity.
6) Reeds Pond Campsite.
Before the black top runs out, there is a campsite along Reeds Pond, which is nice for it’s solitude, but nearness to a dirt road. The campsite may be muddy, depending on the conditions.
In the Adirondack Park there is a Bad Luck Mountain and Bad Luck Pond, along with a Good Luck Mountain and Good Luck Cliffs. I have only been to later, but maybe sometime I will get a chance to visit the much more remote Bad Luck Pond as described by CNY Hiking.
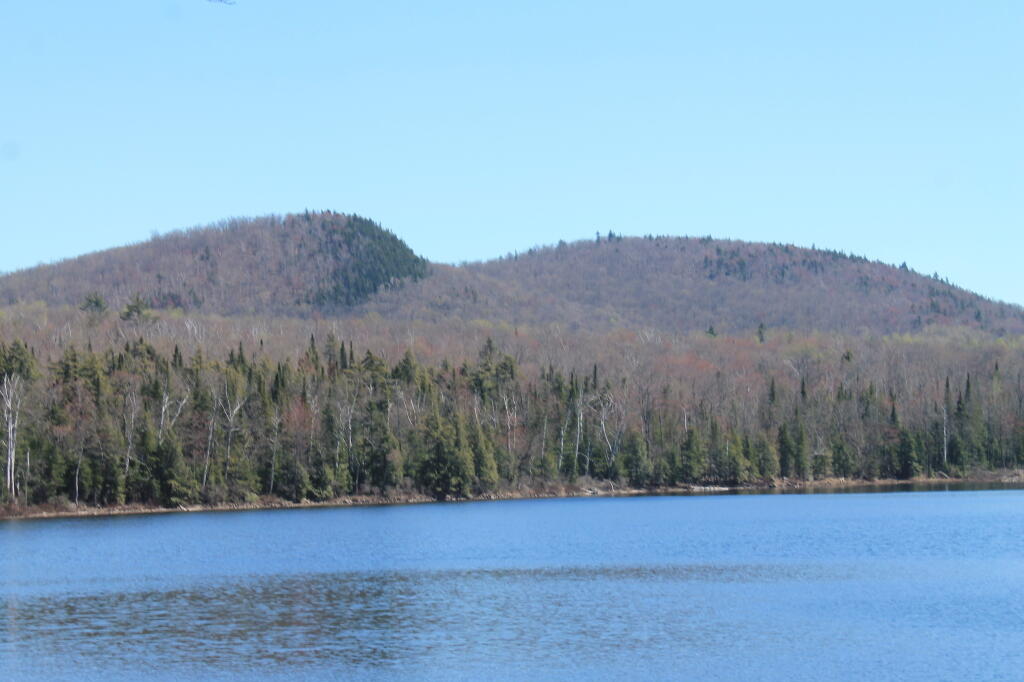
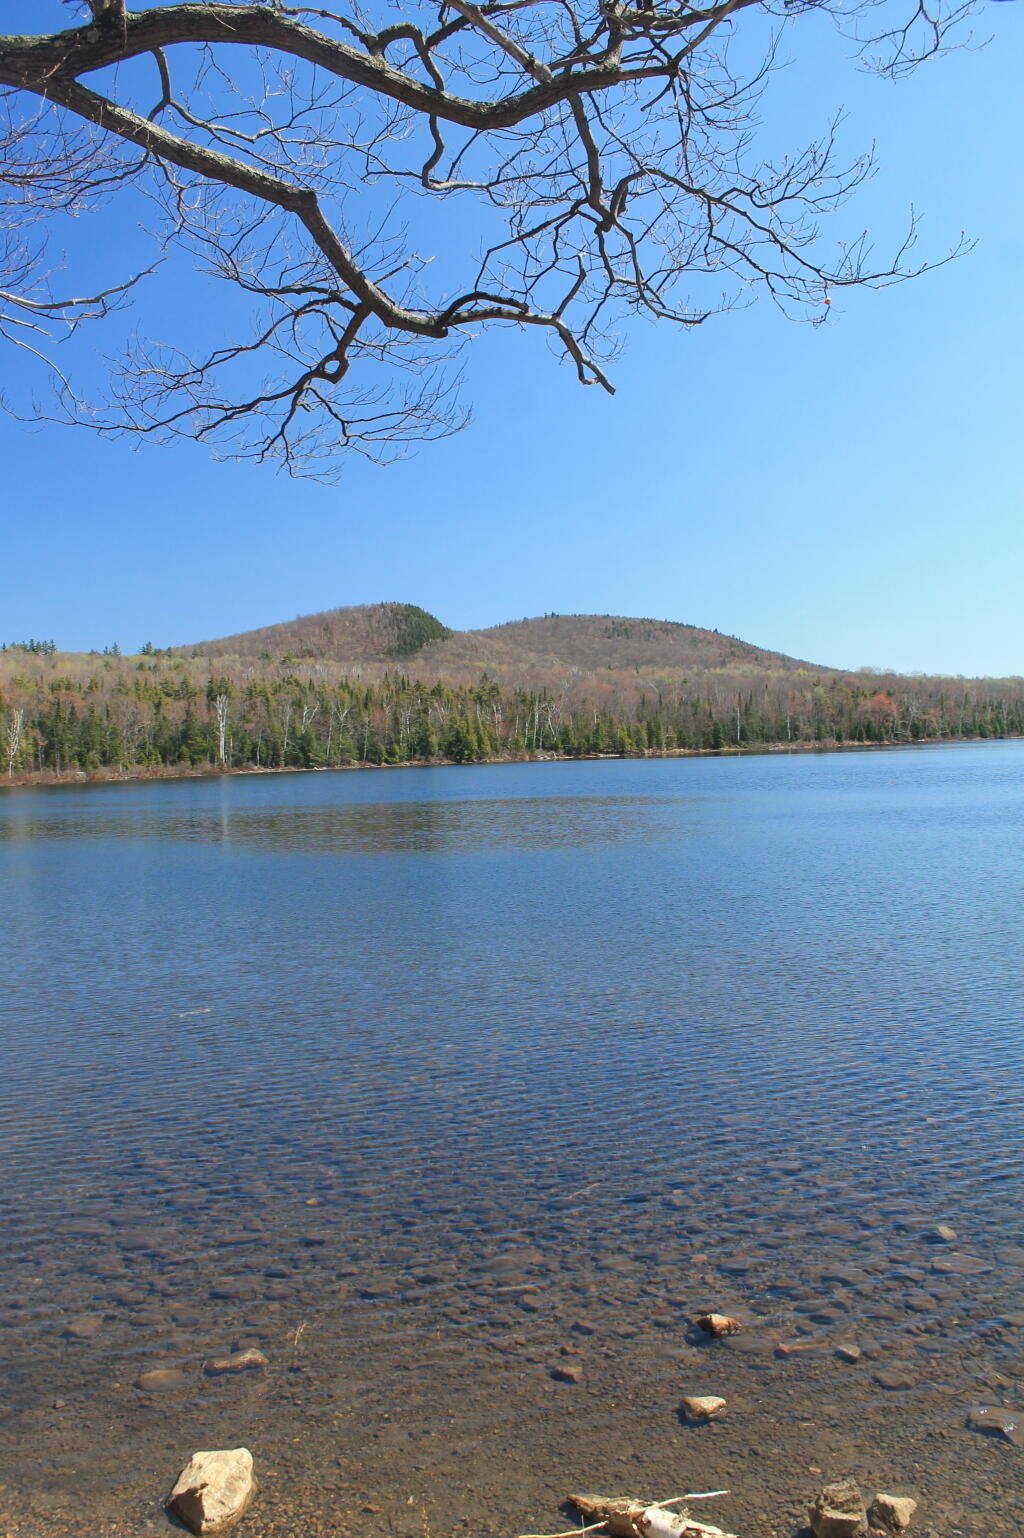
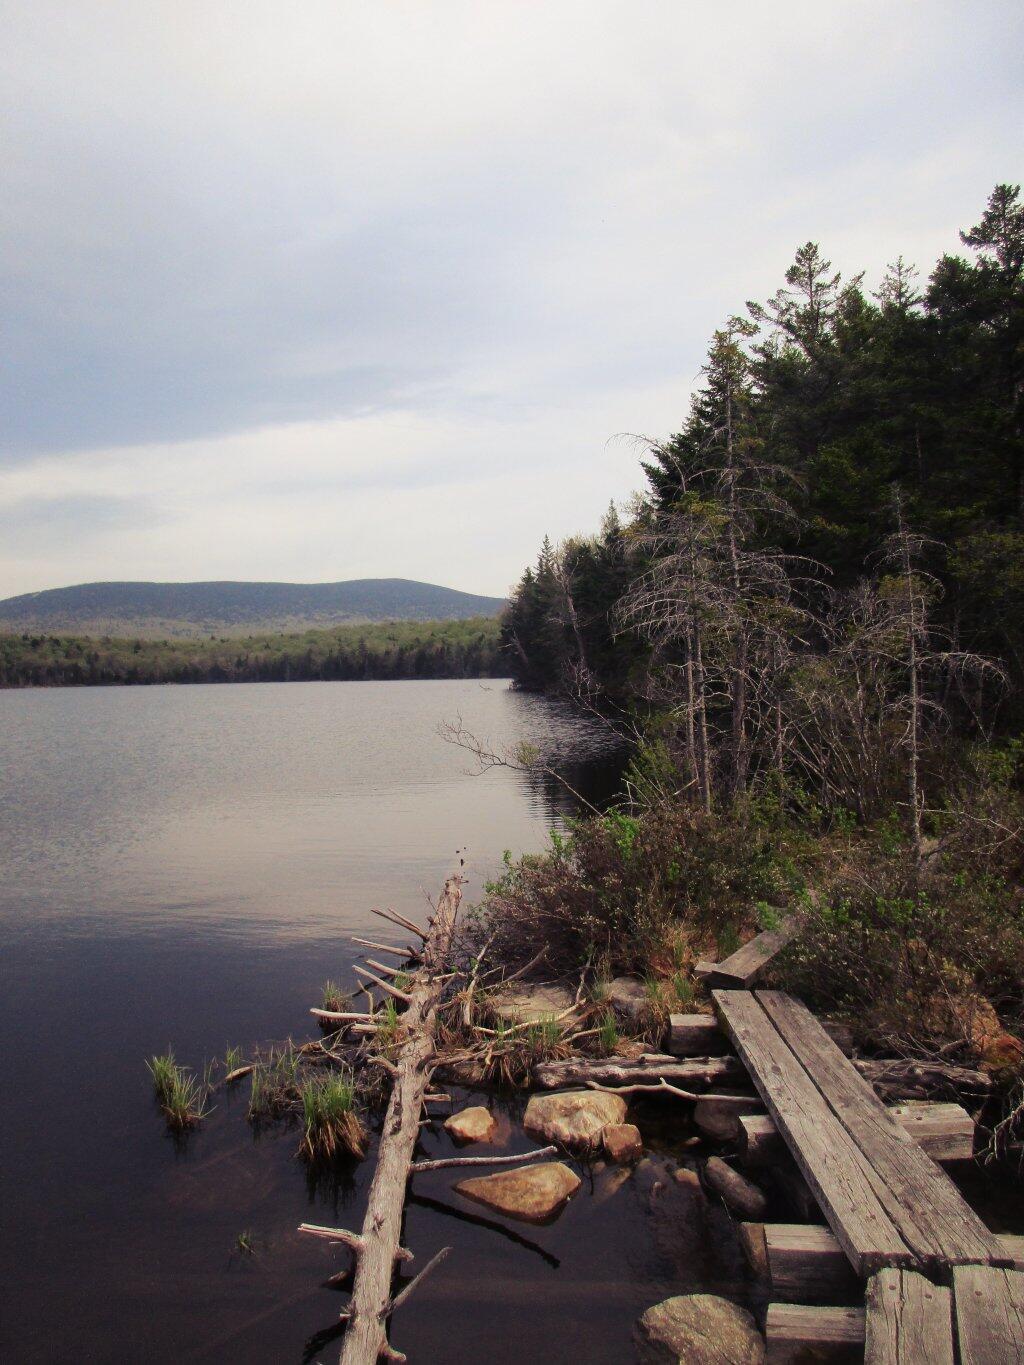
If you are not feeling particularly lucky, consider visiting Big Bad Luck Pond, off of NY 28, roughly halfway between Northville and Indian Lake. It’s a little too far to carry a kayak back into, but it is a 3 mile hike from the trailhead to the pond, passing over the col of Bell Mountain, and several other small ponds. There are some designated campsites near the lake, and it’s below Bad Luck Mountain.
Alternatively, if your feeling lucky, consider visiting Good Luck Lake. Located north of Caroga Lake on NY 10, there are 12 paddle-in or hike-to campsites along the lake, which is located below Good Luck Mountain. It is a delightful paddle on in, but if you go, make sure to visit Good Luck Cliffs and Good Luck Mountain above it.
Census Block Equivalency – A list of census blocks in each district, generated by the commerical GIS program (such as Mapitude) used for redistricting.
Metes and Bounds – A legal description of each district, used in resolving court disputes over district boundaries, and assisting board of elections on where to put voters whose property might be crossed by a Census block
If you planning on making a map, Metes and Bounds won’t be particularly useful. Computers don’t understand english very well, they need numbers and lists. In contrast, the Census Block Equivalency is very useful for mapping things.
Every year, the Census Bureau puts out series of ERSI Shapefiles known as TIGER/Line. You can download TIGER/Line for any state and county in the United States from their website. They provide many different shapefiles and layers such as a Highway, Faces, Edges, and County Subdivision layers, however the one you will be most interested for making district maps is the Tabulation Block (tabblock) layer.
You can use these files in the free program known as Quantum GIS or QGIS. While this tutorial will not explain the ins and outs of QGIS, this should get you started on making redistricting maps.
The Tabulation Block Layer is the file containing all of the Census Blocks for a particular county. A Census Block is the smallest unit of population gathered by Census Block, and consists of all bordering features (bounds) — roads, rivers, shorelines, along with all imaginary lines (metes) — town lines, village lines, other lines drawn for statisitical purposes.
Each Census Block has a number, that is a subdivision of the Census Block, County ID, and State ID that it resides within. For example, the Governor’s Mansion in Albany is located in Census Block 2000 in Census Track 23.00 (zero padded to 002300) in Albany County (Federal Information Processing Standard — FIPS ID: 01) which is in NY State (FIPS ID: 36). County subdivisions are not applied to Census Tract Numbers, as they may in some cases cross county subdivisions, as is the case of smaller districts.
You put those numbers together to get the GEOID — which is the key used for redistricting block lists and most other block-level census data. The Governor’s Mansion is located at a block with a GEOID 360010023002000.
36
001
002300
2000
State ID
County ID
Zero Padded Census Tract Number
Census Block Number
The block list you get from a redistricting commission typically is in Database Exchange Format (.DBF) or Comma Deliminated Format (.CSV) which are both openable by common spreadsheet applications like Microsoft Excel or OpenOffice Spreadsheet and GIS programs like ArcGIS or Quantum GIS.
This is taken from the LATFOR State Senate Proposed Districts (January 2012) DBF file. It shows you that the Governor resides in Proposed Senate District 44. Across the river in Census Block 4010, Census Tract 524.03, in Rensselear County (FIPS ID 83), NY State (FIPS ID: 36) is located in Proposed Senate District 43.
360010023002000
SD44
360010021002008
SD44
360010021002004
SD44
360010021002001
SD44
360830524034017
SD43
360830524034010
SD43
Download the TIGER/line “Tabulation Block” Shpaefile file for the district you are interested in. You will want the 2010 version. You can download a state-wide tabulation block file, however that is not recommended as the next step will be impossibly slow on most computers. You may also want to open the .CSV or .DBF file in your spreadsheet program and cut out the county you want to speed things up.
You will then want to open up the file in Quantum GIS. You will get a nice map of the county you downloaded, showing all of the Census Blocks.
From there, go to the Vector -> Join Attributes submenu.
Make sure that the Target vector layer matches the Tabulation Block Shapefile you wish to join against, then set Target join field to GEOID10 .
Select click Join dbf table and select the DBF or CSV file you wish to join.
Change the Join field to BLOCK or whatever the GEOID is titled in your redistricting block file.
Enter in a location to save the Output Shapefile
Click okay.
Then wait. A typical county will take 10-40 minutes to join on my 5 year old laptop; your computer may be quicker. If you have a dual processor machine, go on to doing other work in other programs. You will end up with a map that looks like this (stylized for your enjoyment). Each block will be assigned a Senate District (in this example).
Halfway there. Now you need to “dissolve” each Census Block into it’s larger political district. Go to Vector -> Geoprocessing Tools -> Dissolve . Set the Input vector layer to the file you previously joined. Then set the Dissolve field to the field containing the district number — such as DISTRICTID or whatever it is named. Enter a name to safe the file. Click Dissolve.
Outputed will be a Shapefile containing all the political districts in the county you joined and dissolved. This will take 5-20 minutes on my laptop. Other data may exist in that file, such as Census Block number, however at this point that data will be invalid, as only the district number is accurately preserved in such a join. All other data will be picked at random, so delete those columns.
I hope this is helpful. If you just want the Proposed State Senate or State Assembly Districts you can download them from Center for Urban Research. These are the same data, joined using the above process by somebody with a much faster computer. I have also made up a Shapefile containing the Albany County Legislative Districts using this process.
I often prefer to use Net Votes per Election District, as this more clearly shows were a person lost and won the race, because Turn out can very quite widely from Election District to Election District. Moreover, some Election Districts are more populus then others.
Turn out was particularly high in districts that Sandy lost, particularly in Westerlo ED 3 (Dormansville), one of most conservative EDs in Albany County currently.
This map shows the Average Democratic Preformance of Statewide candidates by 2010 Voting Tabulation District, with the 2011 County Leg districts superimposed. Be aware that all statewide Democratic candidates preformed quite well across 2010 Albany County,but it also shows the weakness in Dormansville (Westerlo ED 3), and Cooksburg-Preston Hollow-Potters Hollow (Rensselearville ED 2). The entire district was and is marginal Democratic, and can easily swing into the Republican column.
.
While Sandy Gordon got a higher percentage of votes on Democratic line then Debra Bush on the Republican line, the heavy Conservative-block vote in Renselearville EDs and South Westerlo (ED 1) provided a margin of victory for Debra Bush.
Sandy Gordon lost 2/3rds of Knox in the redistricting. He preformed worst in the new portion of the district — specifically Westerlo — and failed to hold onto Renselearville.
While he faced a Tea-Party Movement in Renselearville that organized against him, if he had spent more time going door-to-door in this portion of district, along with introducing himself to Westerlo voters, he may have been able to hold on to his seat.
Regardless, it was tough year for Democratic Incumbents, especially those with a long record and many difficult votes to face, such as over-riding the tax-cap, which will hurt rural residents and those of the hilltowns who own a lot of land hardest.
Today we look at land use in the Mohawk Valley. Here a series of maps along the Mohawk River, showing land use as a quad color image, based on NASS/Landstat data from the region. The images below use the following colors:
Red – Developed areas such as cities, highways, and other industrialized or otherwise developed parts.
Yellow – Agricultural areas, including all farm crops such as corn, hay, alfalpha, and other truck crops
Green – Woodland, brush, and barren lands
Blue – Water bodies
These images should pick up detail up to about 300 feet in any particular direction.
Overwhelmingly, the Mohawk Valley is about agriculture, although as elevation increases and farming is no longer profitable, then farm fields revert to tree cover. And while their are certainly single family homes and other rural residents under the tree cover, by no means is development the overwhelming use of the land.
Utica Area.
Most of the farming in the Utica-area, occurs south of the city, due to the sandy soils, short growing season, and elevation making farming unprofitable north of city. This map may actually distort how much land north of city is actually farmed, as many of farm fields shown on this map have been abandoned and are slowly reverting to brush and ultimately tree cover.
Canajoharie Area.
As you get around Canajoharie the amount of farming activity picks up dramatically, and except for a small section right next to the Mohawk Valley, most of this area is not developed.
Albany-Schenectady Area.
Heading towards Albany-Schenectady, you see more development, but notice how you don’t have to get far from the city for forest cover to be dominant feature, and not agriculture. A lot of this is rural residents, with acreage, and hobby farms around here. Farming stops when you get up on the Rensselear Plateau, although the farm lands right around Brunswick are quite profitable, until you start heading towards Grafton where almost all farming stops.
Folks in my age group under Social Security can retire at Age 67 if they so please. While I don’t know if I will retire at Age 67, I generally believe that Social Security will be fixed by that point, and that will be an option if I so choose. I hope I have the finanical savings and a pension at that point to supplement social security if that’s what I want, or choose to continue to work if work is my passion and I feel that I am doing good for society by continuing to work.
The year 2050 is an interesting one. It’s a popular round number taken up by political pundits and futurists trying to predict the future.
Bill McKibbean and the 350 people insist that humanity must reduce it’s carbon outputs by 80% of 1990 levels by 2050, also known as the 350 ppm by 2050 goal. Others insist that there will be no Social Security in 2050, or that fossil fuels will run out by 2050, or that the world will be otherwise awful dark and bleak in 2050. Some like James Howard Kunstler think the year 2050 will be one of mass suffering and misery, as humanity fails to move away from it’s excessive use of fossil fuels and international commerence.
More hopeful futurists look at 2050 as era of great progress, an age of great equality, and technocratic success. Transportation will be automated and run on clean electricity generated from renewable sources that won’t harm the planet. Flying cars will wisk you to your destination! People will overcome their evil ways, and war will be obsolete. Humans will be healthier and avoid much of the suffering that is the norm of the day. Poverty will be a thing of the past.
I suspect both predictions will be look increadibly dated by the time I’m ready to enter retirement and my golden years. After all, the year of 2050 is about as far away as the year 1972. Since 1972, the world has not choked and died from smog or excessive development. There are still vast areas of open lands, forests, and farm land. Yet, there are still pollution problems, and we have yet to enter an age of golden prosperty. 39 years later, still a lot of people are still suffering, but things have gotten better for many people.
I truly believe that world is not coming to an end. I also don’t believe the world of 2050 will be vastly different then today, even if fashions change as do technologies. Some things will become easier, and maybe more automated, but the world will look remarkably like today.
How much of the Mohawk Valley is developed, how much is farmed, and how much is forested? These images give you a clear overview, with all agricultural cropland and pasture colored yellow, all forest lands colored green, waterways colored blue, and developed areas are red. This is based on LANDSTAT and USDA NASS Croplayer data.
Overwhelmingly, the Mohawk Valley is about agriculture, although as elevation increases and farming is no longer profitable, then farm fields revert to tree cover. And while their are certainly single family homes and other rural residents under the tree cover, by no means is development the overwhelming use of the land.
Most of the farming in the Utica-area, occurs south of the city, due to the sandy soils, short growing season, and elevation making farming unprofitable north of city. This map may actually distort how much land north of city is actually farmed, as many of farm fields shown on this map have been abandoned and are slowly reverting to brush and ultimately tree cover.
As you get around Canajoharie the amount of farming activity picks up dramatically, and except for a small section right next to the Mohawk Valley, most of this area is not developed.
Heading towards Albany-Schenectady, you see more development, but notice how you don’t have to get far from the city for forest cover to be dominant feature, and not agriculture. A lot of this is rural residents, with acreage, and hobby farms around here. Farming stops when you get up on the Rensselear Plateau, although the farm lands right around Brunswick are quite profitable, until you start heading towards Grafton where almost all farming stops.


")