In New York State, you have to register in a political party to be eligible to vote in primaries. You can’t vote in a Democratic primary, for example, if you are not a registered Democrat. The same is true with Republicans and all minor parties.
That said, in most parts of New York State, 15-25% of all voters choose to not register in a party. They may choose not to enroll in a party, as they don’t want to publicly identify with one side or another, or they do not feel comfortable with either party’s platform.
So where do the the voters who choose not to register in a party, aka blanks live? To answer that question, we take a look at Google Maps, using LATFOR voter registration data. Due to the limitations of Google Maps, we only included data at the municipal level, but it gives you a definate feel for enrollment patterns in different parts of state.
Next week we will take a look at actual “swing” voters on a state-wide basis at the MCD level. Swing voters are different from “blank” voters, as they are voters who choose to vote cross-lines, such a voting for a Democrat for President, then choosing to vote for a Republican for State Senate, and a Democrat for State Assembly. “Blank” voters might be enrolled in a party, but they may always consistently vote for Democrats and Republicans.
Reviewing these maps, you will note that the Hudson Valley and Suffolk County have the highest percentage of blank voters in the electorate. Suburban areas also tend to have greater number of blank voters, compared to urban centers and rural areas.
So how has the number of blank voters changed in the state from 2006 through 2010? It varies widely based on region of state, but in general partisan enrollment is up in the state, except in some rural portions of the state that used to be more heavily Republican.
2006-2010 Municipalities with Decreases in Blank Enrollment.
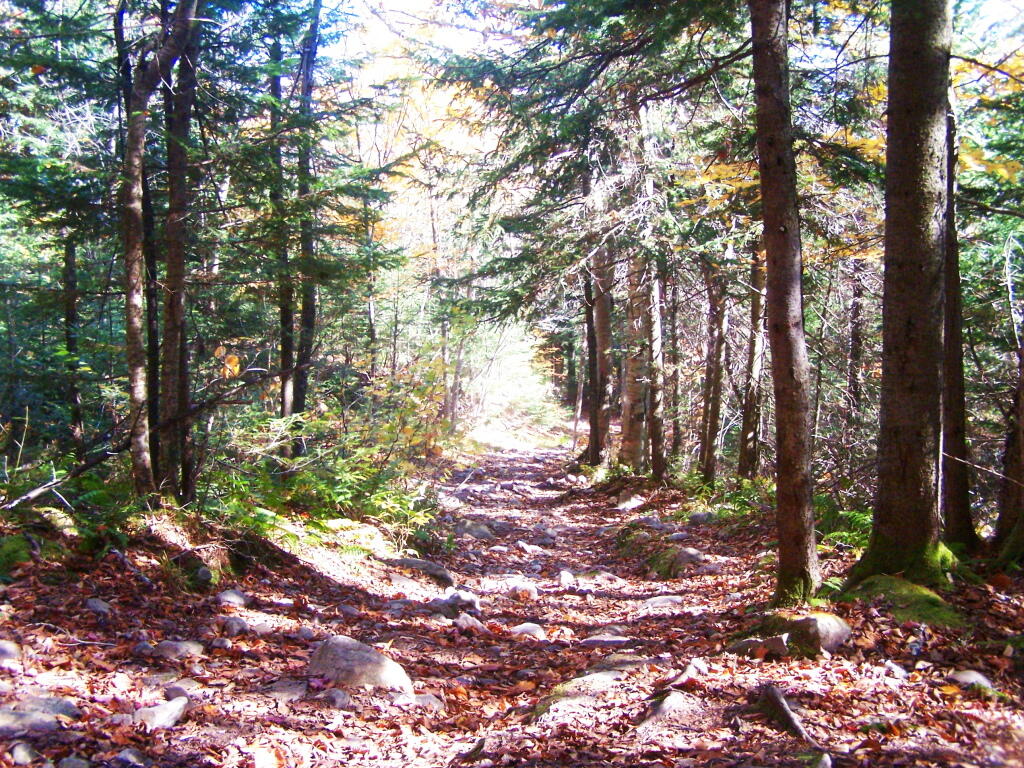
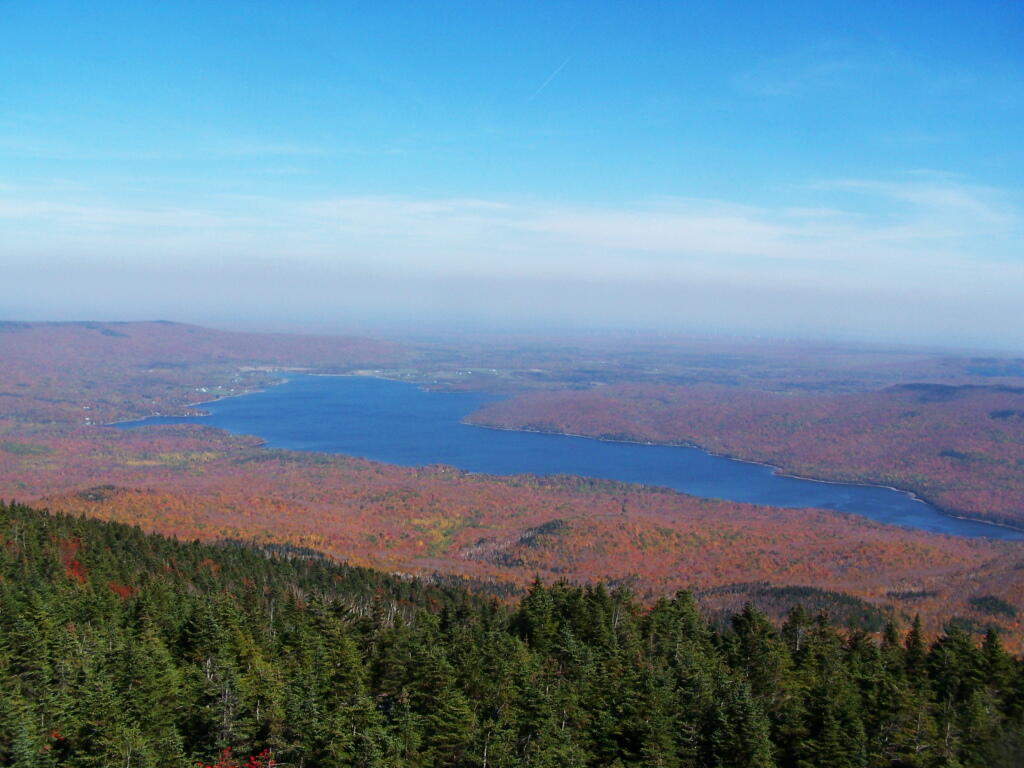
Last October I went for a hike up Lyon Mountain. The first 3/4 of a mile you can drive up to the parking lot, then from there, it’s a two mile hike to the summit, or about 3 miles if you take the new trail.
The old trail, following an old woods road is eroded and rough in places, but it well traveled as it much shorter. The new trail, being so twisty is not as well traveled, but it is far less steep and tends to be less wet in the spring time.
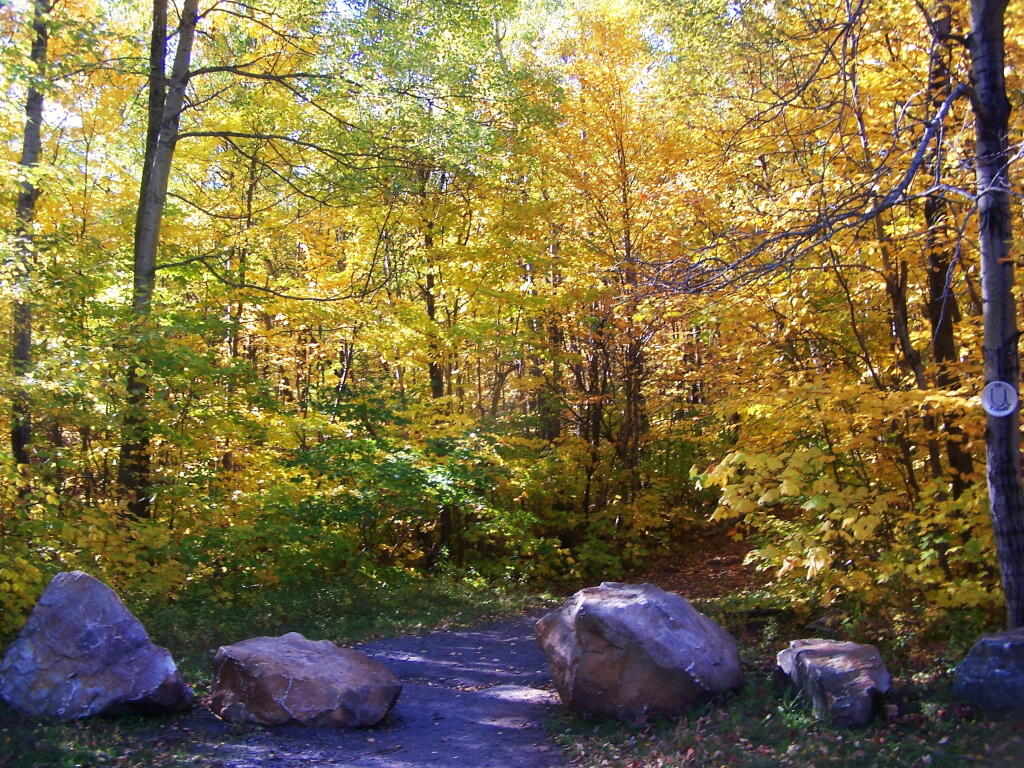
Heading up from the parking area, the first part of the trail follows the old trails route, before swinging left near a registration kiosk.
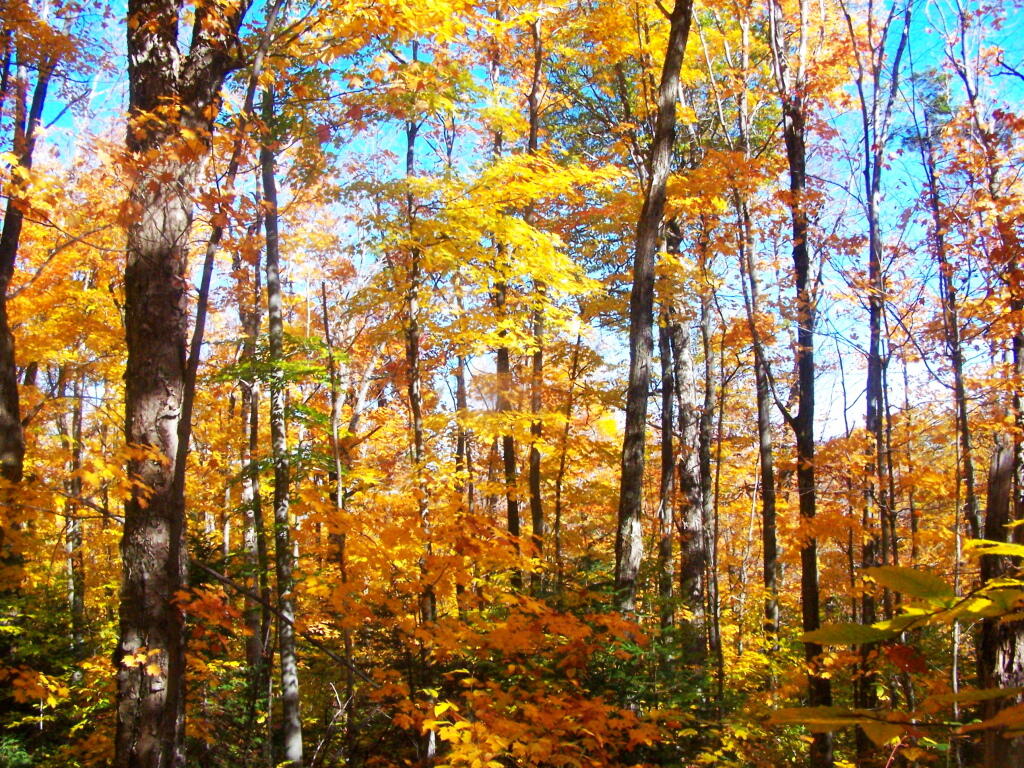
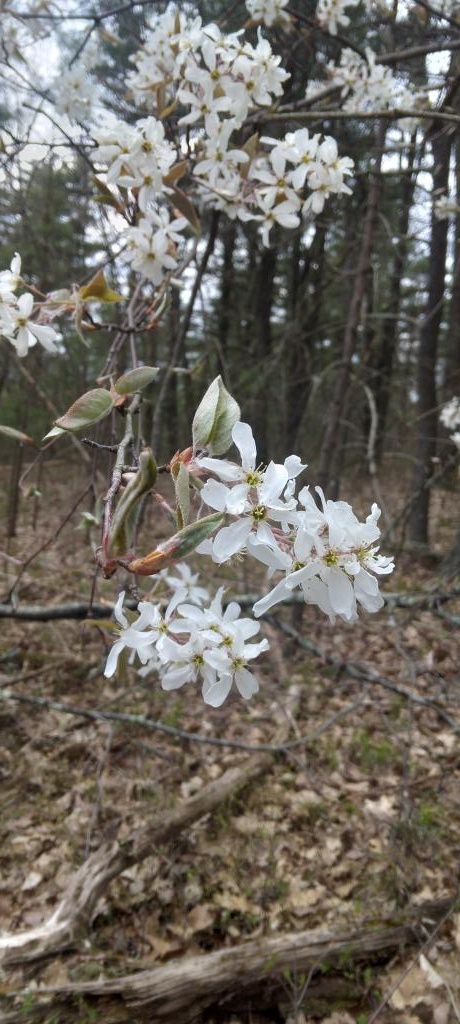
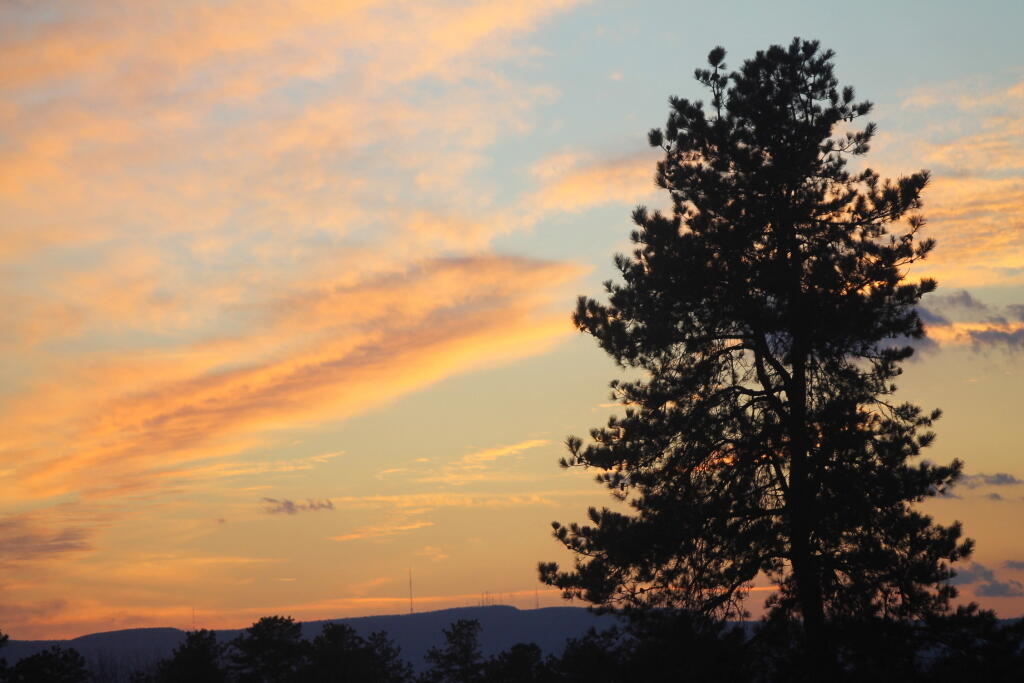
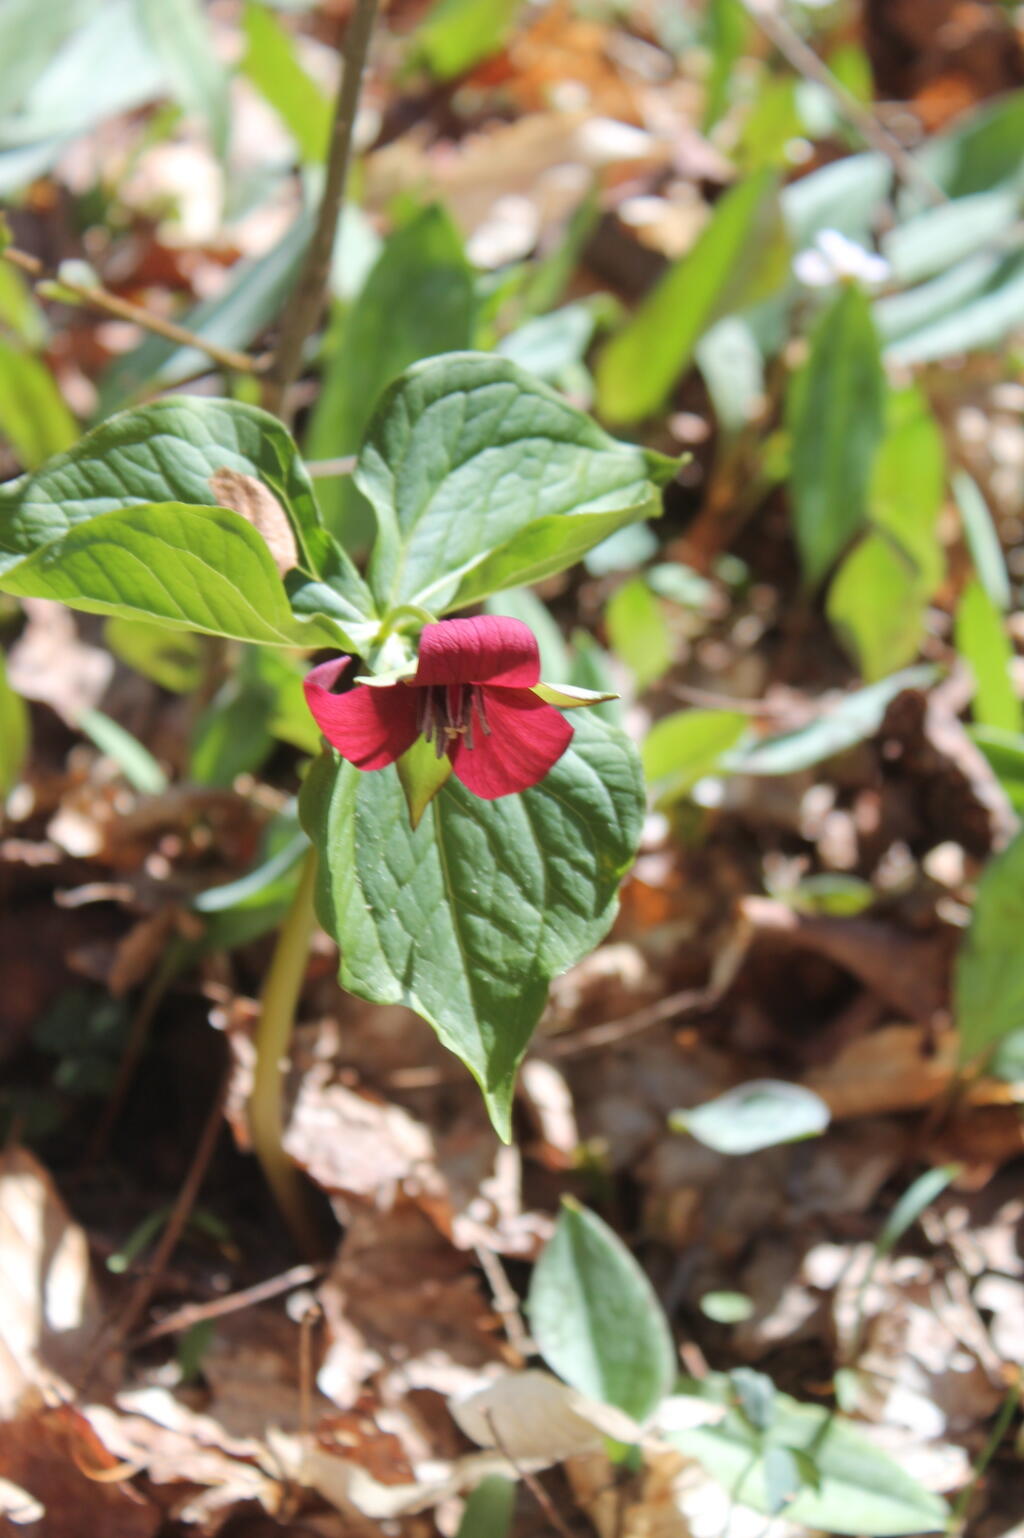
It was very colorful along the new trail as all the maples where at about peak color going up the mountain.
I decided to switch over from the new trail to the old trail, once I reached the point where the trails reached their closest point at the midpoint up the mountain.
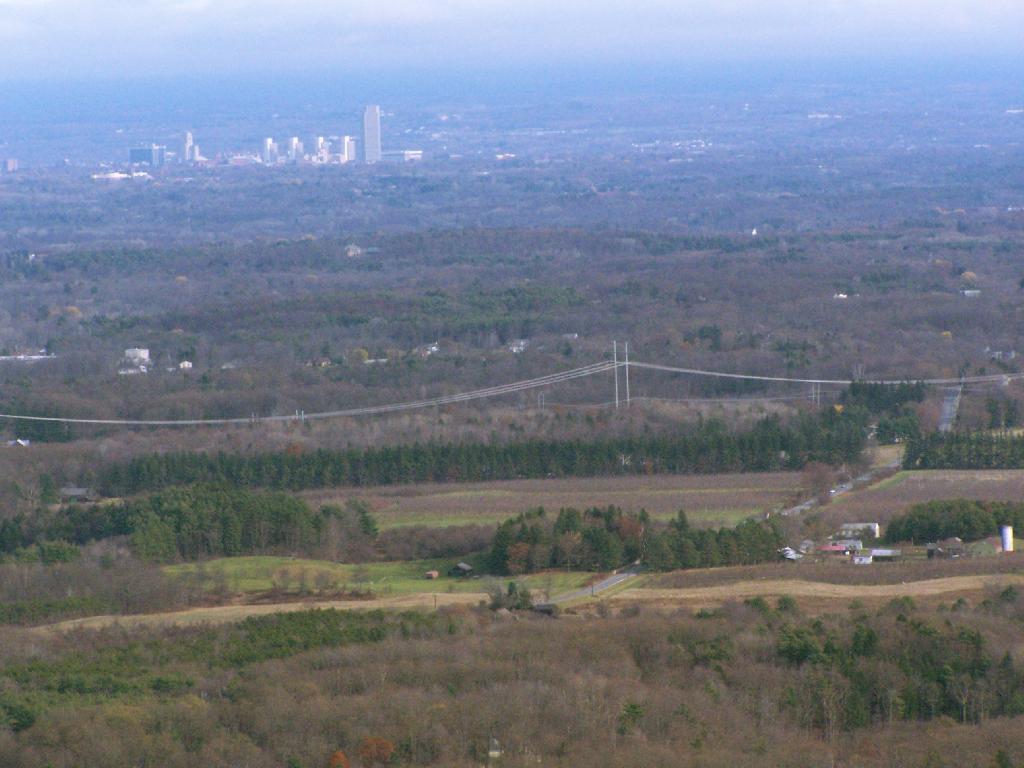
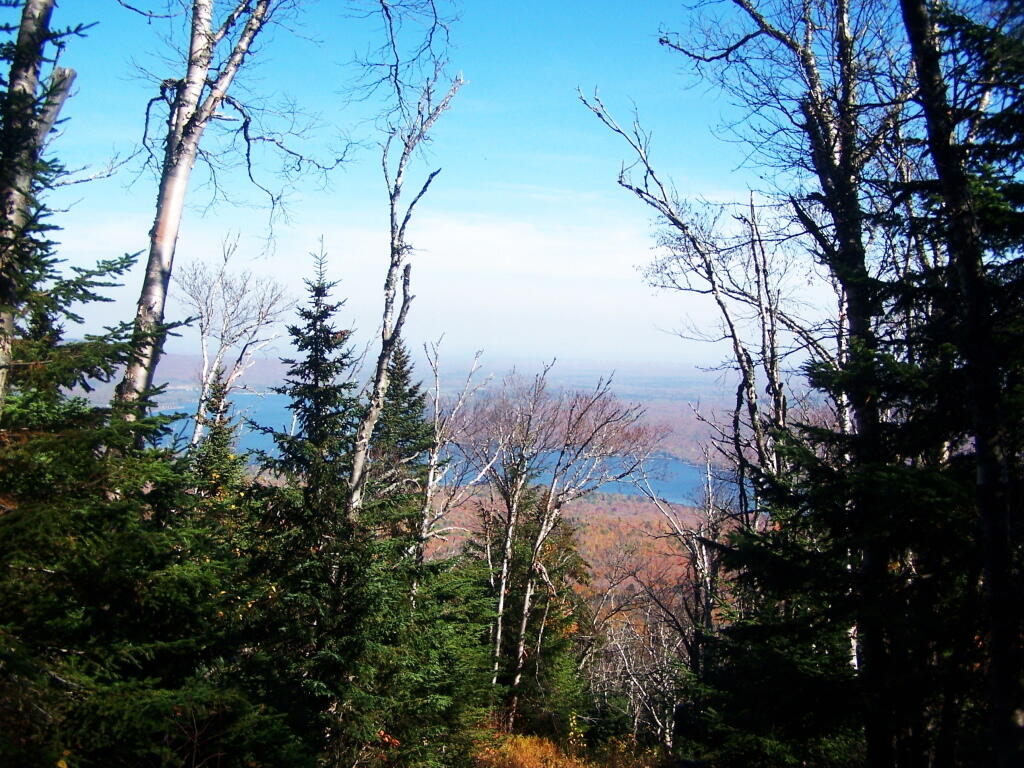
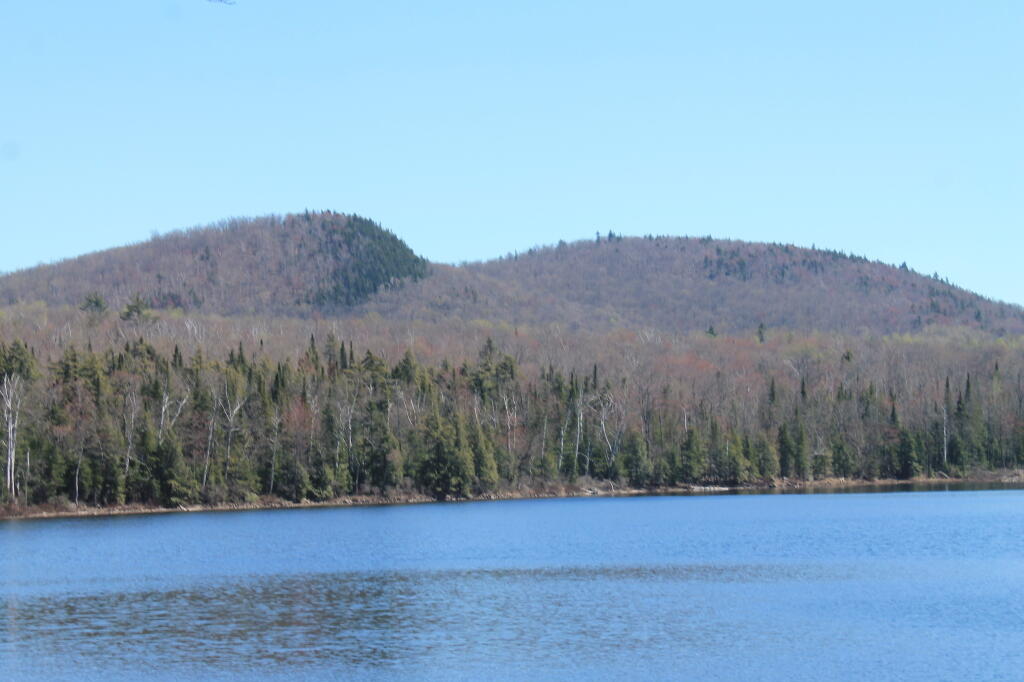
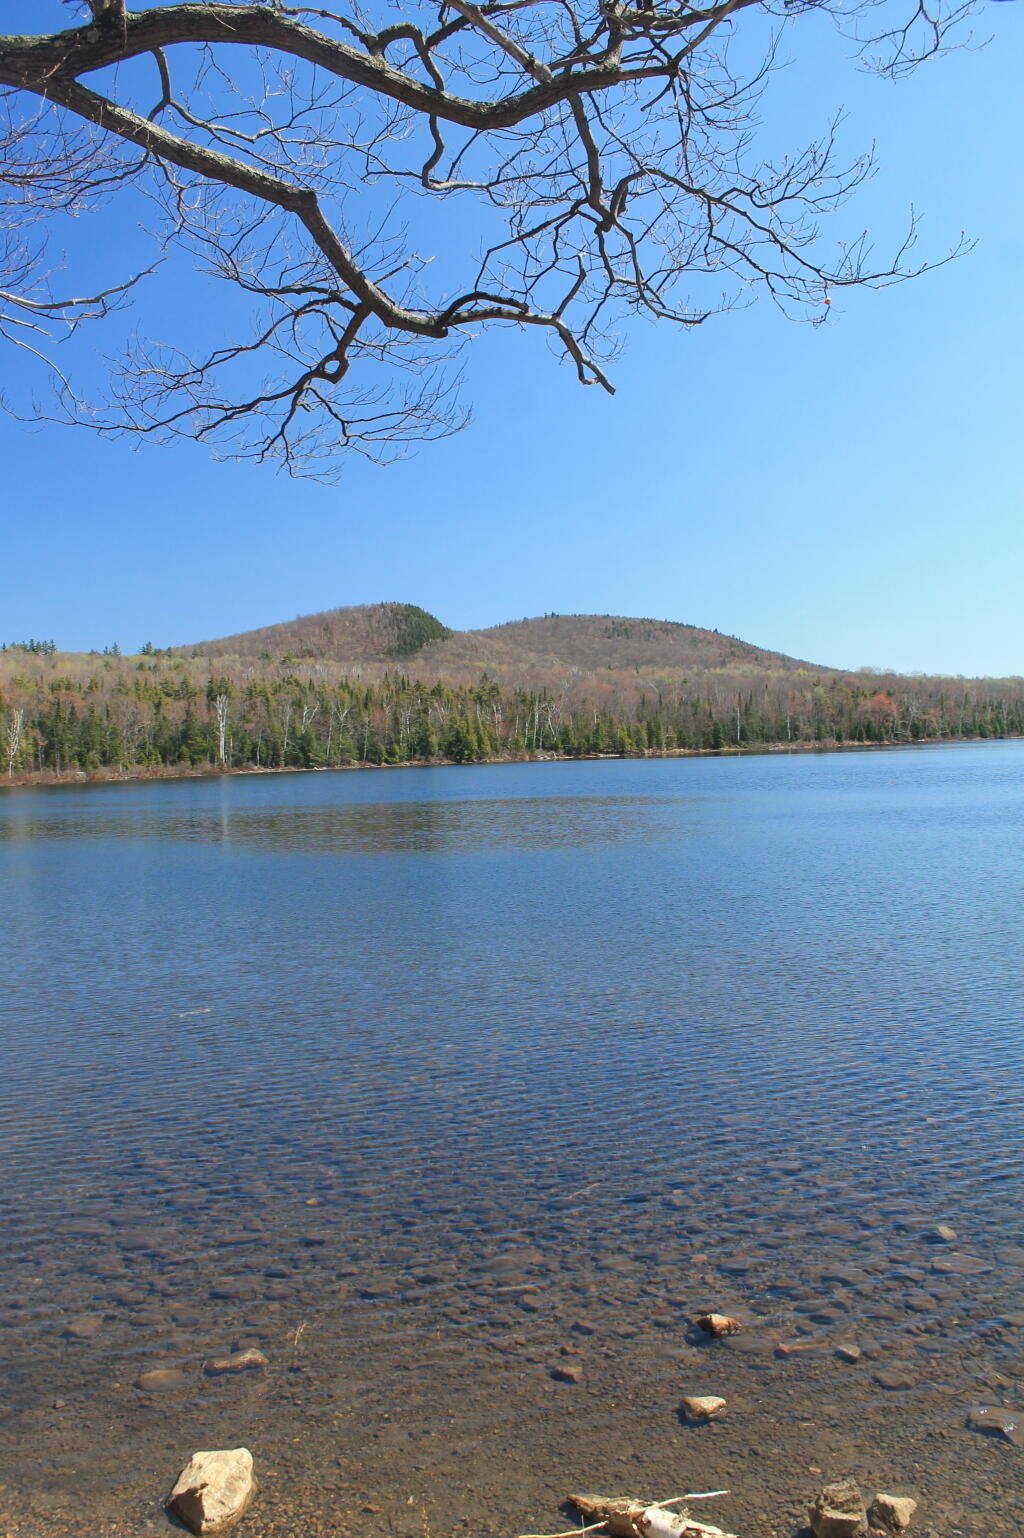
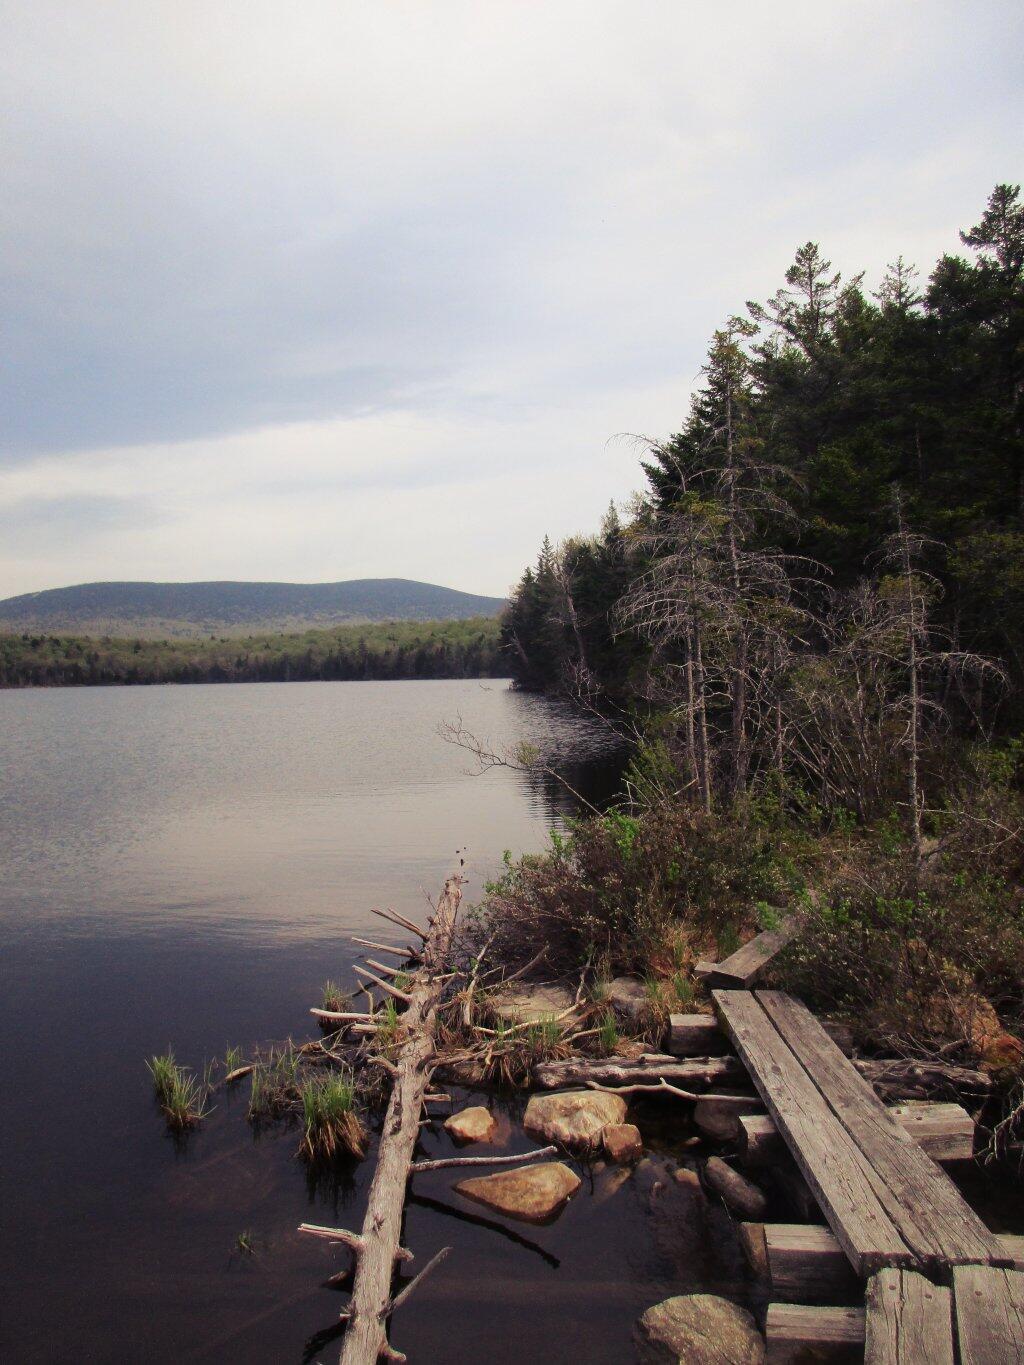
As you get about 2/3rds the way up the mountain, you can look back and see Lake Chazy.
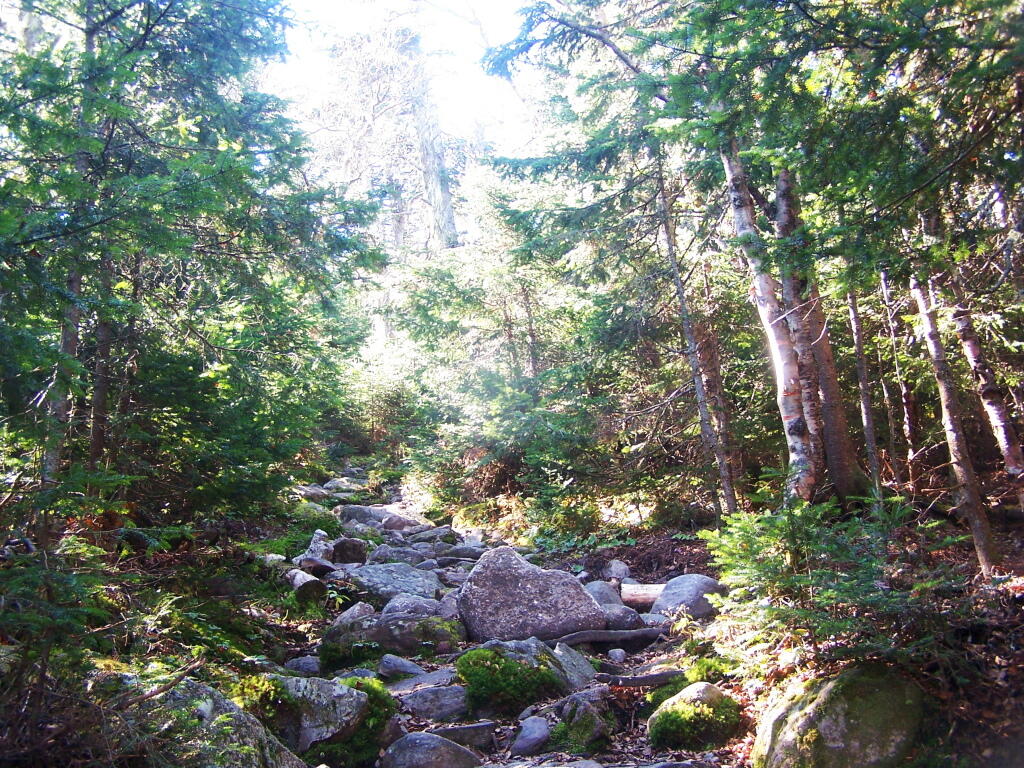
The old trail certainly is eroded and in rough sape in some parts. You can understand why they re-routed it.
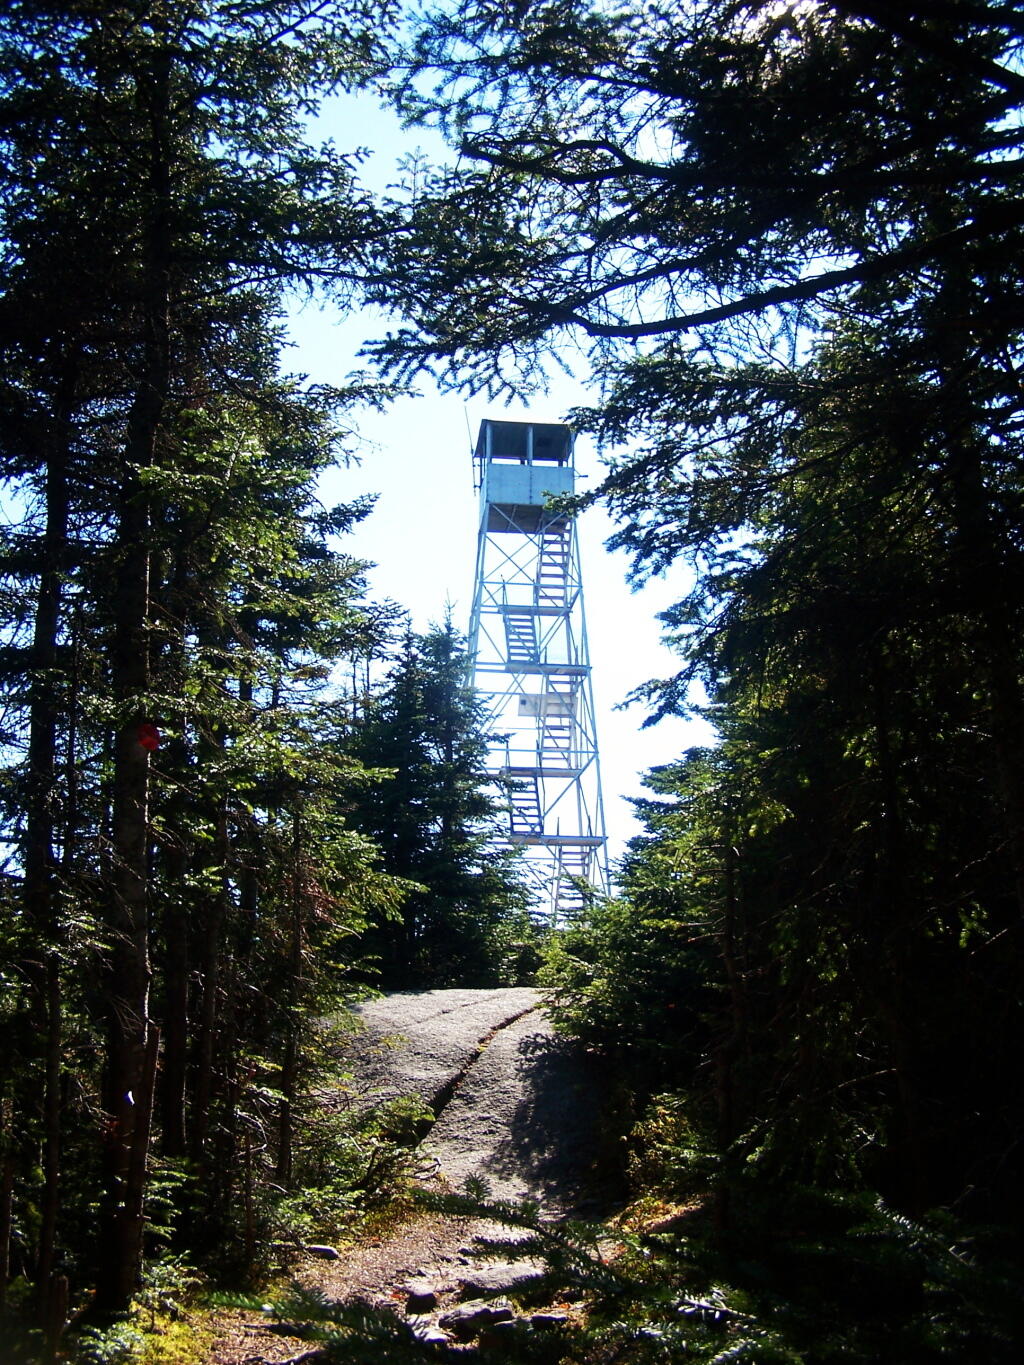
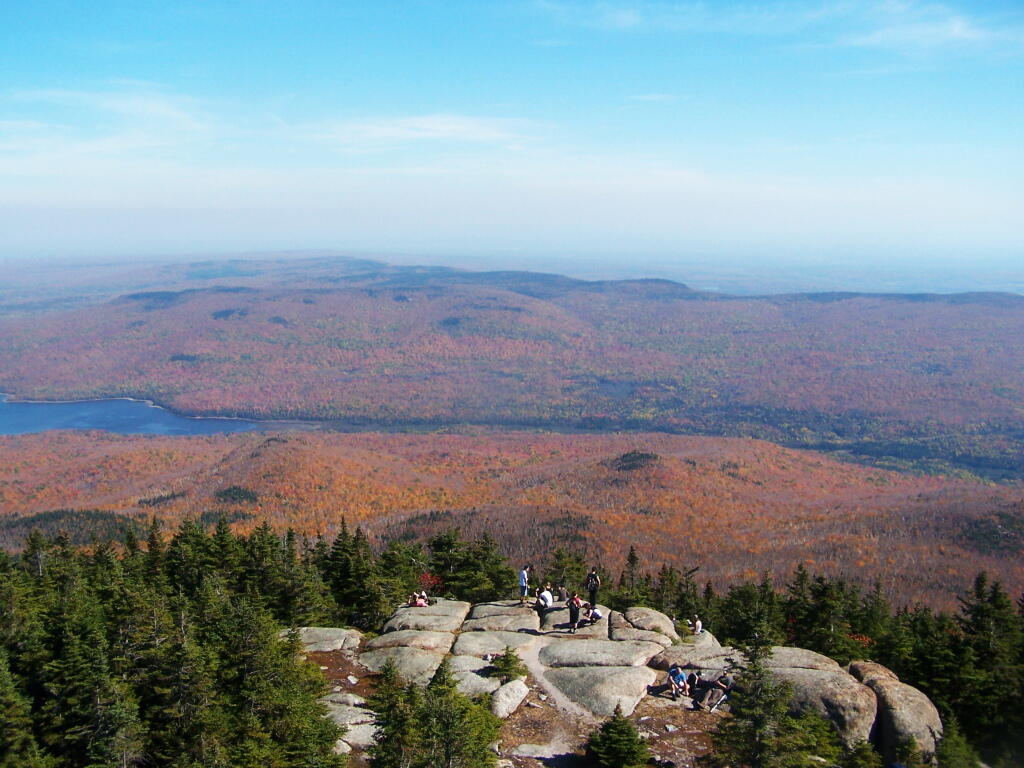
Ah, finally see the fire tower.
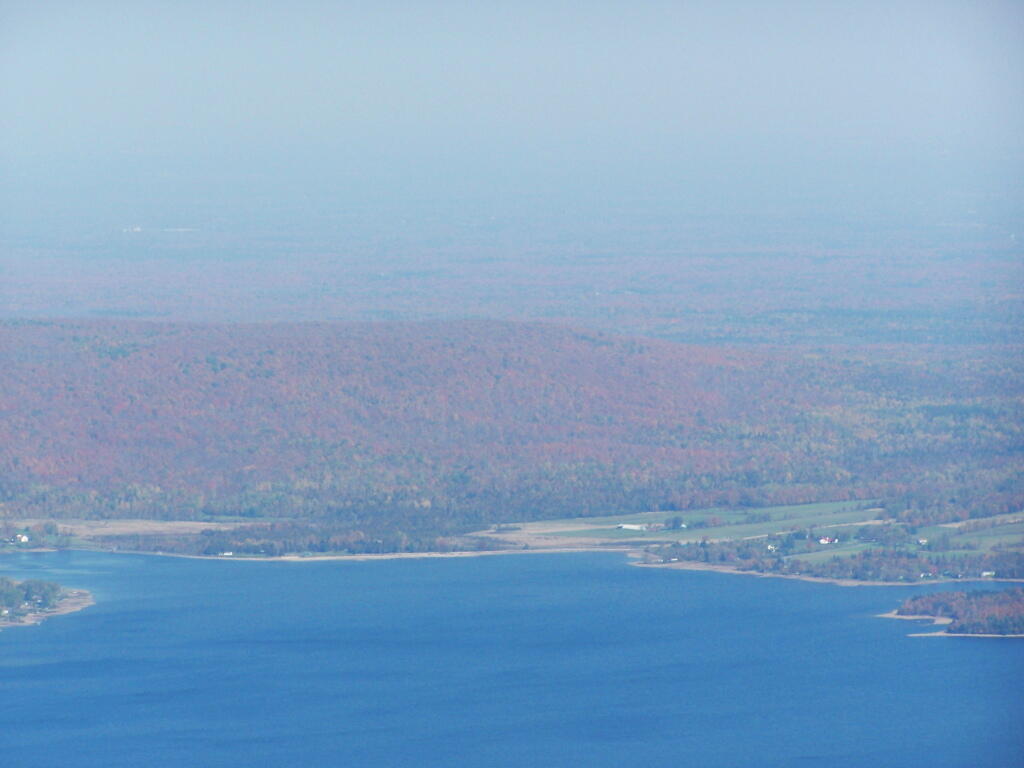
Hazy day, but there’s Lake Chazy and the farms along it.
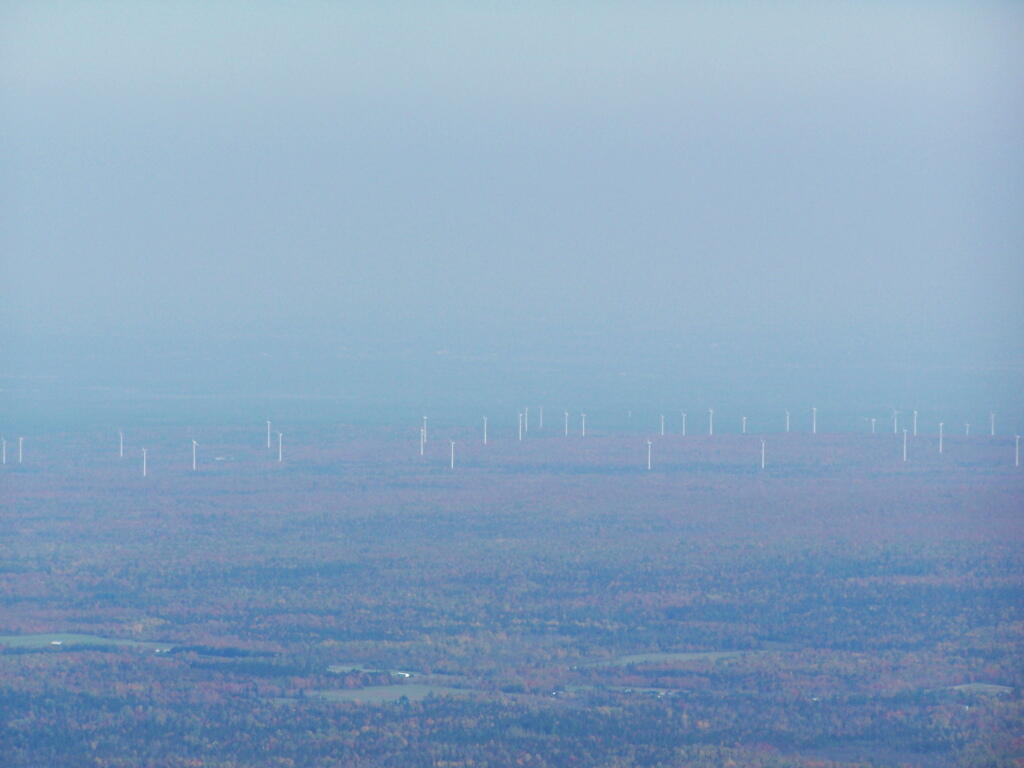
Wind turbines of the Chazy Highlands…
Lyon Mountain is a popular hike, as seen by all the hikers on the ledge.
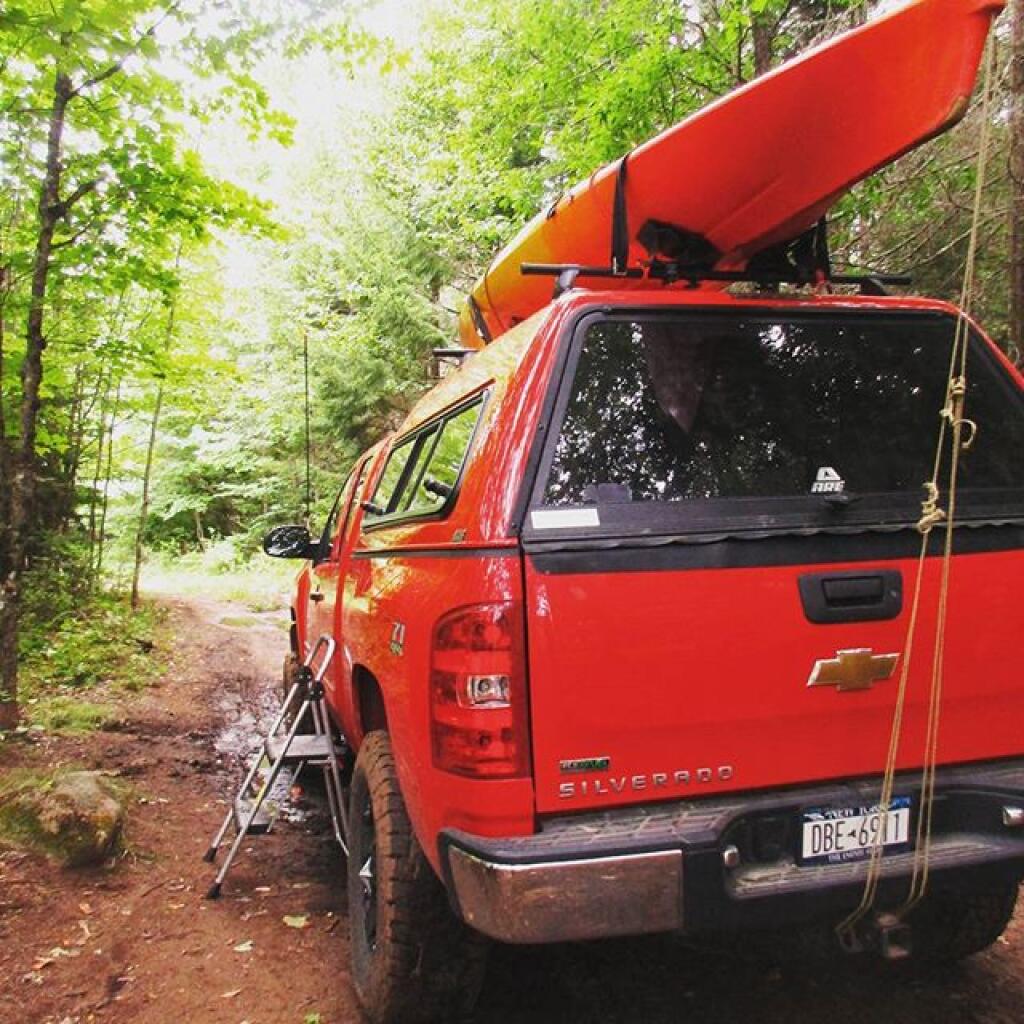
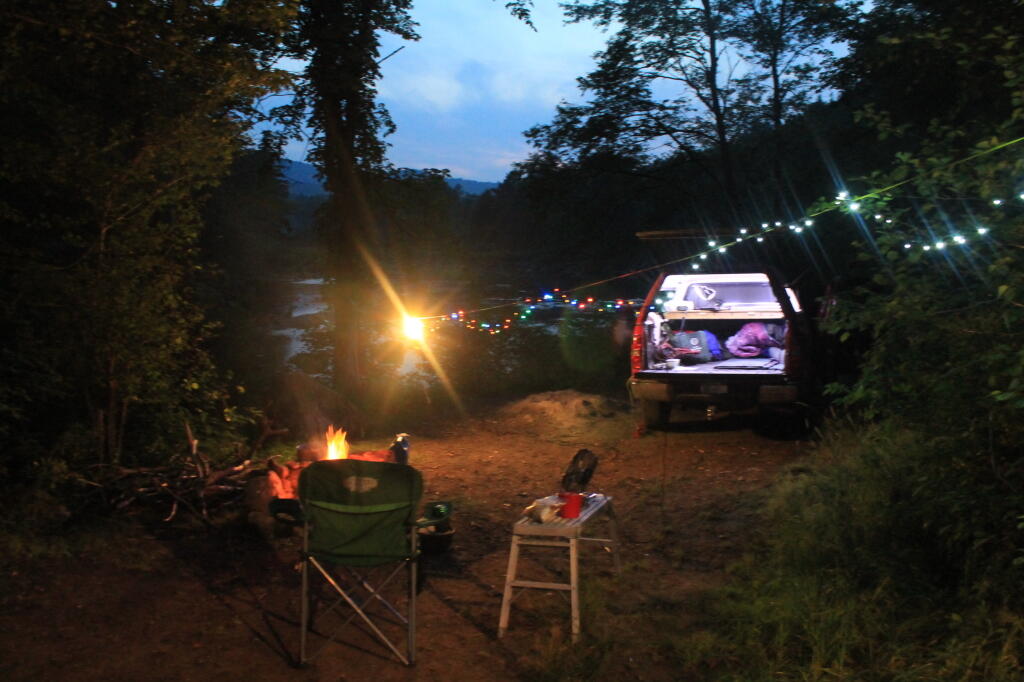
My dual battery setup works decently on my Silverado pickup truck for producing camp power for use under the truck cap. For the first night at camp, it provides more then enough power at night, including lots of lights, alarm clock, and moderate use of a portable fan, and 90 watt laptop charger.
After the first night, the deep cycle battery starts to wear down. The inverter will show lower and lower voltage, until it starts beeping every 15 seconds, and eventually shuts off at around 11 volts, to protect the battery. Yet, it can be continued to be run, all you have to do is turn on the engine, and let the truck run at idle speed for like 10 minutes, every 1-4 hours, depending on how heavy your electrical load is. I used an average of 1/3 gallon of fuel for every night after the first night parked, without driving.
As the battery is isolated from the starting battery, running the deep cycle down to the point where the inverter shuts it off is not a big deal. Your starting battery is still fully charged, and the deep cycle will after all get recharged as soon as truck restarts, and the inverter prevents you from going below 10.9-11 volts, a point where damage can occur, even with a good deep cycle.
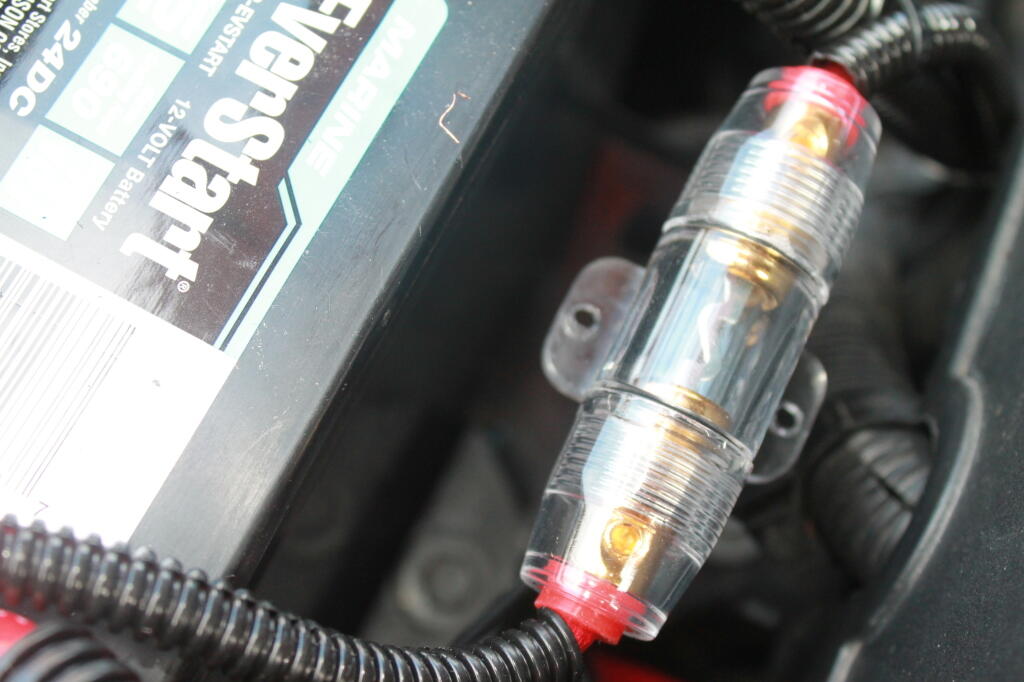
For most moderate lighting demands — let’s say 75-100 watts — enough to run a couple 26 watt florecents, your pretty close to the 4 hours. But when you start adding a laptop charger or fan, and after the third day without the truck moving, you start to drop things down closer to once an hour. Reducing the load when charging, also helps the truck charge faster, as does swapping out the 60 amp fuse between the batteries with a 100 amp fuse, to send any excess amperage to the deep cycle as fast as possible.
The system originally came with a 80 amp fuse, but I cracked that fuse, when I was re-tightening the connections on fuse holders. Apparently, the fuse holder between the deep cycle battery and the starting battery was loose, and on the bumps of dirt roads would become disconnected. While ultimately, I fixed it by retightening the connections, I ended up breaking the 80 amp fuse, and could only get a 60 amp fuse locally. I plan to buy a 100 amp fuse over the internet at some point.
I rarely stay in the same campsite more then one night, at least without driving somewheres in the truck. Even relatively short periods of charging the battery at above idle speed, e.g. driving rapidly increases the rate of charge. It does however use much more fuel to drive the truck then staying idled.
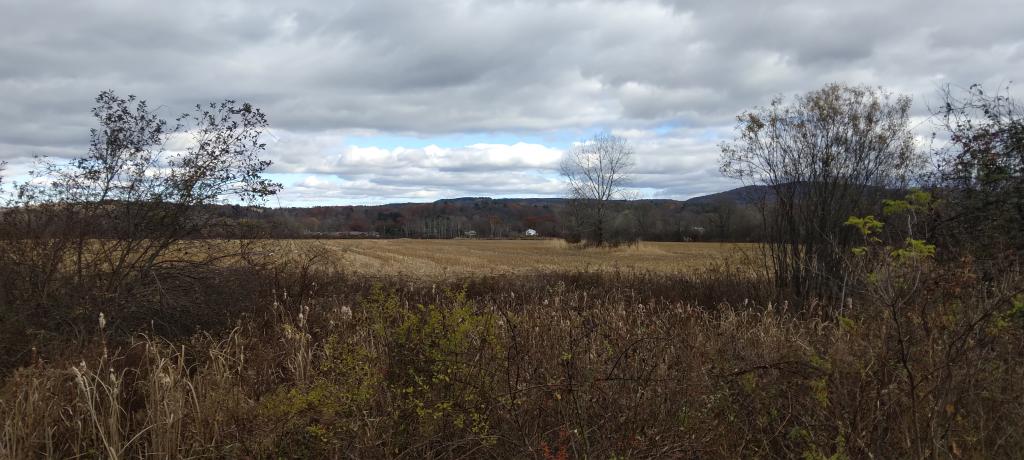
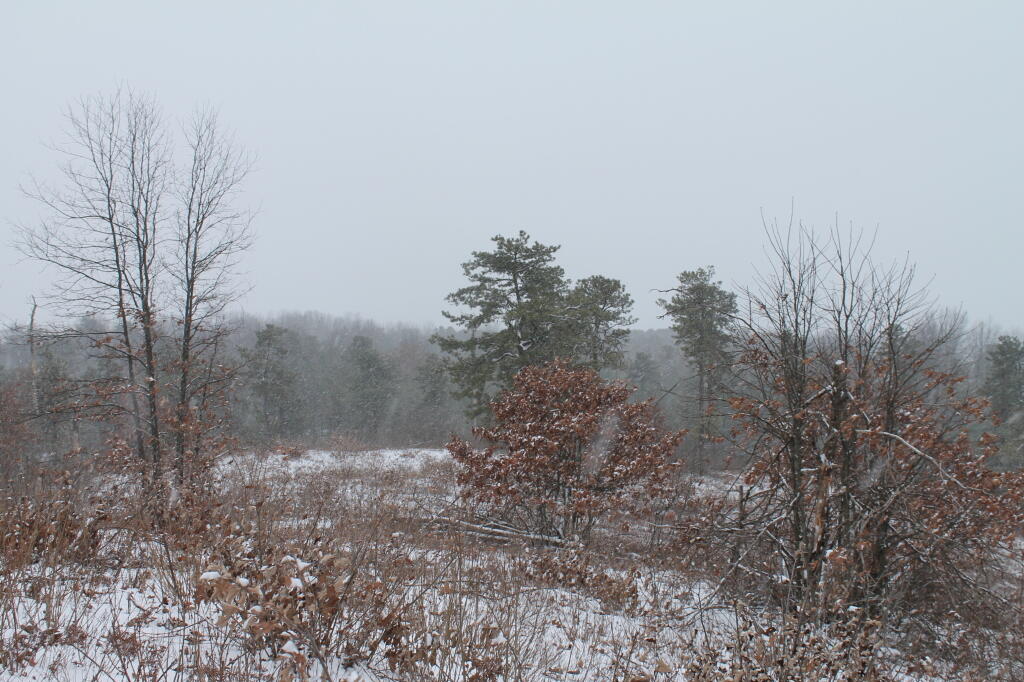
I have a Love-Hate Relationship with the Albany Pine Bush. It is an …
urban unique
wildlife preserve
The Albany Pine Bush’s strengths are are ..
It is conviently located near the city of Albany, you can take either take a bus and walk to get there, or drive a short distance from the city
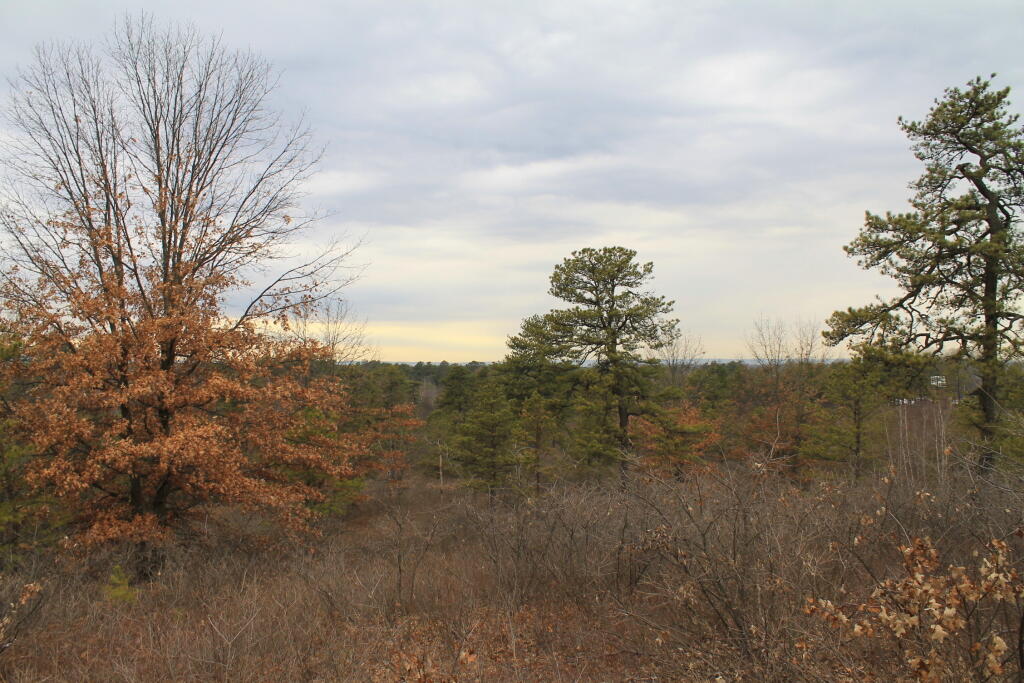
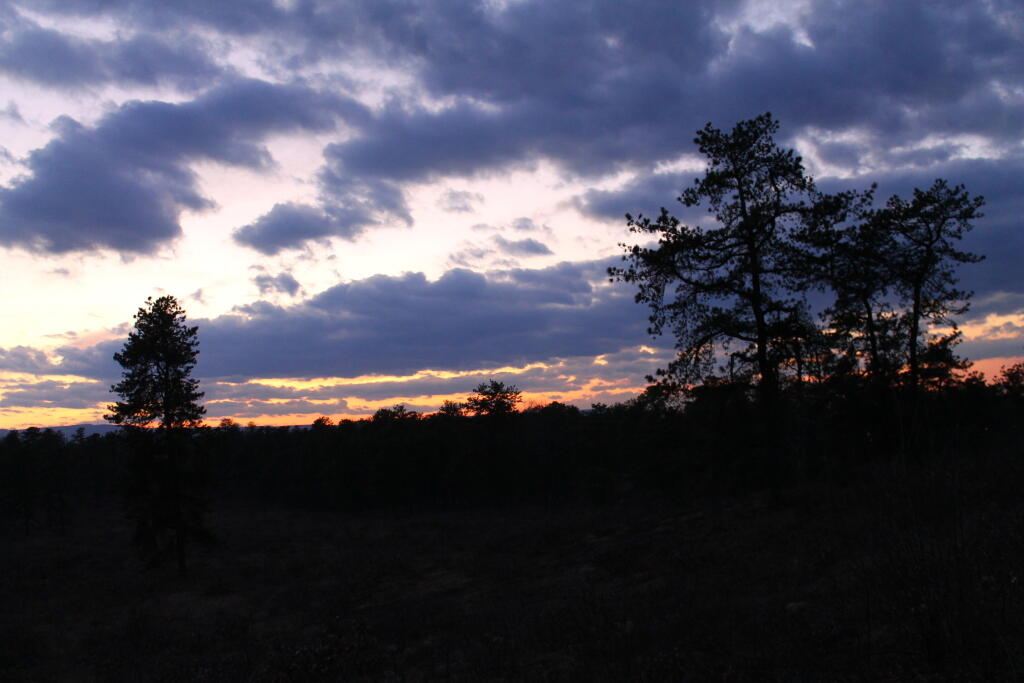
It is a fascinating Pine Bush/sand-dune ecosystem, with fantastic views of the Heldebergs and Catskills and wildlife close to the city.
At the same time those strengths are it’s greatest weakness …
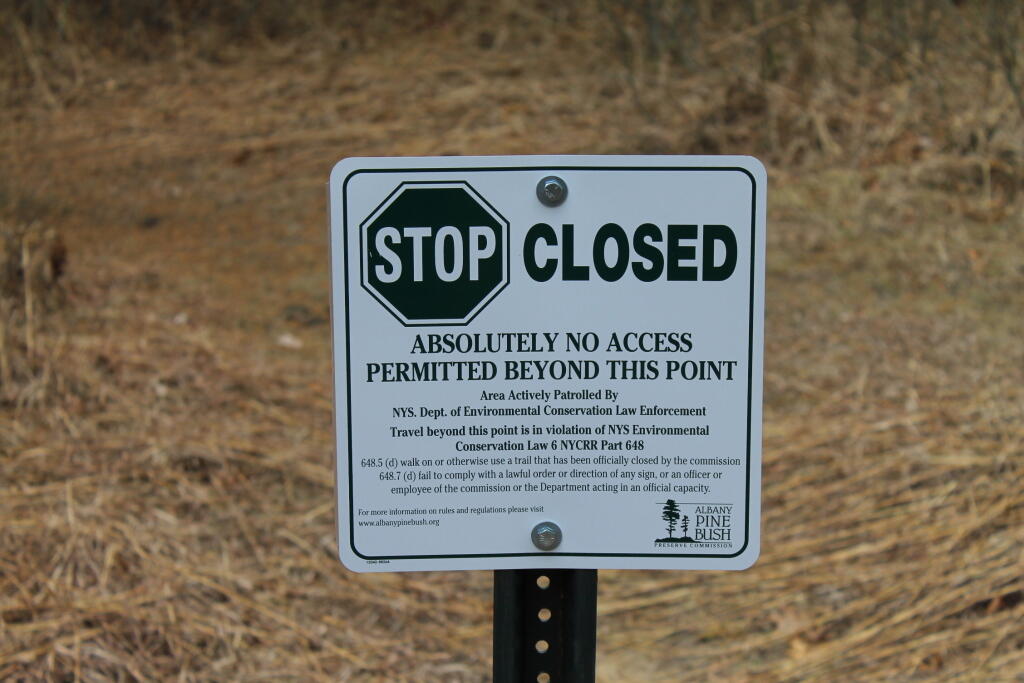
In many ways the preserve is over-regulated and over-governed by the overbearing Albany Pine Bush Commission
The Madison Avenue and Karner East Barriens are overused, dominated by joggers and those walking dogs
There are too many restrictions on hunting, camping, and even hiking and nature observation — such as a ban on traveling off of trails except in the taking of wildlife.
The Adirondack Forest Preserve model might not work in Albany Pine Bush Preserve, but a hybrid model could work. The Commission should try to work more with the public’s desires and demands, and have friendly processes and policies that show that they are there to work with the public rather then restrict access.
Urban preserves are a tricky balancing act. It means easy access to yahoos and those who don’t know basic respect. There are far greater human demands compared to relatively unknown state forests, far off the beaten track.
A while back I wrote I script for converting and styling KML files from ERSI Shapefiles, like you might download or export form a program like Quantum GIS. It requires you have the web programming language PHP 5 installed, along with the ogr2ogr command.
This program extensively uses the PHP/DOM model, to read and write the XML file. I am not an expert programmer — it’s a hobby, but I am very happy with the results. You might consider using the LATFOR data and Census TIGER/Line for this if your a New York State resident.
#!/usr/bin/php -q
<?php
// POLITICAL STYLING FOR KML
// Converts a Shapefile with Election Results in Percentage
//
// Input:
//      File_Title = Title for KML Name Field (as Seen in Google Maps)
//      District_Name = Field with District Name In It
//      Percent_as_Decimal = Election Result with Percent.
//      0.00 - 0.49 = Shade of Red
//      0.50 = White
//      0.50 - 1.00 = Blue
//      Shapefile_Name = Path to Shapefile
//
// Output:
//      Google Maps KML File, Nicely Styled

if (!isset($argv[4])) {
        echo "usage: php politicalKML.php [File_Title] [District_Name] [Percent_as_Decimal]  [Shapefile_Name]\n";
        exit;
}

// required fields
$fileTitle = $argv[1];
$nameField = $argv[2];
$percentField = $argv[3];

// filename
$filename = $argv[4];
$KMLfileName = substr($filename,0,-4).'.kml';

// convert shapefile to kml using ogr2ogr
system("ogr2ogr -f \"KML\" -sql \"SELECT * FROM ". substr($filename,0,-4)." ORDER BY $fileTitle ASC\" $KMLfileName $filename -dsco NameField=$nameField -dsco DescriptionField=$percentField");

// load our new kml file
$doc = new DOMDocument();
$doc->load($KMLfileName);

// first let's replace the name field with a nicer one
$oldnode = $doc->getElementsByTagName('name')->item(0);
$node = $doc->createElement('name', $fileTitle);
$doc->getElementsByTagName('Folder')->item(0)->replaceChild($node, $oldnode);

// delete schema field to save space
$oldnode = $doc->getElementsByTagName('Schema')->item(0);
$doc->getElementsByTagName('Folder')->item(0)->removeChild($oldnode);


// load each placemark, search for maximum — used for making color judgements
foreach ($doc->getElementsByTagName('SimpleData') as $data) {
        if( $data->getAttribute('name') == $percentField) {
                $max[] = abs(substr($data->nodeValue,0)-0.5);
        }
}

// maximum in the political race
sort($max); $max = array_pop($max);

// calcuate multiplier for each race
$multiple = 255/$max;

// load each placemark, then set styling and percentage description
foreach ($doc->getElementsByTagName('Placemark') as $placemark) {
        foreach ($placemark->getElementsByTagName('SimpleData') as $data) {
                if( $data->getAttribute('name') == $percentField) {
                        $value = $data->nodeValue;
                        $color = substr($value,0);
                }
        }

        // decide if we want to do this blue or red, and then calculate
        // the amount of color versus white

        // republican leaning
        if ($color <= 0.5) {
                $colorStr = sprintf('%02x', 255-floor(abs($color-0.5)*$multiple));
                $colorStr = "a0{$colorStr}{$colorStr}ff";
        }

        // democratic leaning
        if ($color > 0.5) {
                $colorStr = sprintf('%02x', 255-floor(abs($color-0.5)*$multiple));
                $colorStr = "a0ff{$colorStr}{$colorStr}";
        }

        if ($color == 0) {
                $colorStr = '00ffffff';
        }

        // stylize the node based on color
        $node = $doc->createElement('Style');

        $linestyle = $doc->createElement('LineStyle');
        $node->appendChild($linestyle);
        $linestyle->appendChild($doc->createElement('width', 0.1));
        $linestyle->appendChild($doc->createElement('color', 'ffffffff'));

        $polystyle = $doc->createElement('PolyStyle');
        $node->appendChild($polystyle);
        $polystyle->appendChild($doc->createElement('color', $colorStr));

        $oldnode = $placemark->getElementsByTagName('Style')->item(0);

        $placemark->replaceChild($node, $oldnode);

        // delete extended data to save KML space
        $data = $placemark->getElementsByTagName('ExtendedData')->item(0);
        $placemark->removeChild($data);

        // update the description
        $oldnode = $placemark->getElementsByTagName('description')->item(0);
        $node = $doc->createElement('description', 'Recieved '.($color*100).'% of the vote.');
        $placemark->replaceChild($node, $oldnode);
}

// finally write to the file
$doc->save($KMLfileName);

// calculate size in MB
$filesize = filesize($KMLfileName)/1024/1024;
if ( $filesize < 10) {
        $zipCommand = "zip ".substr($KMLfileName,0,-4).".kmz $KMLfileName";
        system($zipCommand);

        $kmzfilesize = filesize(substr($KMLfileName,0,-4).".kmz")/1024/1024;
        echo "KMZ is " .sprintf('%01.2f', $kmzfilesize)." MB, while the KML file is ".sprintf('%01.2f',$filesize)." MB.\n";
}
else {
        echo "Woah Horsey! The produced file is greater then 10 MB, at a size of ".sprintf('%01.2f',$filesize)." MB uncompressed. You need to simply your polygons before proceeding, otherwise Google Maps won't be able to read it. \n";
}

>
I often prefer to use Net Votes per Election District, as this more clearly shows were a person lost and won the race, because Turn out can very quite widely from Election District to Election District. Moreover, some Election Districts are more populus then others.
Turn out was particularly high in districts that Sandy lost, particularly in Westerlo ED 3 (Dormansville), one of most conservative EDs in Albany County currently.
This map shows the Average Democratic Preformance of Statewide candidates by 2010 Voting Tabulation District, with the 2011 County Leg districts superimposed. Be aware that all statewide Democratic candidates preformed quite well across 2010 Albany County,but it also shows the weakness in Dormansville (Westerlo ED 3), and Cooksburg-Preston Hollow-Potters Hollow (Rensselearville ED 2). The entire district was and is marginal Democratic, and can easily swing into the Republican column.
.
While Sandy Gordon got a higher percentage of votes on Democratic line then Debra Bush on the Republican line, the heavy Conservative-block vote in Renselearville EDs and South Westerlo (ED 1) provided a margin of victory for Debra Bush.
Sandy Gordon lost 2/3rds of Knox in the redistricting. He preformed worst in the new portion of the district — specifically Westerlo — and failed to hold onto Renselearville.
While he faced a Tea-Party Movement in Renselearville that organized against him, if he had spent more time going door-to-door in this portion of district, along with introducing himself to Westerlo voters, he may have been able to hold on to his seat.
Regardless, it was tough year for Democratic Incumbents, especially those with a long record and many difficult votes to face, such as over-riding the tax-cap, which will hurt rural residents and those of the hilltowns who own a lot of land hardest.