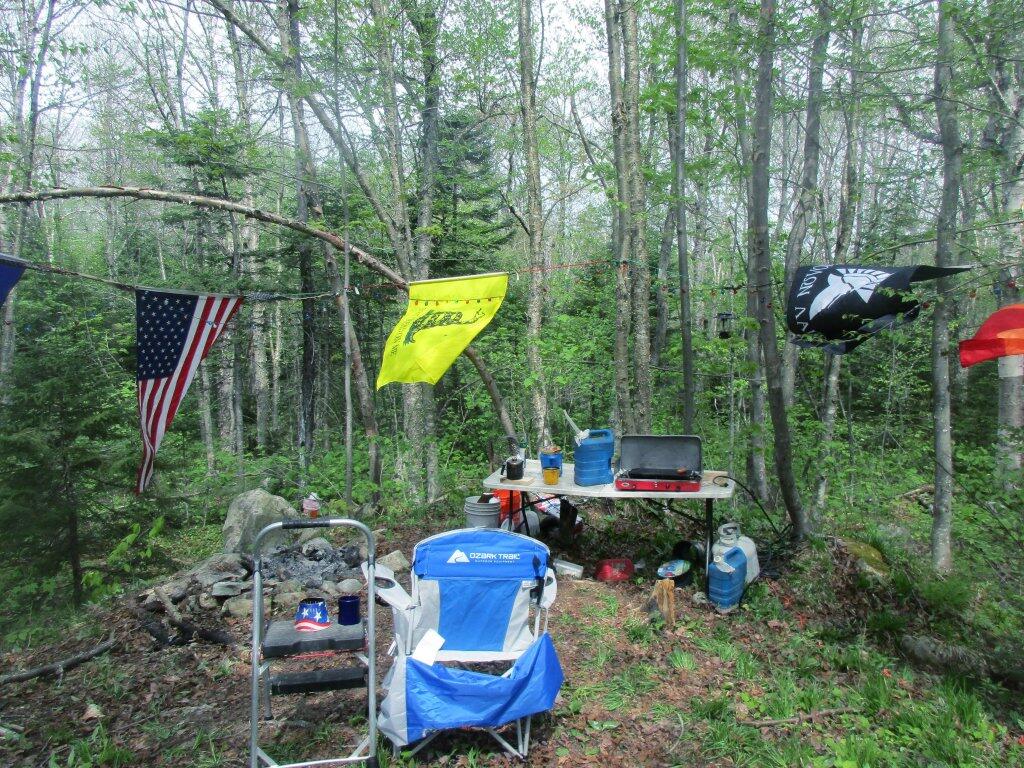
I have written many times in the past on how much I dislike State Parks and State Campgrounds. I dislike the high degree of enforcement, the rules and regulations, and the number of people that are crowded into a small area. I much prefer to be alone and make my own rules, limited only by a basic respect for the natural world around me.
I have never viewed wilderness as a fixed or pure landscape. There is no pure wilderness for me, no set of clear definations, except for the need to be fairly remote, fairly private, fairly free from the big government enforcement precence. Certainly, a scenic view is nice, and quiet from passing traffic is great, but it’s not everything.
Liberty should be the primary goal in wilderness. Wilderness is a place with the fewest regulations and rules possible, the farthest place possible from an enforcement precence. I just like to be myself, spend time in the woods, observing nature, and doing things on my own pace, without the regulations or control of the government.
2010 Statewide Elections in Maps A look back at the last election cycle and how things played out.
Here is a map of the Average Democratic Preformance for all Statewide Candidates in 2010.
Here is the Gubernatorial Race. Notice how Andrew Cuomo won most rural and urban communities, with the exception of the most conservative towns in the Southern Adirondacks, Catskill Mountains, and also Western NY, where hometown favorite Carl Paladino snapped up many votes.
In Competitive State Senate Elections (which there many in 2010), Democrats won over many small towns in Upstate New York. That said, the votes that Democrats won, often where not enough to offset the more populated areas where Republicans won. Votes on third party lines (not included) also helped win Republicans over in certain districts.
The same can be said with the State Assembly. Despite winning far fewer towns, they kept a strong majority, in part thanks to their strong New York City base, and fushion candidates, running on multiple lines not shown on this map.
It’s interesting to map the median age of New Yorkers by Census Blocks. While certain census blocks show a median age that is noticeably younger then some, e.g. juvenile institutions and colleges, a broader trend can be seen in Catskill and Adirondack Parks — residents there tend to be older.
Looking at this map, one can conclude residents of the Southern Tier, Tug Hill Regions, and North Country tend to be younger compared other portions of state, while in surburban areas people tend to be somewhat younger. Cities tend to have youngest populations, especially in neighborhoods touched by poverty and blight.
Despite what you might think, residents of Mohawk Valley are not particularly older then the rest of state. If anything, they are slightly younger. The idea that all of the young people are moving away from the Mohawk Valley isn’t supported by data, or at least new young people are coming back to replace the lost people.
I have in the past made maps up of New York State’s population, divided by population density or actual population per municipality. I almost always have to distort that maps for Upstate to show any detail, because of the extreme population concentration downstate, specifically in New York City.
Simply said, there is nothing in Upstate New York at all like downstate. There simply are not the concentrations of people or dense urban core. Our Upstate cities are dense compared to the surrounding countryside — often as much as 100 times more dense (e.g. 100 times more people per mile), but Manhattan is 9 times more dense then even our most dense upstate cities.
New York is truly a metropolitian area, unlike any other in New York State, and like few in America. I welds immense power not just over itself but the more rural parts upstate, and the surrounding countryside that seems — at least to the city folk — so unimportant compared to their extremely dense and complicated living arrangements.
If you ask many people today, the assumption would be almost everybody has a Bachelors Degree, if not more education then that. Yet, except in the most suburban (and wealthy) portions of state, Bachelors Degrees are relatively uncommon — often held by fewer then 1 in 10 people over 25 years of age.
It turns out there is a close connection between suburban lifestyles and having a bachelors degree. Zoomed into closer into a map of the Capital District, you will note how closely link suburbanization is to number of people with a bachelors degree.
That said, obtaining that Bachelors Degree might be worth your while — if you avoid college debts, and land a good job after college. Indeed, the wealthiest portions of state tend to have the highest percentage of those with Bachelors Degree, e.g. the suburbs.
It’s probably wrong to assume one is wealthy or well off with a Bachelors Degree, or that all rural folks are backwards hicks leaving in poverty. It’s more that the more affluent (in money terms) suburban life tends to require more schooling then more rural or urban occupations.
It takes the NY State Department of Labor a long time to produce data on the Unemployment Rate. It usually is not released until the middle of the month proceeding month, so the data for September, was not released until around October 20th. The NYS DOL breaks unemployment data down by county, which is relatively easy to merge with Census TIGER Shapefiles, and produce some nice maps. Which is what I did.
Here is the NY State Unemployment Rate by County.
Notice how Rural Western NY has some of the lowest unemployment in the state, though the rate in Saratoga County, along with NY City suburbs of Putnam, Rockland, and Westchester Counties shows the economy is relatively strong in that portion of state too.
Unemployment tends to peak in the Southern Tier and also in the counties impacted by Hurricane Irene that month, e.g. those of the Catskills and the Central-Leatherstocking Region of state.
Here is the Change in NY State Unemployment Rate from September 2010 to 2011.
Notice how Western NY is creating jobs while the economy is stagnant or losing jobs in the regions impacted by Hurricane Irene. Those Hurricane-related job losses may be temporary, and not reflected in the October numbers, but they do suggest that there is a lot of growth occurring in Western NY, not occurring in the Eastern portion of state.
Also, note the weak economy in the Tug Hill Plateau region between 2010 and 2011. Unemployment has increased in Jefferson and Lewis County during that time period, while remaining stagnant in Oneida County. Definitely not good news in that rural part of state.
I probably will do a new series of maps come the release of the October numbers later in the month.
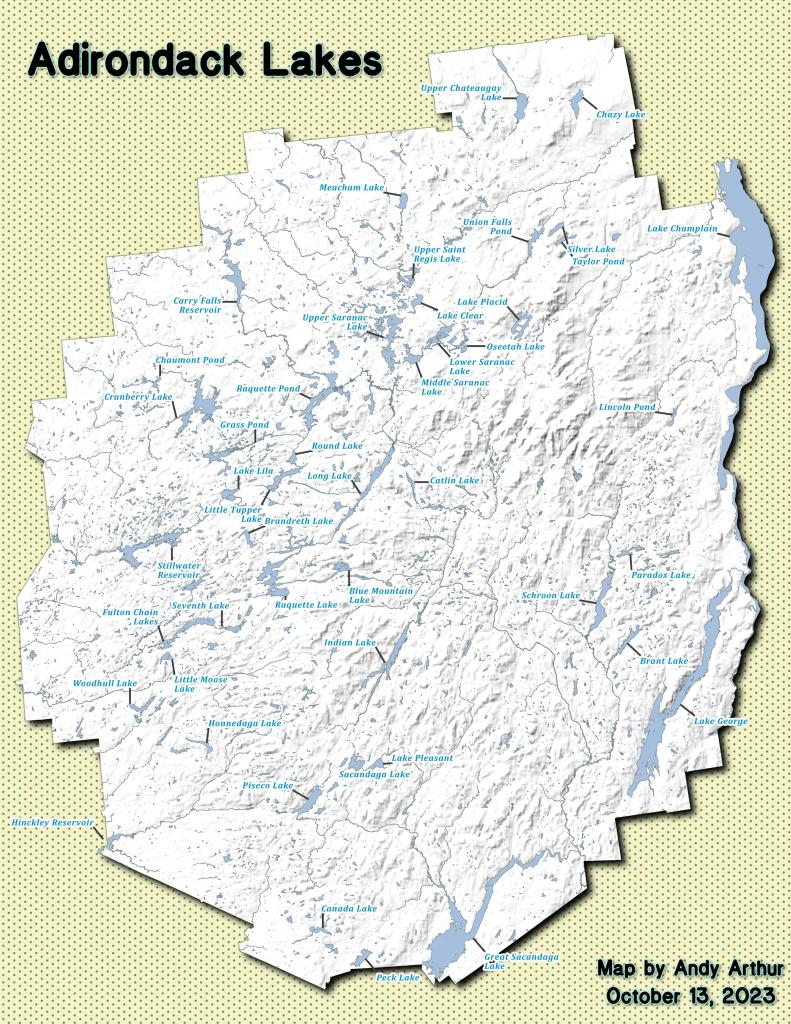
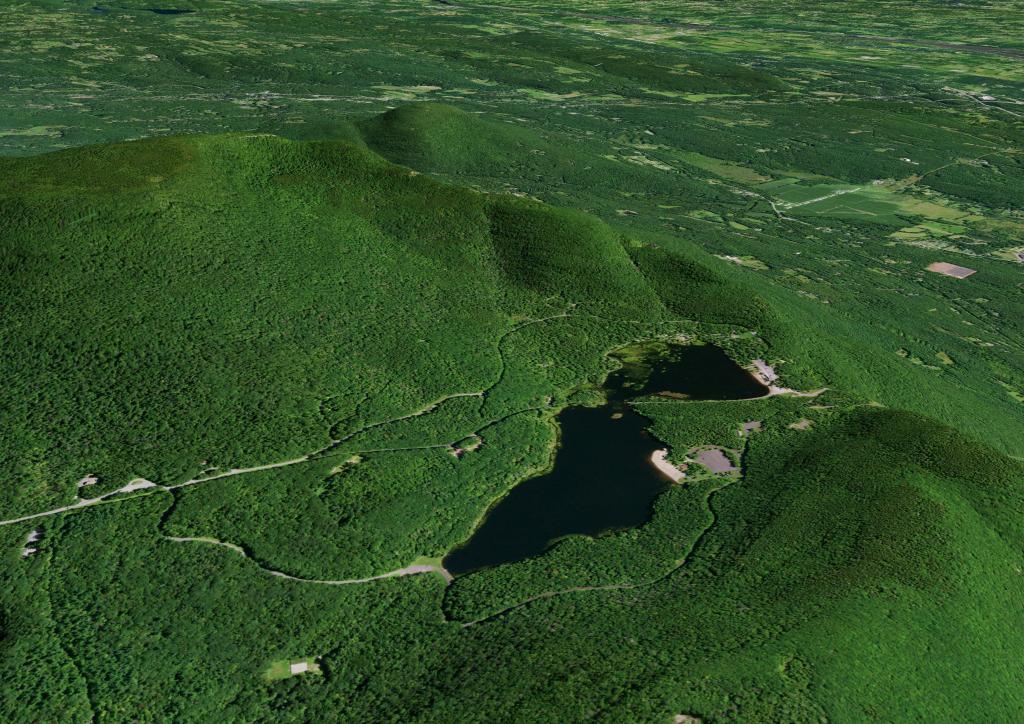
This past year, I got up to nine different Adirondack Wild Forests as part of my explorations of the Adirondack Park. Did a lot of hiking, kayaking, and camping. The map below shows the Adirondack Park’s various units.
I camped in Aldrich Pond (1 night), Black River (4), Debar Mountain (3), Ferris Lake (5), Independence River (2), Moose River Plains (3), Taylor Pond (2), Vandwhacker Mountain (1), and Wilcox Lake (4). My preference for certain Wild Forests over others, is not just based on scenic beauty or activities to do, as much as closeness to Albany and compatability with weekend plans.
I saw quite a bit of Adirondack Park for sure.
Aldrich Pond (1 night)
Camped one night on Streeter Lake Road in Aldrich Pond Wild Forest near the hamlet of Oswagatchie. Paddled part of Little River and Streeter Lake.
Black River (4 nights)
Camped two nights at Wolf Lake Landing Road. Paddled around Woodhull Lake, hiked over to Remsen Falls.
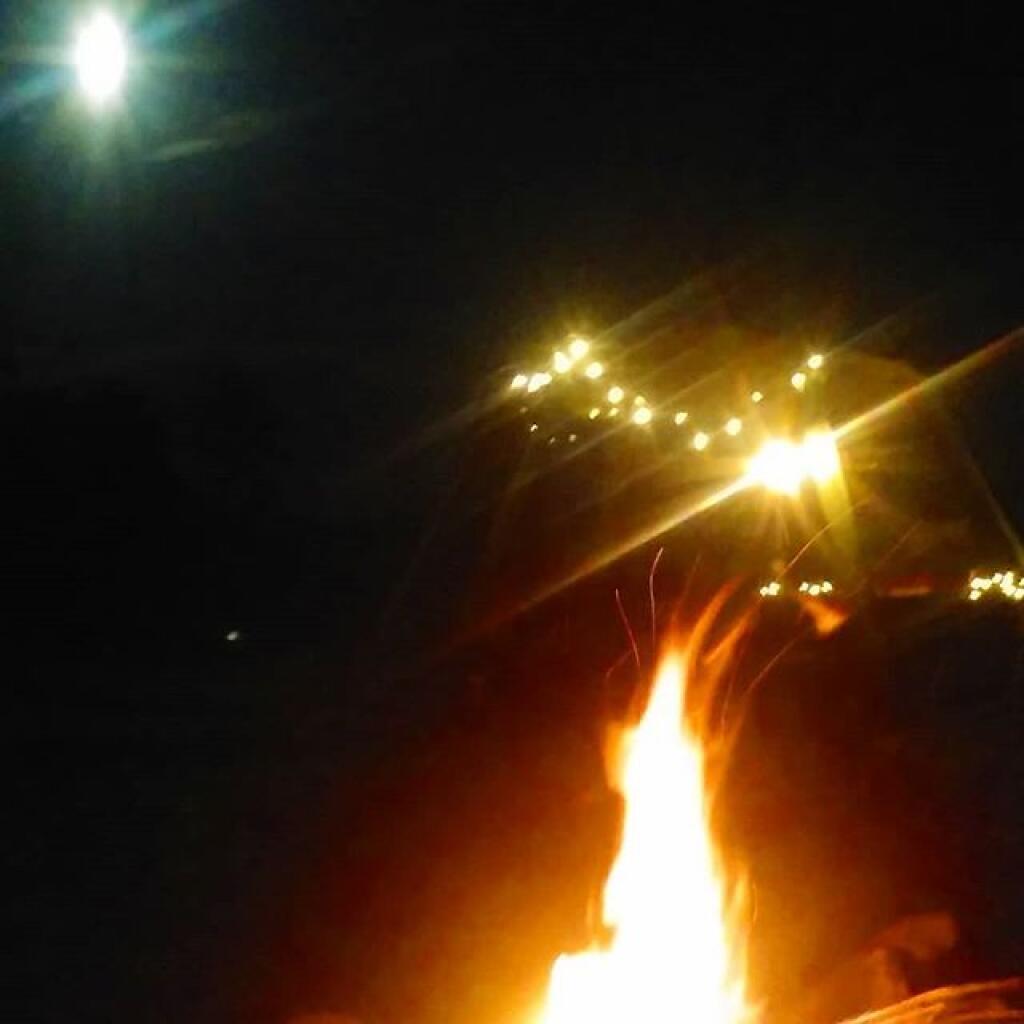
Camped two nights at North Lake. Sat down by the lake, enjoyed the moonlight. Explored Atwell and part of South Lake.
Debar Mountain (3 nights)
I camped for two nights at Mountain Pond near Paul Smiths, NY, while visiting the Saint Regis Canoe Area.
Then coming back from North Country, I decided to spend a night at Jones Pond, which is between Rainbow Lake and Paul Smiths.
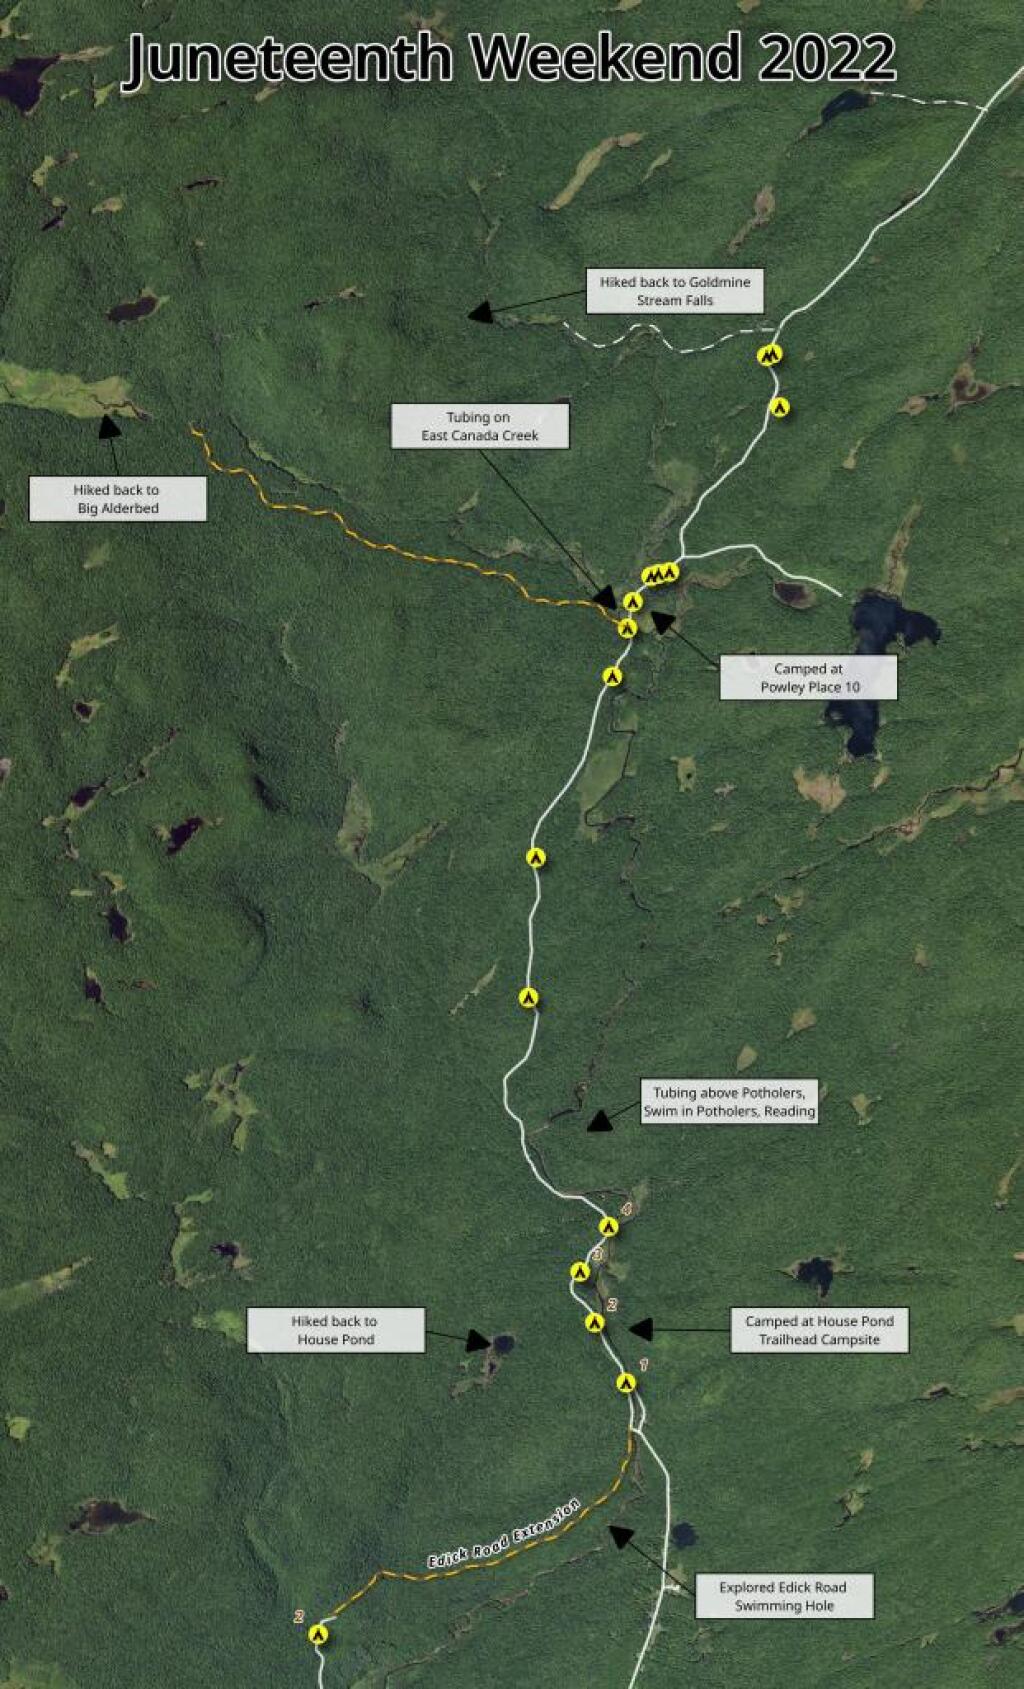
Ferris Lake (5 nights)
I did two weekend trips up to Ferris Lake Wild Forest. The first was during Memorial Day Weekend, which was pretty wet and rainy for most of the weekend. The second was during the mid-summer on a super oppressive, hot and humid day out. While I explored Edick Roadside Camping, and also Good Luck Lake, both times I roadside camped on Piseco-Powley Road, three nights at PR 9, one night at PR 4, and one night at 11.
Independence River (2 nights)
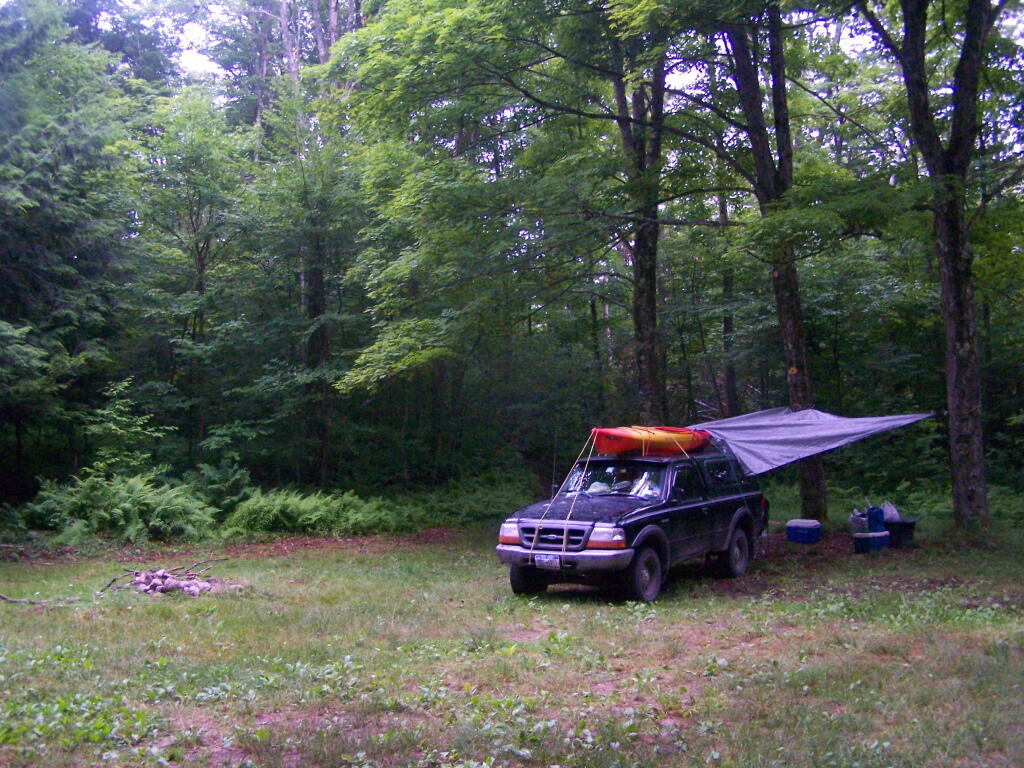
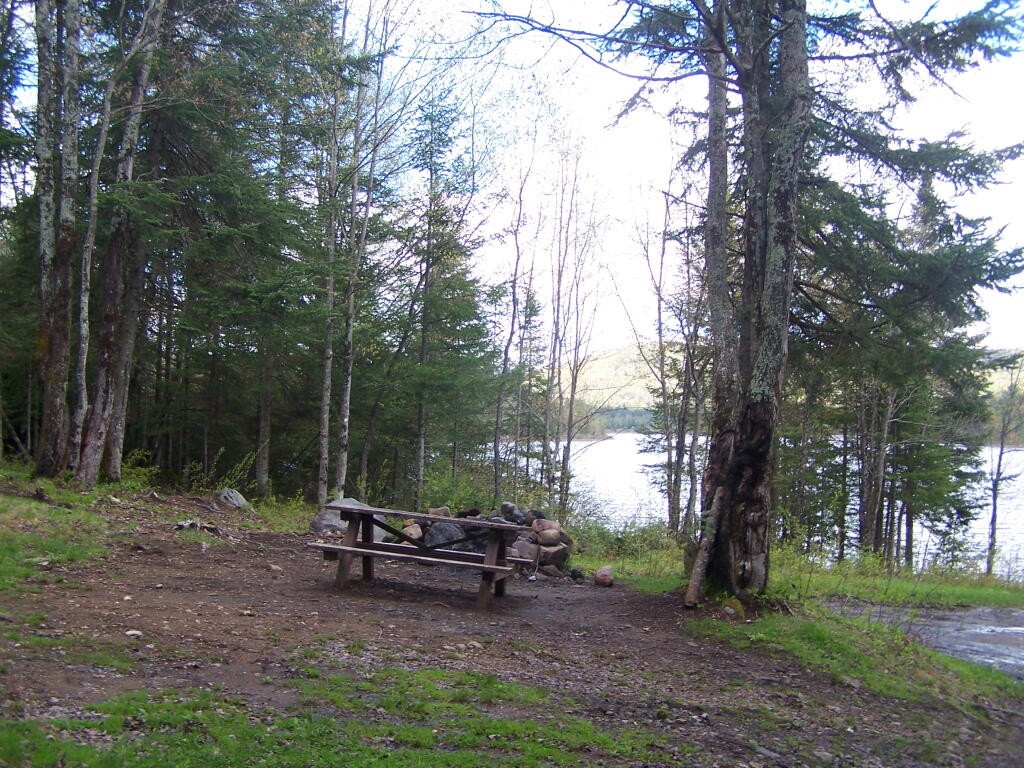
Camped two nights at Independence River Wild Forest on Smith Road, at field Campsite 1. There are ten campsites on this road, including one with an outhouse. Several of them are located in old logging load pads, that are now mowed as fields for camping. Nothing particularly fancy here.
Moose River Plains (3 nights)
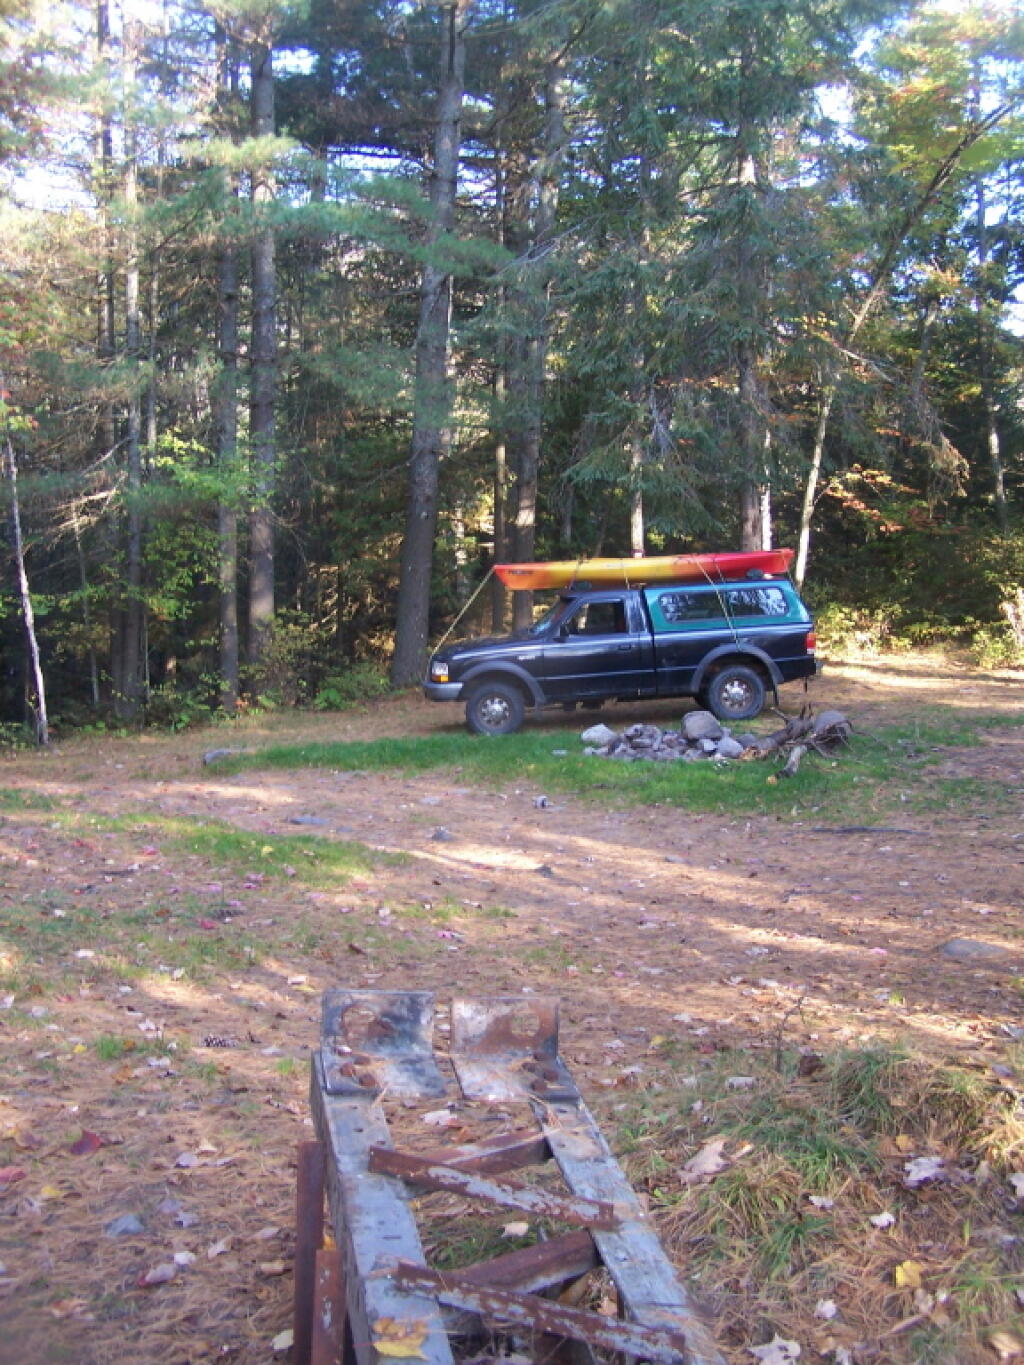
Planned to spend a week at Moose River Plains, brakes failed on third day up there. Still got three days of fall camping in along Cedar River – Limekiln Lake Road. Camped one night at Campsite 24, and two at Campsite 57 this year.
Taylor Pond (2 nights)
Camped up at Union Falls for two nights in the fall, while hiking and exploring several locations in Clinton County and eastern portion of the North Country.
Vandwhacker Mountain (1 nights)
Camped one night at Cheney Pond at the Vanderwhacker Wild Forest.
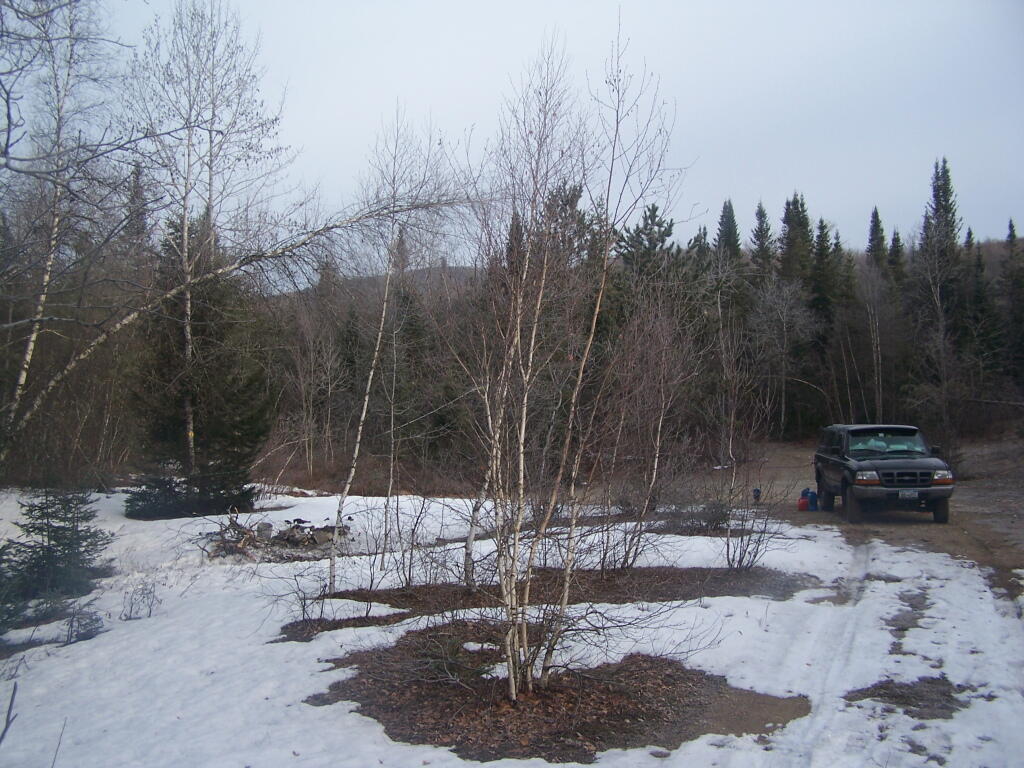
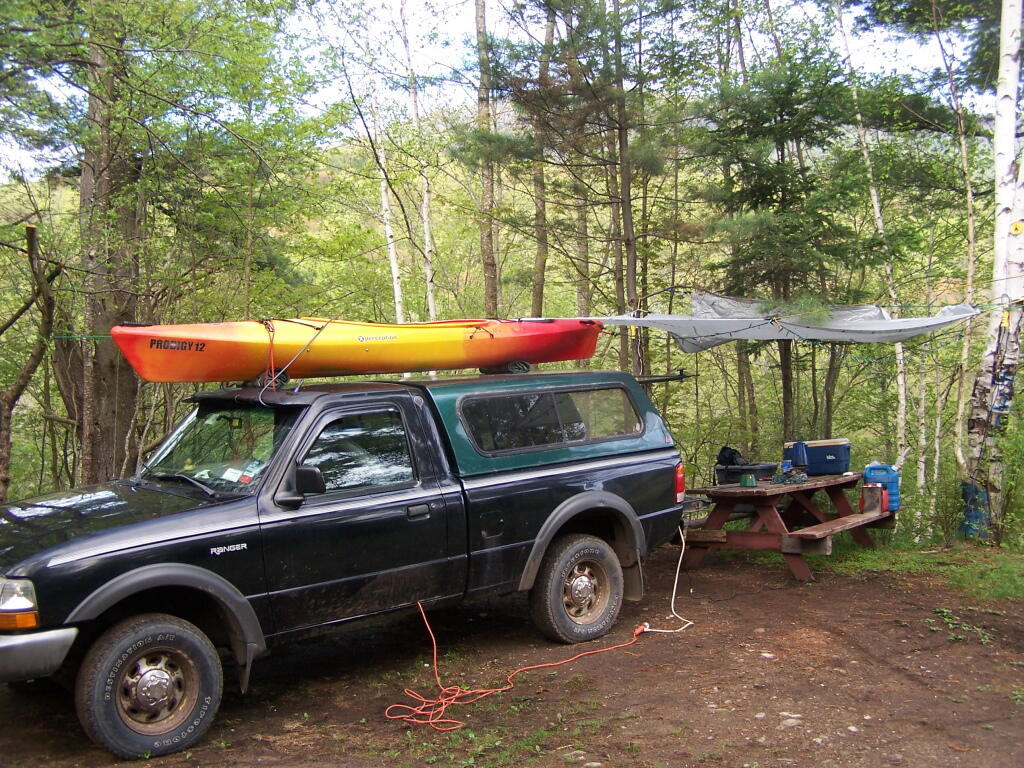
Wilcox Lake (4 nights)
Camped three nights up off of NY 8 — one at an old Gravel Pit along the East Sacandaga River in April when the snow was still there, two nights at Fox Lair Campsite, and one night at Hope Falls Road, which is off of NY 30, near Northville.