Census Block Equivalency – A list of census blocks in each district, generated by the commerical GIS program (such as Mapitude) used for redistricting.
Metes and Bounds – A legal description of each district, used in resolving court disputes over district boundaries, and assisting board of elections on where to put voters whose property might be crossed by a Census block
If you planning on making a map, Metes and Bounds won’t be particularly useful. Computers don’t understand english very well, they need numbers and lists. In contrast, the Census Block Equivalency is very useful for mapping things.
Every year, the Census Bureau puts out series of ERSI Shapefiles known as TIGER/Line. You can download TIGER/Line for any state and county in the United States from their website. They provide many different shapefiles and layers such as a Highway, Faces, Edges, and County Subdivision layers, however the one you will be most interested for making district maps is the Tabulation Block (tabblock) layer.
You can use these files in the free program known as Quantum GIS or QGIS. While this tutorial will not explain the ins and outs of QGIS, this should get you started on making redistricting maps.
The Tabulation Block Layer is the file containing all of the Census Blocks for a particular county. A Census Block is the smallest unit of population gathered by Census Block, and consists of all bordering features (bounds) — roads, rivers, shorelines, along with all imaginary lines (metes) — town lines, village lines, other lines drawn for statisitical purposes.
Each Census Block has a number, that is a subdivision of the Census Block, County ID, and State ID that it resides within. For example, the Governor’s Mansion in Albany is located in Census Block 2000 in Census Track 23.00 (zero padded to 002300) in Albany County (Federal Information Processing Standard — FIPS ID: 01) which is in NY State (FIPS ID: 36). County subdivisions are not applied to Census Tract Numbers, as they may in some cases cross county subdivisions, as is the case of smaller districts.
You put those numbers together to get the GEOID — which is the key used for redistricting block lists and most other block-level census data. The Governor’s Mansion is located at a block with a GEOID 360010023002000.
36
001
002300
2000
State ID
County ID
Zero Padded Census Tract Number
Census Block Number
The block list you get from a redistricting commission typically is in Database Exchange Format (.DBF) or Comma Deliminated Format (.CSV) which are both openable by common spreadsheet applications like Microsoft Excel or OpenOffice Spreadsheet and GIS programs like ArcGIS or Quantum GIS.
This is taken from the LATFOR State Senate Proposed Districts (January 2012) DBF file. It shows you that the Governor resides in Proposed Senate District 44. Across the river in Census Block 4010, Census Tract 524.03, in Rensselear County (FIPS ID 83), NY State (FIPS ID: 36) is located in Proposed Senate District 43.
360010023002000
SD44
360010021002008
SD44
360010021002004
SD44
360010021002001
SD44
360830524034017
SD43
360830524034010
SD43
Download the TIGER/line “Tabulation Block” Shpaefile file for the district you are interested in. You will want the 2010 version. You can download a state-wide tabulation block file, however that is not recommended as the next step will be impossibly slow on most computers. You may also want to open the .CSV or .DBF file in your spreadsheet program and cut out the county you want to speed things up.
You will then want to open up the file in Quantum GIS. You will get a nice map of the county you downloaded, showing all of the Census Blocks.
From there, go to the Vector -> Join Attributes submenu.
Make sure that the Target vector layer matches the Tabulation Block Shapefile you wish to join against, then set Target join field to GEOID10 .
Select click Join dbf table and select the DBF or CSV file you wish to join.
Change the Join field to BLOCK or whatever the GEOID is titled in your redistricting block file.
Enter in a location to save the Output Shapefile
Click okay.
Then wait. A typical county will take 10-40 minutes to join on my 5 year old laptop; your computer may be quicker. If you have a dual processor machine, go on to doing other work in other programs. You will end up with a map that looks like this (stylized for your enjoyment). Each block will be assigned a Senate District (in this example).
Halfway there. Now you need to “dissolve” each Census Block into it’s larger political district. Go to Vector -> Geoprocessing Tools -> Dissolve . Set the Input vector layer to the file you previously joined. Then set the Dissolve field to the field containing the district number — such as DISTRICTID or whatever it is named. Enter a name to safe the file. Click Dissolve.
Outputed will be a Shapefile containing all the political districts in the county you joined and dissolved. This will take 5-20 minutes on my laptop. Other data may exist in that file, such as Census Block number, however at this point that data will be invalid, as only the district number is accurately preserved in such a join. All other data will be picked at random, so delete those columns.
I hope this is helpful. If you just want the Proposed State Senate or State Assembly Districts you can download them from Center for Urban Research. These are the same data, joined using the above process by somebody with a much faster computer. I have also made up a Shapefile containing the Albany County Legislative Districts using this process.
All figures are in acres except where noted. Table updated April 2011. Reprinted from the DEC Website.
Land Classification
Region
1
Region
2
Region
3
Region
4
Region
5
Region
6
Region
7
Region
8
Region
9
Catskill
Park Total
Adirondack
Park Total
State
Total
Percent of Total
State Land and
Conservation
Easements
State Forest
16,056
758
31,763
102,248
58,354
221,924
200,419
55,581
99,121
–
16,264 **
786,224
17%
Forest
Preserve
Wilderness
–
–
89,352
53,482
954,601
206,151
–
–
–
142,834
1,160,752
1,303,586
28%
Wild Forest
–
–
75,588
60,368
938,664 **
367,123
–
–
–
135,956
1,305,787
1,441,743
31%
Primitive
–
–
–
–
31,309
15,704
–
–
–
–
47,013
47,013
1%
Primitive Bicycle
Corridor
–
–
15
283
–
–
–
–
–
298
–
298
0.006%
Canoe
–
–
–
–
18,989
–
–
–
–
–
18,989
18,989
0.4%
Intensive Use
–
–
4,104
1,542
21,591
1,828
–
–
–
5,646
23,419
29,065
0.6%
Administrative
–
–
392
0 ***
384
7
–
–
–
392
391
783
0.02%
Historic
–
–
–
–
531
–
–
–
–
–
531
531
0.01%
Pending
Classification
–
–
–
–
259
111
–
–
–
–
370
370
0.007%
Under Water*
(Unclassified)
–
–
–
–
17,395
6,534
–
–
–
–
23,929
23,929
0.5%
Detached
Parcel
–
–
1,382
4,141
1,441
4,318
–
–
–
–
–
11,282
0.2%
Total Forest Preserve
–
–
170,833
119,816
2,001,313
601,776
–
–
–
285,126
2,597,267
2,893,738
61%
Wildlife Management Area
6,007
–
12,021
18,518
6,524 **
46,371
49,562
41,462
17,178
407 ***
2,755 **
197,643
4%
Conservation Easement
108
21
7,264
7,286
488,463
336,783
436
–
10
9,437
769,579
840,371
18%
TOTALS:
22,171
779
221,881
247,868
2,554,654
1,206,854
250,417
97,043
116,309
294,970
3,385,865
4,717,976
100%
Notes from the DEC.
* Certain lake beds are considered Forest Preserve, despite some level of private ownership adjacent to the lakes. These underwater lands are not classified. For the purposes of this table, however, lakes and ponds that are completely surrounded by Forest Preserve have been classified the same as the adjacent land.
** Where State Forests and Wildlife Management Areas exist within the Adirondack Park, the Adirondack Park State Land Master Plan also classifies these lands as Wild Forest. However, since these lands are not Forest Preserve, State Forest and Wildlife Management Area acreages within the Adirondack Park were NOT included in the Wild Forest category.
*** Where Wildlife Management Areas exist within the Catskill Park, the Catskill Park State Land Master Plan also classifies these lands as Administrative. For calculation purposes in this table, however, Wildlife Management Area acreage within the Catskill Park was NOT also included in the Administrative category.
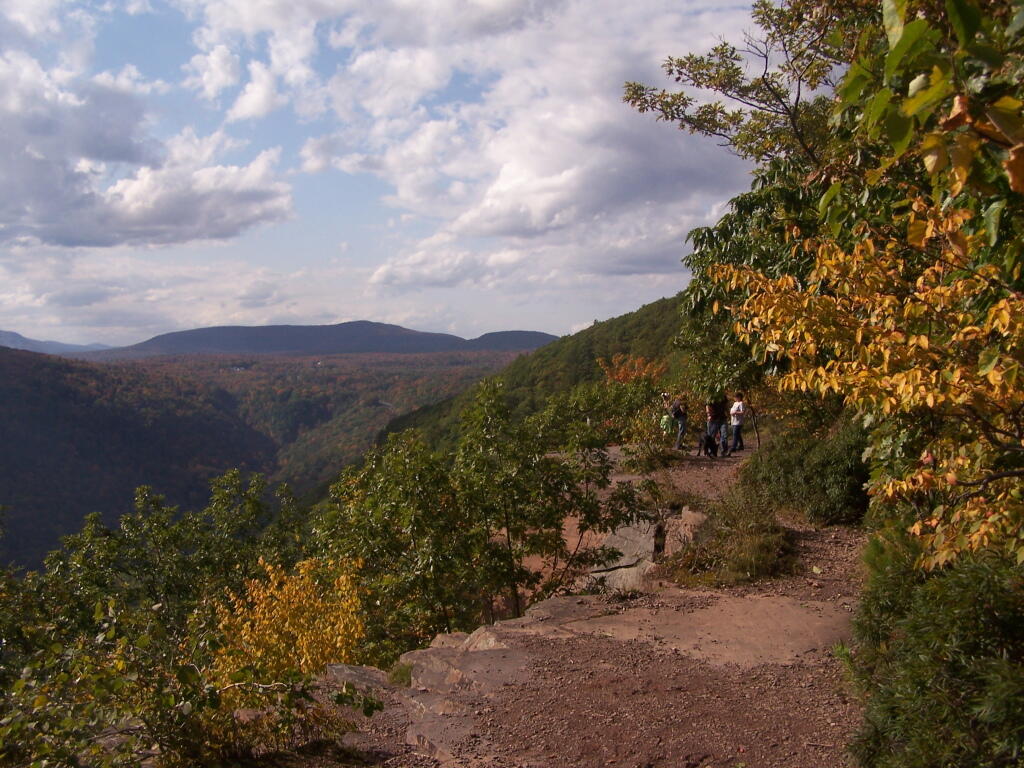
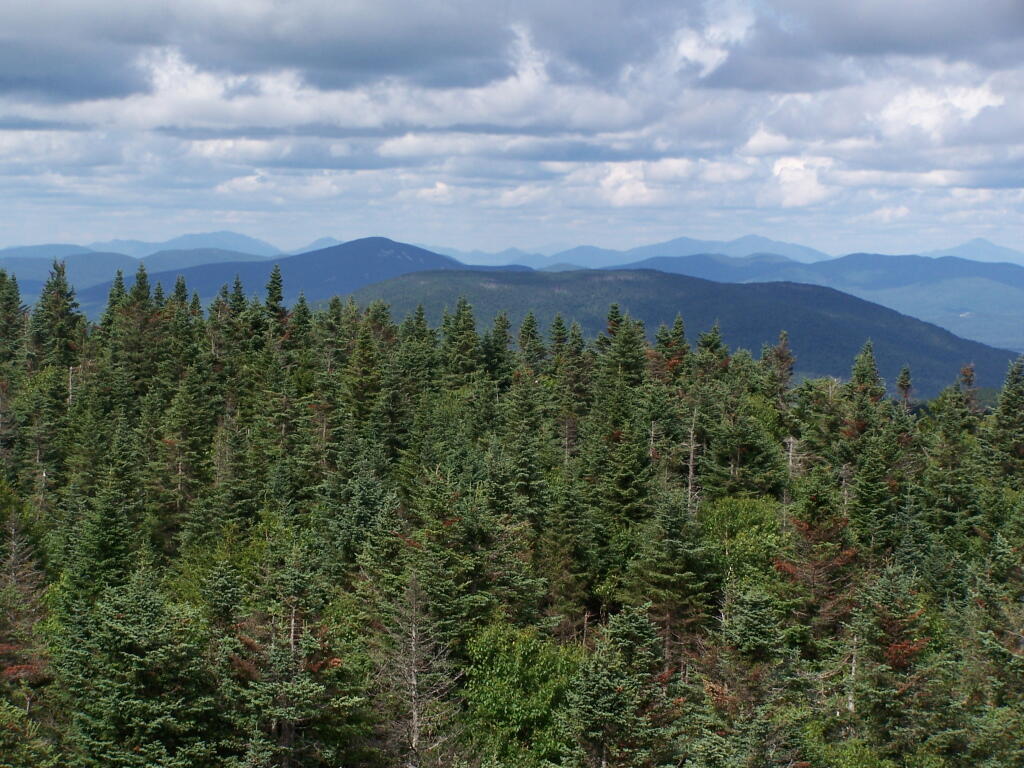
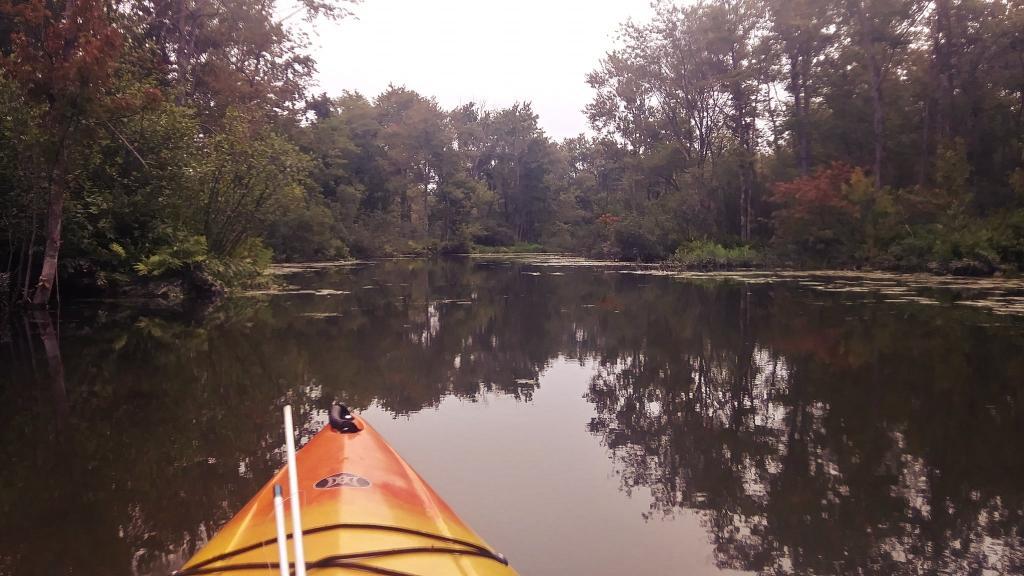
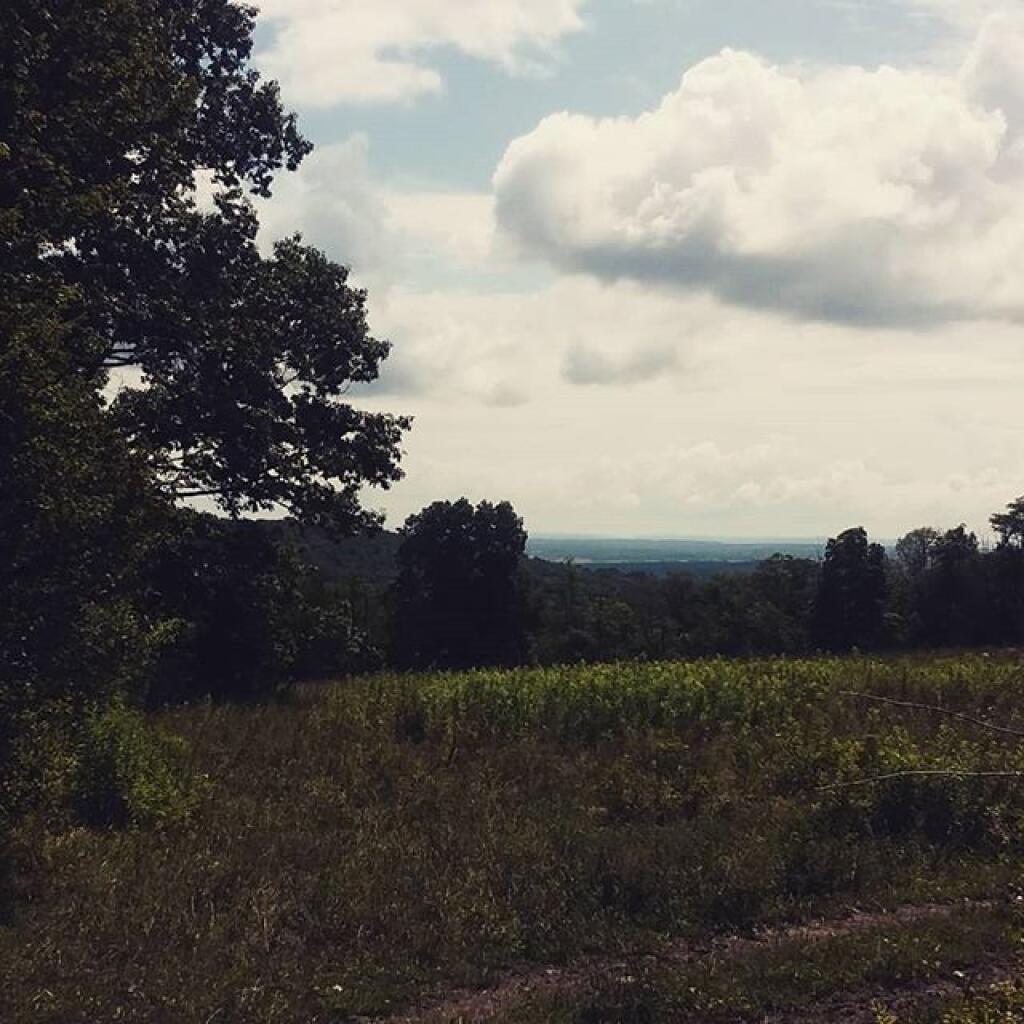
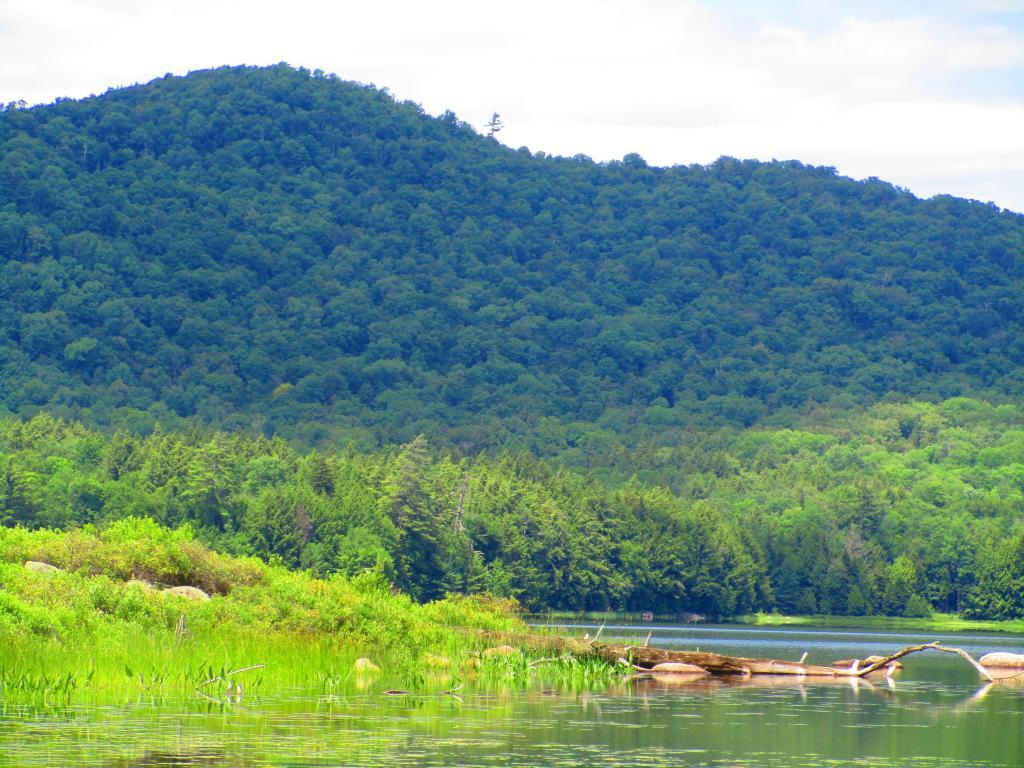
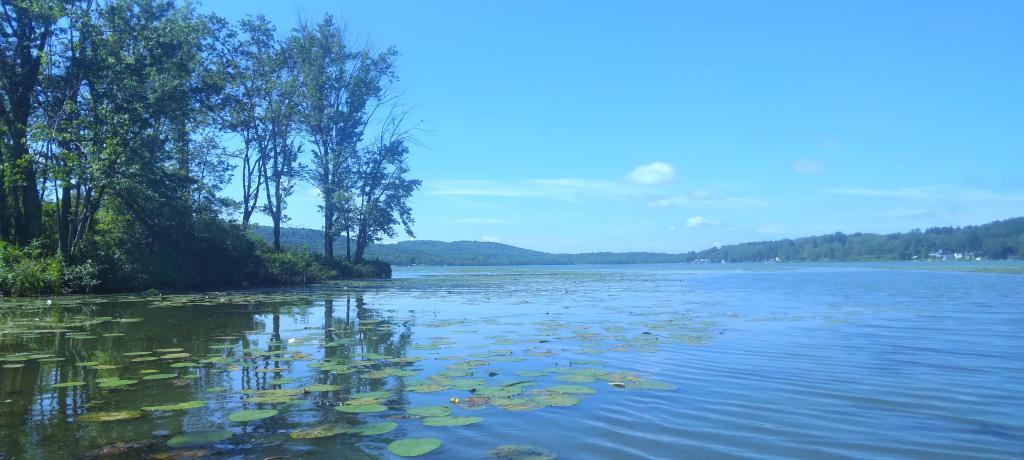
More then one out of every 5 acres in NY State is publicly owned and is used as parkland. Here are a series of maps of various regions of NY State showing the boundaries and classifications of various types of land.
It’s interesting to map the median age of New Yorkers by Census Blocks. While certain census blocks show a median age that is noticeably younger then some, e.g. juvenile institutions and colleges, a broader trend can be seen in Catskill and Adirondack Parks — residents there tend to be older.
Looking at this map, one can conclude residents of the Southern Tier, Tug Hill Regions, and North Country tend to be younger compared other portions of state, while in surburban areas people tend to be somewhat younger. Cities tend to have youngest populations, especially in neighborhoods touched by poverty and blight.
Despite what you might think, residents of Mohawk Valley are not particularly older then the rest of state. If anything, they are slightly younger. The idea that all of the young people are moving away from the Mohawk Valley isn’t supported by data, or at least new young people are coming back to replace the lost people.
If you ask many people today, the assumption would be almost everybody has a Bachelors Degree, if not more education then that. Yet, except in the most suburban (and wealthy) portions of state, Bachelors Degrees are relatively uncommon — often held by fewer then 1 in 10 people over 25 years of age.
It turns out there is a close connection between suburban lifestyles and having a bachelors degree. Zoomed into closer into a map of the Capital District, you will note how closely link suburbanization is to number of people with a bachelors degree.
That said, obtaining that Bachelors Degree might be worth your while — if you avoid college debts, and land a good job after college. Indeed, the wealthiest portions of state tend to have the highest percentage of those with Bachelors Degree, e.g. the suburbs.
It’s probably wrong to assume one is wealthy or well off with a Bachelors Degree, or that all rural folks are backwards hicks leaving in poverty. It’s more that the more affluent (in money terms) suburban life tends to require more schooling then more rural or urban occupations.
Across New York State, bigger and meaner children are stealing the lunch money from smaller and weaker children. It happens every school day, and while it may not be fair or right, it’s likely to continue for the forseeable future. As it would be almost impossible to stop — we should do next best thing — license schoolyard bullies.
Licensing schoolyard bullies could bring in a sizable portion of revenue to the state. Nobody knows how much lunch money is stolen every year, but figuring there are millions of kids in Public Schools, there is the potential for millions of untapped revenue. Licensing schoolyard bullies could be a potential goldmine to tap to reduce the state’s yearly deficit.
Understanding the problem of bulling in schools, the state could dedicate a portion of funds coming from licensing and taxing bullies go to bullying prevention. A 50% tax on profits by school bullies could do a lot for all children. It would make the bullying business theoretically less profitable, and discourage bullying. It also would provide funds to monitor the actions of bullies to ensure that actions are appropiate — extracting funds from weaker children — while making sure their actions aren’t too abusive or harmful.
The fact is we are never going to get away from bigger and mean kids bullying weaker kids, and stealing their lunch money. It’s just part of growing up for the most unlucky of children. Yet, if this insitution is to exist, then at least their should be a kind of public function to schoolyard thief of lunch money, specifically funding of government.
… and remember, school yard bullies are not organized, and are too young to vote.
New York State has the well known Forest Preserve in Adirondacks and Catskills (provided for in Section 1) and State Forests and Wildlife Management Areas (provided for in Section 2) outside of the Blue-line designated Forest Preserve Boundaries. Yet, on November 4, 1969 the voters of New York State admended the consitution to add a new section that called for a new type of land — The State Nature and Historic Preserve — now managed by the new Department of Environment Conservation.
Article XIV Section 4:Protection of natural resources; development of agricultural lands.
The policy of the state shall be to conserve and protect its natural resources and scenic beauty and encourage the development and improvement of its agricultural lands for the production of food and other agricultural products.
The legislature, in implementing this policy, shall include adequate provision for the abatement of air and water pollution and of excessive and unnecessary noise, the protection of agricultural lands, wetlands and shorelines, and the development and regulation of water resources.
The legislature shall further provide for the acquisition of lands and waters, including improvements thereon and any interest therein, outside the forest preserve counties, and the dedication of properties so acquired or now owned, which because of their natural beauty, wilderness character, or geological, ecological or historical significance, shall be preserved and administered for the use and enjoyment of the people.
Properties so dedicated shall constitute the state nature and historical preserve and they shall not be taken or otherwise disposed of except by law enacted by two successive regular sessions of the legislature.
Since 1969, only 35 facilities have been added to the State Nature and Historic Preserve. While most of these properties are not contigous, they consist of some the most interesting public lands in NY State.