One of the claims sometimes made is that previously industrialized or man made landscapes can not ever be reversed into wilderness. It is claimed that once man touches a landscape, mines, farms, or timbers it surface, it can not ever revert back to a natural status.
The reality is that is far from that.
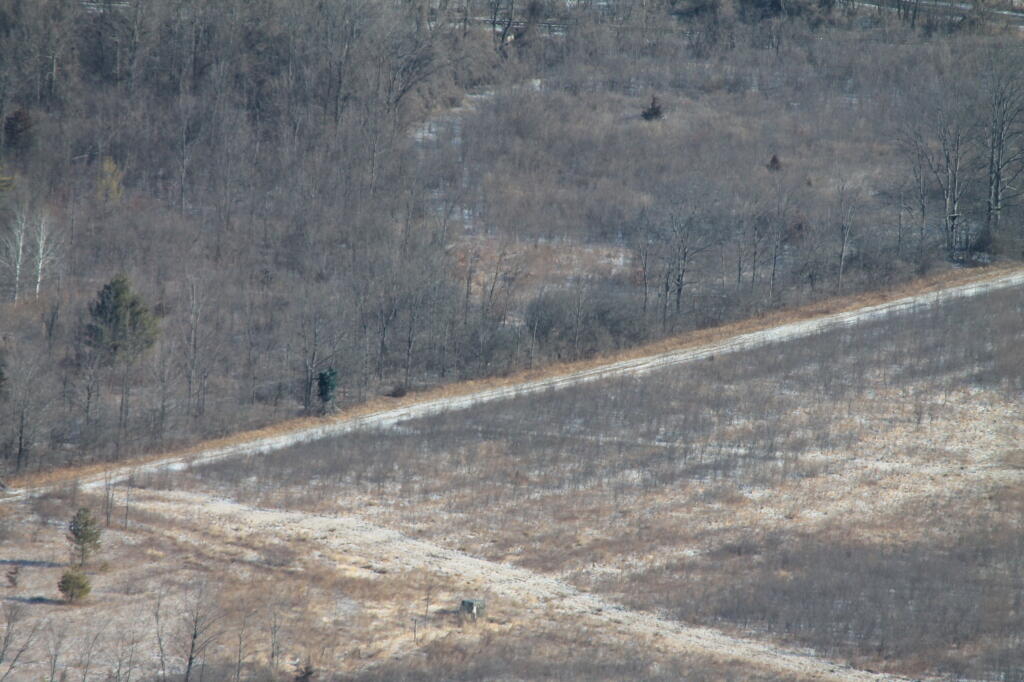
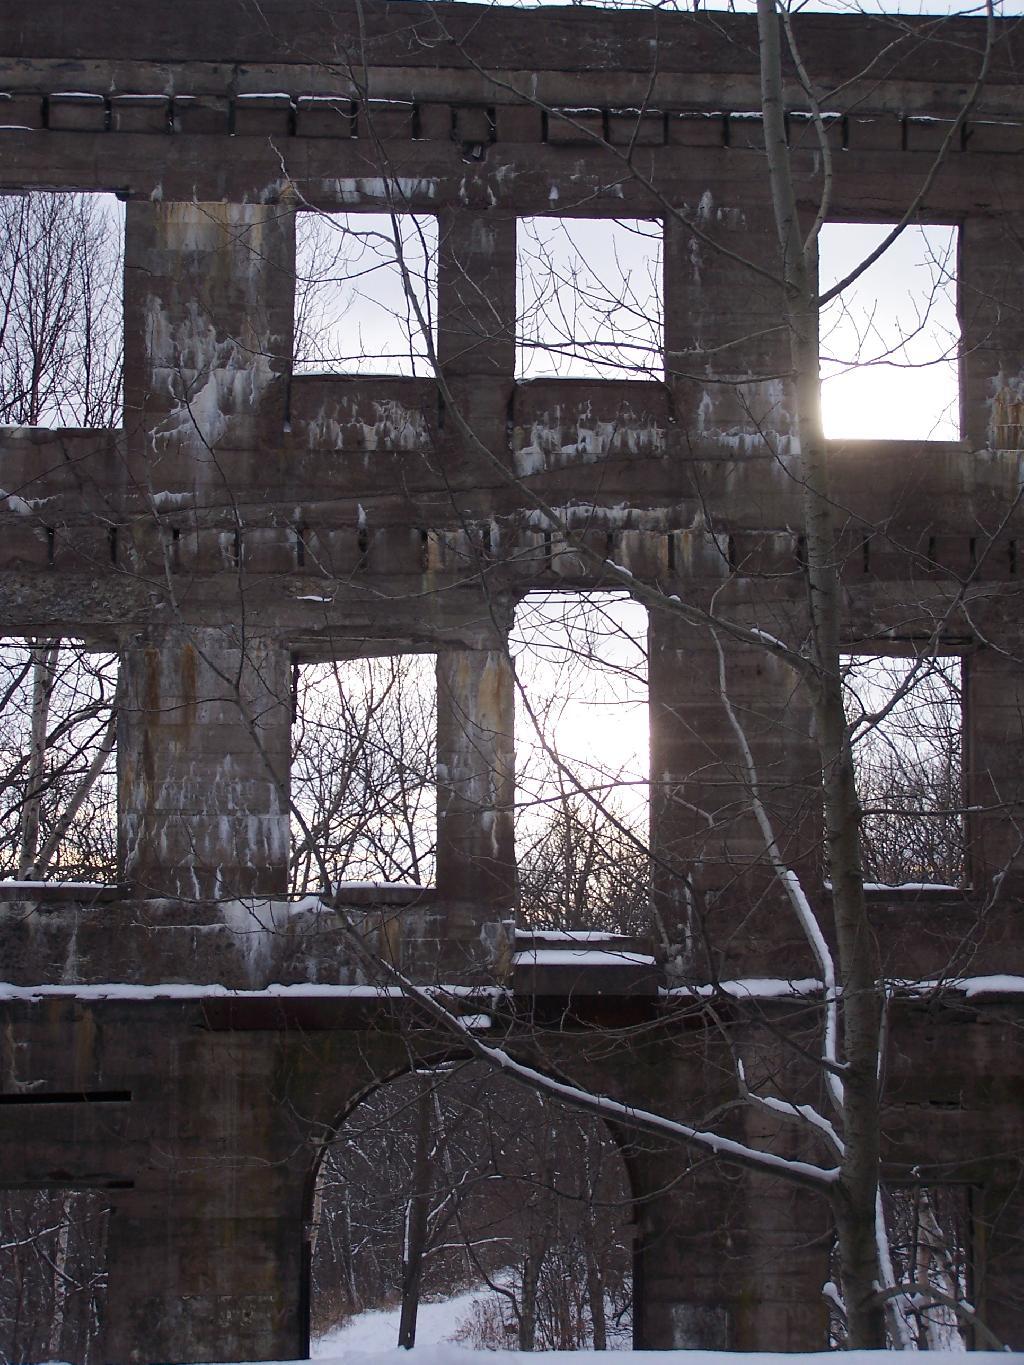
Man made works, while remarkable, quickly start to fall down and revert back to a more natural status, quickly after abadonmnet. Certainly man is powerful, can move large mounds of earth, and bring materials from far away. Yet, as soon as man walks away, plants start to grow into cracks, water erodes roadways and causes buildings ot fall apart, and animals start to return to recolonize a land once dominated by man.
Fragmentation and private inholdings can make it more challenging for abandoned lands to revert back to wilderness. Any attempt by man to upkeep man’s works, will prolong their existence. Man can fight the natural forces through his active stewartship of his products, and through design, but he can not stop nature’s processes once underway, by simply standing on the sidelines.
Buildings make take decades to fall in and rot away in soil. The lost of old growth timber might take hundreds of years to be replaced. Eroded soils, rock cuts might take thousands if not million years to be disolved back into a truly natural state. Yet, still man’s battle against wilderness is only temporary at best, for once man takes his hand of wilderness, it only starts the long path into wildness once again.
Census Block Equivalency – A list of census blocks in each district, generated by the commerical GIS program (such as Mapitude) used for redistricting.
Metes and Bounds – A legal description of each district, used in resolving court disputes over district boundaries, and assisting board of elections on where to put voters whose property might be crossed by a Census block
If you planning on making a map, Metes and Bounds won’t be particularly useful. Computers don’t understand english very well, they need numbers and lists. In contrast, the Census Block Equivalency is very useful for mapping things.
Every year, the Census Bureau puts out series of ERSI Shapefiles known as TIGER/Line. You can download TIGER/Line for any state and county in the United States from their website. They provide many different shapefiles and layers such as a Highway, Faces, Edges, and County Subdivision layers, however the one you will be most interested for making district maps is the Tabulation Block (tabblock) layer.
You can use these files in the free program known as Quantum GIS or QGIS. While this tutorial will not explain the ins and outs of QGIS, this should get you started on making redistricting maps.
The Tabulation Block Layer is the file containing all of the Census Blocks for a particular county. A Census Block is the smallest unit of population gathered by Census Block, and consists of all bordering features (bounds) — roads, rivers, shorelines, along with all imaginary lines (metes) — town lines, village lines, other lines drawn for statisitical purposes.
Each Census Block has a number, that is a subdivision of the Census Block, County ID, and State ID that it resides within. For example, the Governor’s Mansion in Albany is located in Census Block 2000 in Census Track 23.00 (zero padded to 002300) in Albany County (Federal Information Processing Standard — FIPS ID: 01) which is in NY State (FIPS ID: 36). County subdivisions are not applied to Census Tract Numbers, as they may in some cases cross county subdivisions, as is the case of smaller districts.
You put those numbers together to get the GEOID — which is the key used for redistricting block lists and most other block-level census data. The Governor’s Mansion is located at a block with a GEOID 360010023002000.
36
001
002300
2000
State ID
County ID
Zero Padded Census Tract Number
Census Block Number
The block list you get from a redistricting commission typically is in Database Exchange Format (.DBF) or Comma Deliminated Format (.CSV) which are both openable by common spreadsheet applications like Microsoft Excel or OpenOffice Spreadsheet and GIS programs like ArcGIS or Quantum GIS.
This is taken from the LATFOR State Senate Proposed Districts (January 2012) DBF file. It shows you that the Governor resides in Proposed Senate District 44. Across the river in Census Block 4010, Census Tract 524.03, in Rensselear County (FIPS ID 83), NY State (FIPS ID: 36) is located in Proposed Senate District 43.
360010023002000
SD44
360010021002008
SD44
360010021002004
SD44
360010021002001
SD44
360830524034017
SD43
360830524034010
SD43
Download the TIGER/line “Tabulation Block” Shpaefile file for the district you are interested in. You will want the 2010 version. You can download a state-wide tabulation block file, however that is not recommended as the next step will be impossibly slow on most computers. You may also want to open the .CSV or .DBF file in your spreadsheet program and cut out the county you want to speed things up.
You will then want to open up the file in Quantum GIS. You will get a nice map of the county you downloaded, showing all of the Census Blocks.
From there, go to the Vector -> Join Attributes submenu.
Make sure that the Target vector layer matches the Tabulation Block Shapefile you wish to join against, then set Target join field to GEOID10 .
Select click Join dbf table and select the DBF or CSV file you wish to join.
Change the Join field to BLOCK or whatever the GEOID is titled in your redistricting block file.
Enter in a location to save the Output Shapefile
Click okay.
Then wait. A typical county will take 10-40 minutes to join on my 5 year old laptop; your computer may be quicker. If you have a dual processor machine, go on to doing other work in other programs. You will end up with a map that looks like this (stylized for your enjoyment). Each block will be assigned a Senate District (in this example).
Halfway there. Now you need to “dissolve” each Census Block into it’s larger political district. Go to Vector -> Geoprocessing Tools -> Dissolve . Set the Input vector layer to the file you previously joined. Then set the Dissolve field to the field containing the district number — such as DISTRICTID or whatever it is named. Enter a name to safe the file. Click Dissolve.
Outputed will be a Shapefile containing all the political districts in the county you joined and dissolved. This will take 5-20 minutes on my laptop. Other data may exist in that file, such as Census Block number, however at this point that data will be invalid, as only the district number is accurately preserved in such a join. All other data will be picked at random, so delete those columns.
I hope this is helpful. If you just want the Proposed State Senate or State Assembly Districts you can download them from Center for Urban Research. These are the same data, joined using the above process by somebody with a much faster computer. I have also made up a Shapefile containing the Albany County Legislative Districts using this process.
Like Fuck.
Like Fuck You Guilderland.
Like Fuck You Wealthy Folk.
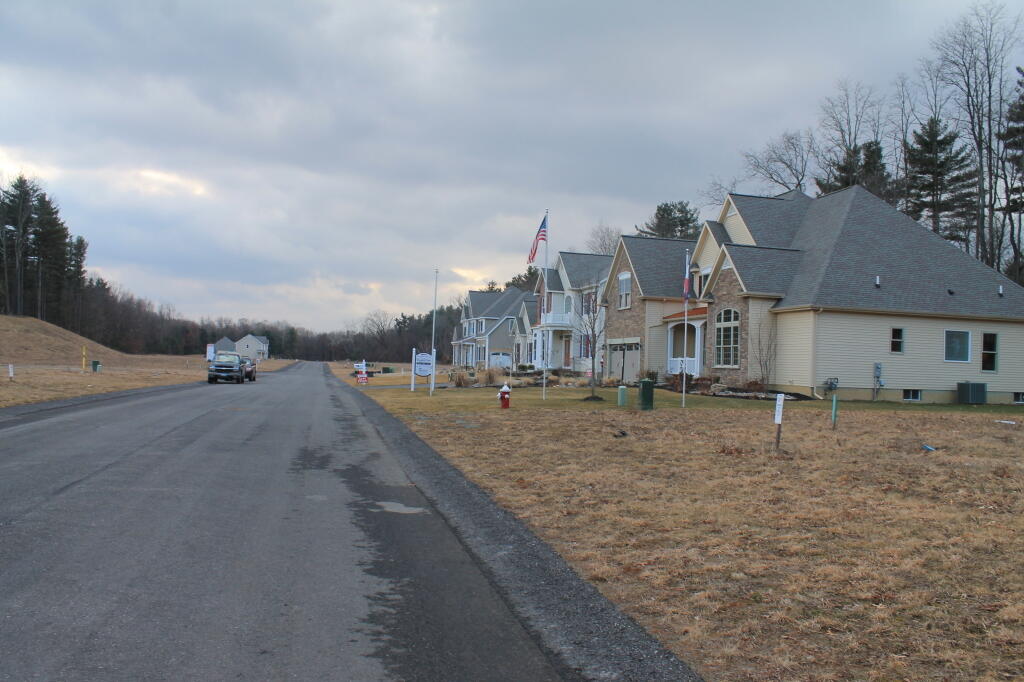
We’ve all probably uttered that word, sometimes more then we’d be proud of it. Yet, sometimes somethings are just truly vulgur like tearing down sand dunes to build McMansions.
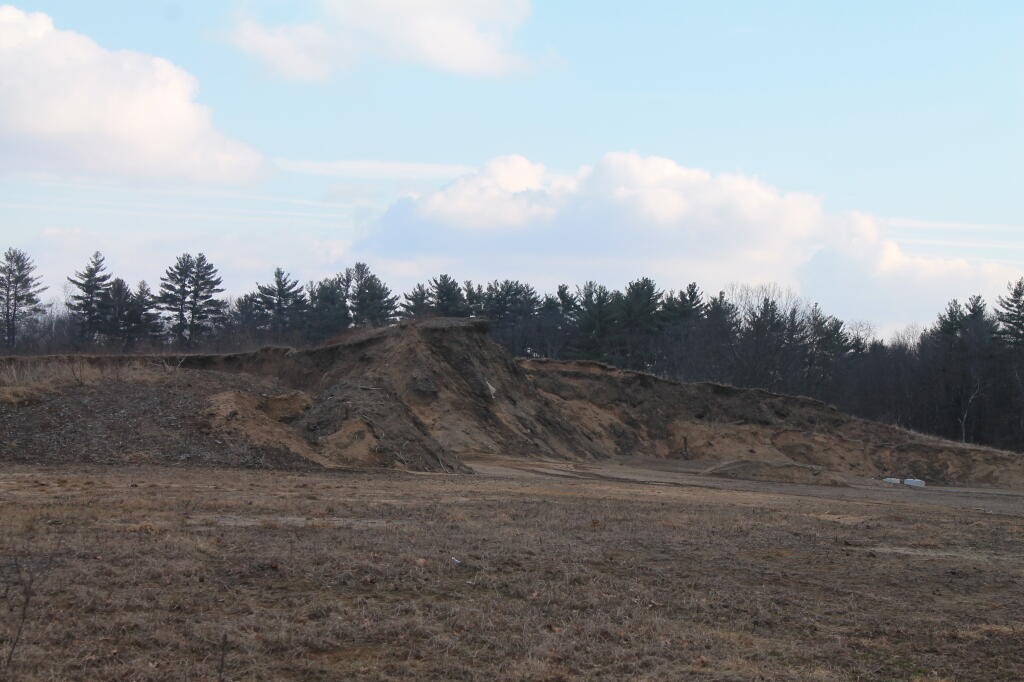
The first part of any housing development in the Albany Pine Bush appears to be the leveling of the land, and the carting off the sand to fill in other areas. To make the landscape flat and boring, so a suburban street grid, driveways, and foundations can be laid.
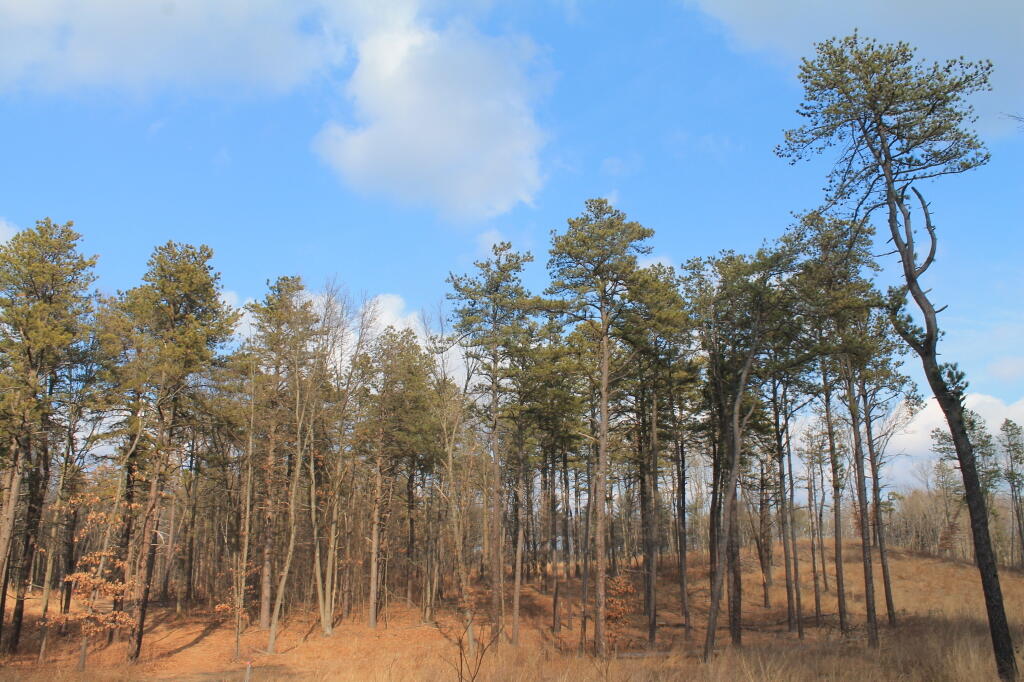
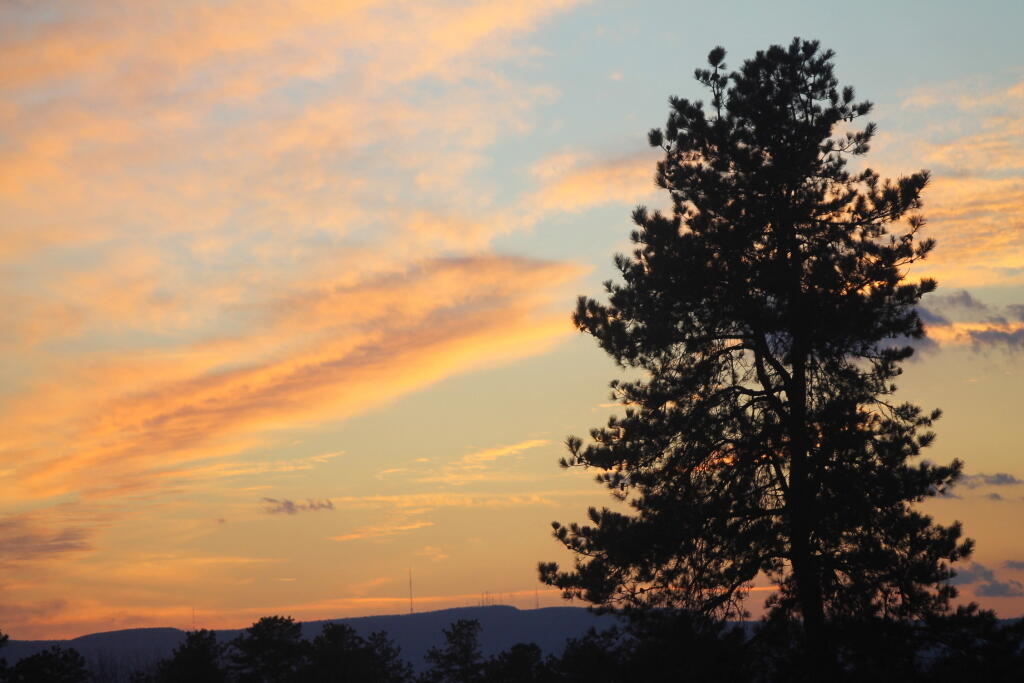
It involves tearing down tall beautiful pitch pines, removing habitat that might be restored if fire were to touch it once again, to sterlize the landscape for generations to come.
People need places to live, places to farm, places to use. But do they really need to tear down magnificent sand dunes? If they had to build, couldn’t they have left more of the trees standing, and built on the dunes, and preserved the terrian?
It might be easy and cheap to bulldoze sand. There is no rocks to blast away at. But making it all flat, just to stick tacky, plastic and plywood houses for the wealthy just seems so vulgur and awful.
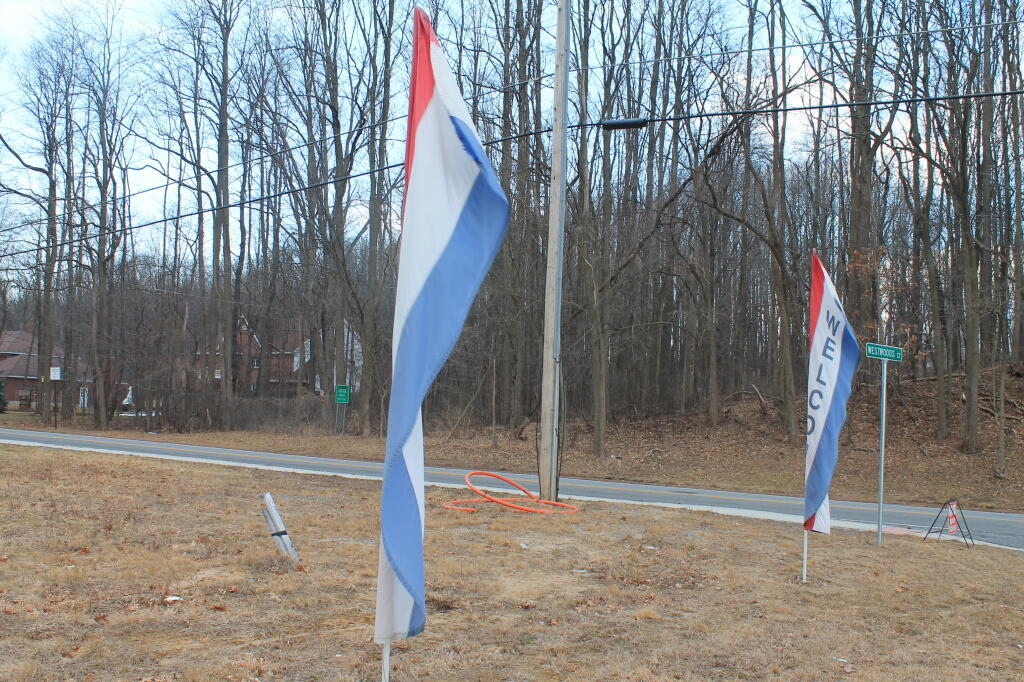
I have a Love-Hate Relationship with the Albany Pine Bush. It is an …
urban unique
wildlife preserve
The Albany Pine Bush’s strengths are are ..
It is conviently located near the city of Albany, you can take either take a bus and walk to get there, or drive a short distance from the city
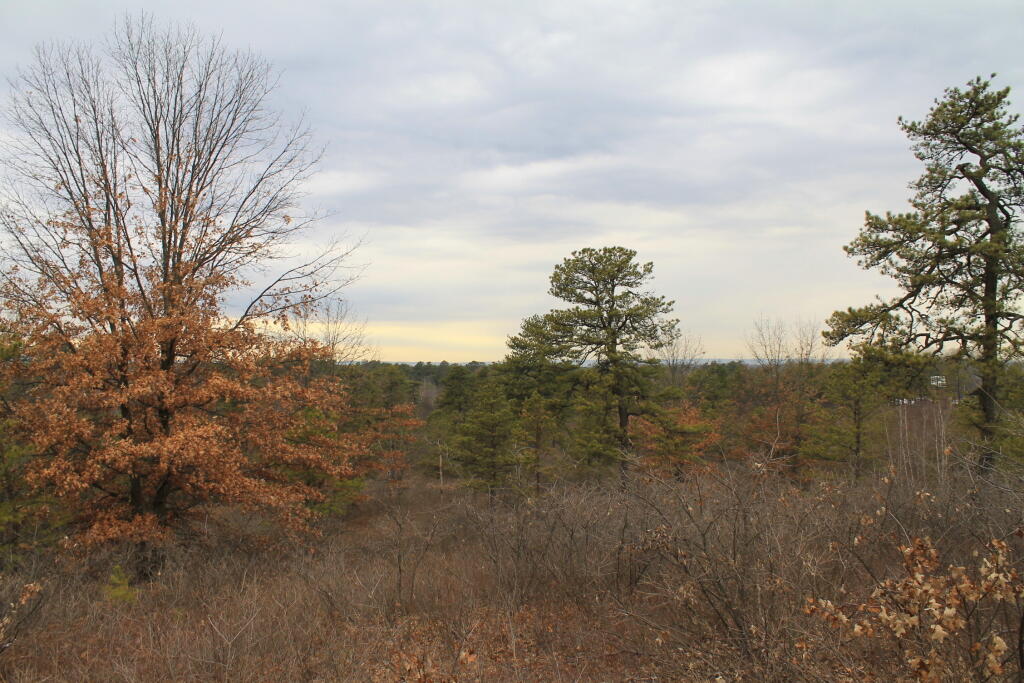
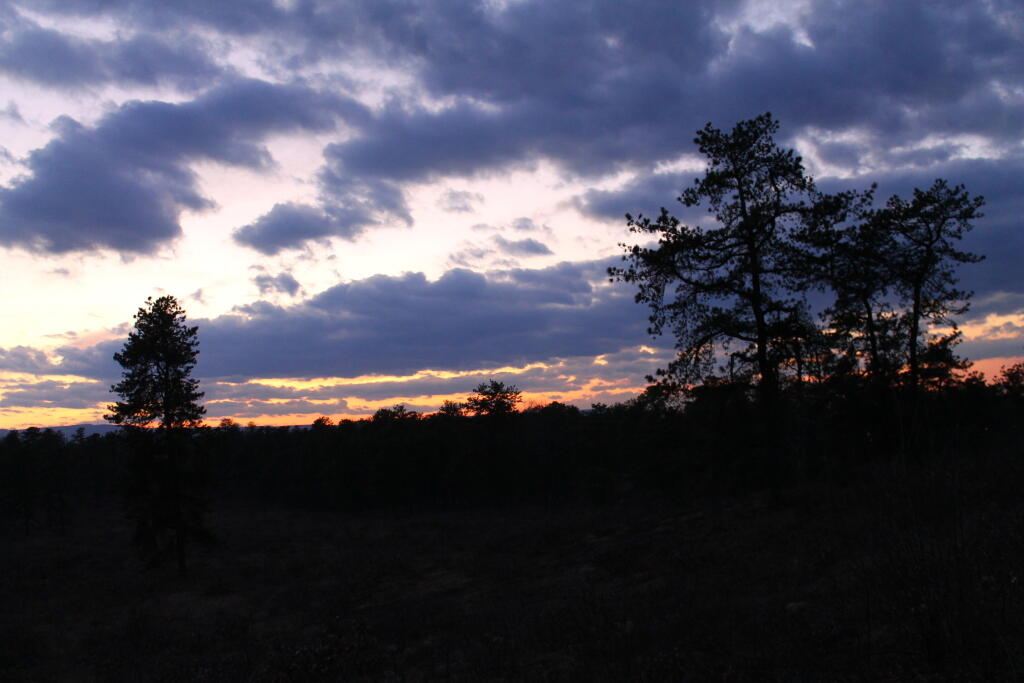
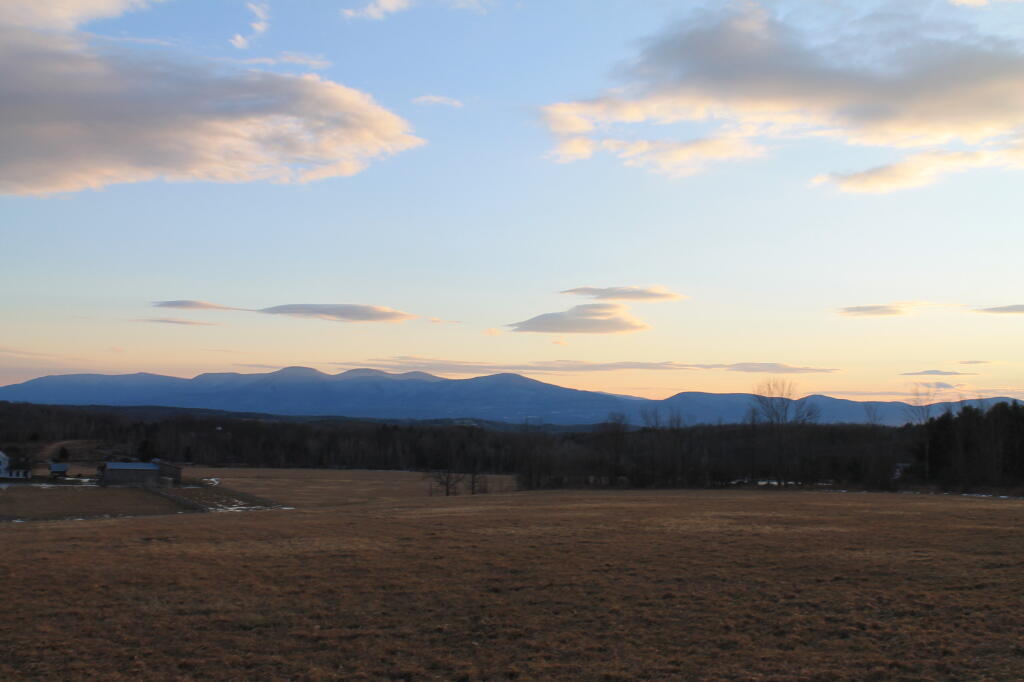
It is a fascinating Pine Bush/sand-dune ecosystem, with fantastic views of the Heldebergs and Catskills and wildlife close to the city.
At the same time those strengths are it’s greatest weakness …
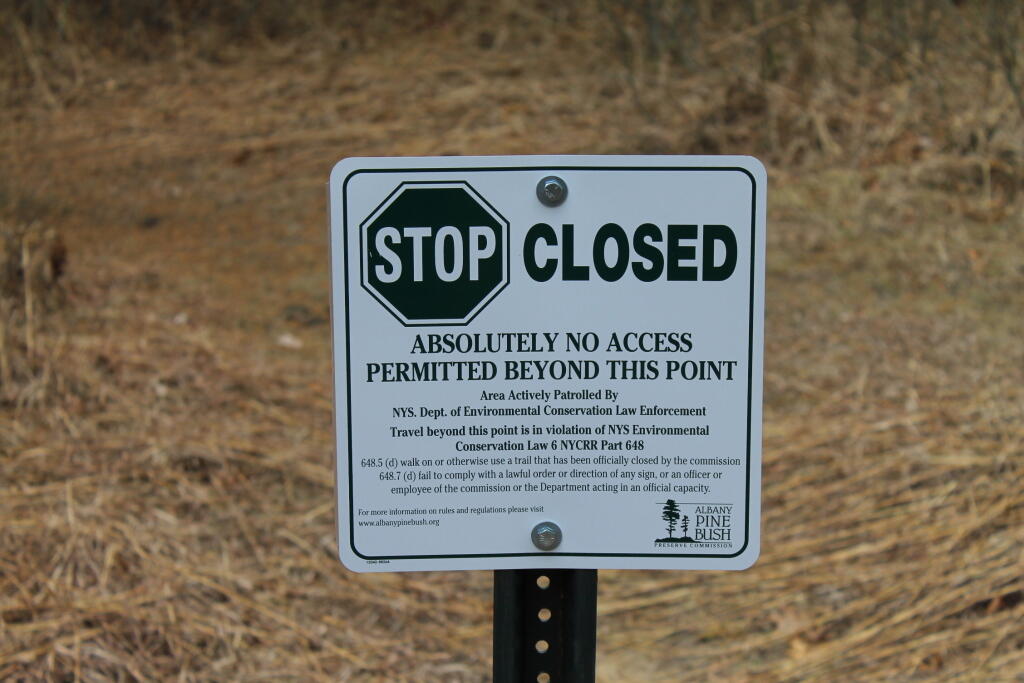
In many ways the preserve is over-regulated and over-governed by the overbearing Albany Pine Bush Commission
The Madison Avenue and Karner East Barriens are overused, dominated by joggers and those walking dogs
There are too many restrictions on hunting, camping, and even hiking and nature observation — such as a ban on traveling off of trails except in the taking of wildlife.
The Adirondack Forest Preserve model might not work in Albany Pine Bush Preserve, but a hybrid model could work. The Commission should try to work more with the public’s desires and demands, and have friendly processes and policies that show that they are there to work with the public rather then restrict access.
Urban preserves are a tricky balancing act. It means easy access to yahoos and those who don’t know basic respect. There are far greater human demands compared to relatively unknown state forests, far off the beaten track.
A while back I wrote I script for converting and styling KML files from ERSI Shapefiles, like you might download or export form a program like Quantum GIS. It requires you have the web programming language PHP 5 installed, along with the ogr2ogr command.
This program extensively uses the PHP/DOM model, to read and write the XML file. I am not an expert programmer — it’s a hobby, but I am very happy with the results. You might consider using the LATFOR data and Census TIGER/Line for this if your a New York State resident.
#!/usr/bin/php -q
<?php
// POLITICAL STYLING FOR KML
// Converts a Shapefile with Election Results in Percentage
//
// Input:
//      File_Title = Title for KML Name Field (as Seen in Google Maps)
//      District_Name = Field with District Name In It
//      Percent_as_Decimal = Election Result with Percent.
//      0.00 - 0.49 = Shade of Red
//      0.50 = White
//      0.50 - 1.00 = Blue
//      Shapefile_Name = Path to Shapefile
//
// Output:
//      Google Maps KML File, Nicely Styled

if (!isset($argv[4])) {
        echo "usage: php politicalKML.php [File_Title] [District_Name] [Percent_as_Decimal]  [Shapefile_Name]\n";
        exit;
}

// required fields
$fileTitle = $argv[1];
$nameField = $argv[2];
$percentField = $argv[3];

// filename
$filename = $argv[4];
$KMLfileName = substr($filename,0,-4).'.kml';

// convert shapefile to kml using ogr2ogr
system("ogr2ogr -f \"KML\" -sql \"SELECT * FROM ". substr($filename,0,-4)." ORDER BY $fileTitle ASC\" $KMLfileName $filename -dsco NameField=$nameField -dsco DescriptionField=$percentField");

// load our new kml file
$doc = new DOMDocument();
$doc->load($KMLfileName);

// first let's replace the name field with a nicer one
$oldnode = $doc->getElementsByTagName('name')->item(0);
$node = $doc->createElement('name', $fileTitle);
$doc->getElementsByTagName('Folder')->item(0)->replaceChild($node, $oldnode);

// delete schema field to save space
$oldnode = $doc->getElementsByTagName('Schema')->item(0);
$doc->getElementsByTagName('Folder')->item(0)->removeChild($oldnode);


// load each placemark, search for maximum — used for making color judgements
foreach ($doc->getElementsByTagName('SimpleData') as $data) {
        if( $data->getAttribute('name') == $percentField) {
                $max[] = abs(substr($data->nodeValue,0)-0.5);
        }
}

// maximum in the political race
sort($max); $max = array_pop($max);

// calcuate multiplier for each race
$multiple = 255/$max;

// load each placemark, then set styling and percentage description
foreach ($doc->getElementsByTagName('Placemark') as $placemark) {
        foreach ($placemark->getElementsByTagName('SimpleData') as $data) {
                if( $data->getAttribute('name') == $percentField) {
                        $value = $data->nodeValue;
                        $color = substr($value,0);
                }
        }

        // decide if we want to do this blue or red, and then calculate
        // the amount of color versus white

        // republican leaning
        if ($color <= 0.5) {
                $colorStr = sprintf('%02x', 255-floor(abs($color-0.5)*$multiple));
                $colorStr = "a0{$colorStr}{$colorStr}ff";
        }

        // democratic leaning
        if ($color > 0.5) {
                $colorStr = sprintf('%02x', 255-floor(abs($color-0.5)*$multiple));
                $colorStr = "a0ff{$colorStr}{$colorStr}";
        }

        if ($color == 0) {
                $colorStr = '00ffffff';
        }

        // stylize the node based on color
        $node = $doc->createElement('Style');

        $linestyle = $doc->createElement('LineStyle');
        $node->appendChild($linestyle);
        $linestyle->appendChild($doc->createElement('width', 0.1));
        $linestyle->appendChild($doc->createElement('color', 'ffffffff'));

        $polystyle = $doc->createElement('PolyStyle');
        $node->appendChild($polystyle);
        $polystyle->appendChild($doc->createElement('color', $colorStr));

        $oldnode = $placemark->getElementsByTagName('Style')->item(0);

        $placemark->replaceChild($node, $oldnode);

        // delete extended data to save KML space
        $data = $placemark->getElementsByTagName('ExtendedData')->item(0);
        $placemark->removeChild($data);

        // update the description
        $oldnode = $placemark->getElementsByTagName('description')->item(0);
        $node = $doc->createElement('description', 'Recieved '.($color*100).'% of the vote.');
        $placemark->replaceChild($node, $oldnode);
}

// finally write to the file
$doc->save($KMLfileName);

// calculate size in MB
$filesize = filesize($KMLfileName)/1024/1024;
if ( $filesize < 10) {
        $zipCommand = "zip ".substr($KMLfileName,0,-4).".kmz $KMLfileName";
        system($zipCommand);

        $kmzfilesize = filesize(substr($KMLfileName,0,-4).".kmz")/1024/1024;
        echo "KMZ is " .sprintf('%01.2f', $kmzfilesize)." MB, while the KML file is ".sprintf('%01.2f',$filesize)." MB.\n";
}
else {
        echo "Woah Horsey! The produced file is greater then 10 MB, at a size of ".sprintf('%01.2f',$filesize)." MB uncompressed. You need to simply your polygons before proceeding, otherwise Google Maps won't be able to read it. \n";
}

>
This Google Maps is based on the block level 2010 Census Population Counts. Census Blocks with no residents appear 100% clear.
Regardless, zoom in, to see how many people live in a particular block, and the density of residency of poeple in various communities. Compared to the city, the suburbs, and rural areas all seem depopulated.
The population density of New York State. Notice this is a totally different scale, and is by per square miles, per Census Tract rather then block. Makes all of upstate look rural compared to New York City. Zero population blocks are not clear on this map.
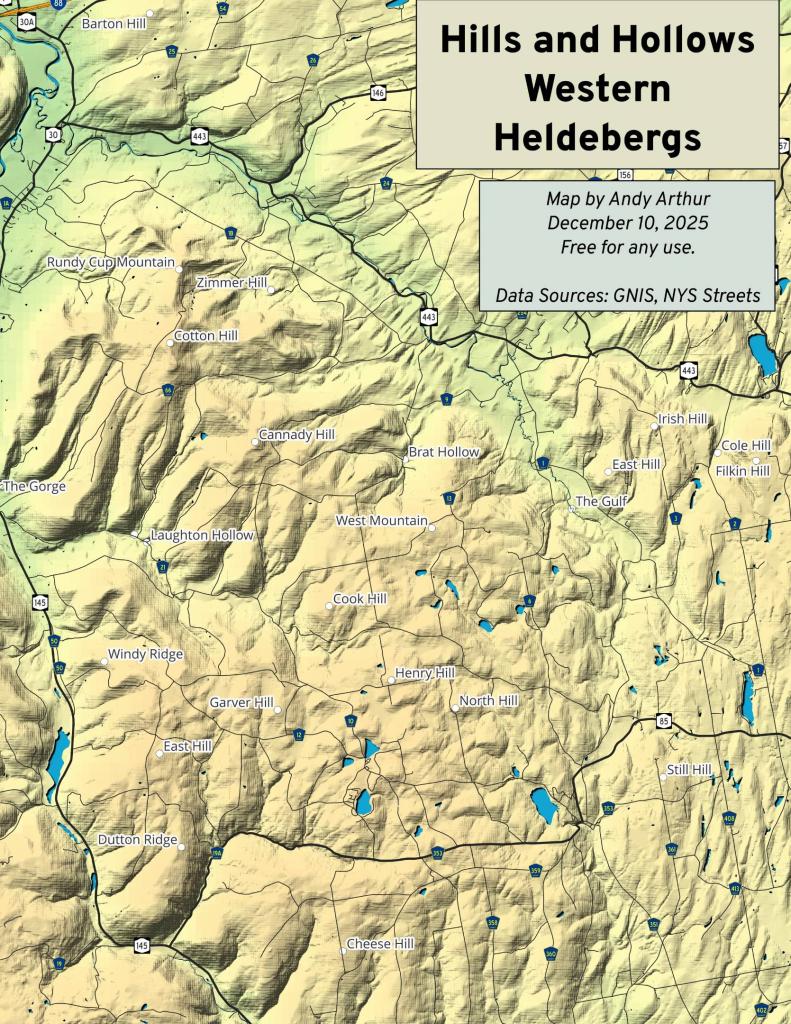
Doing GIS Mapping has become quite the hobby of mine. Especially when it comes to generating maps of public lands, I am endlessly fascinated by exploring the lands that we, the public own.
Rendering maps is mostly about loading layers, and zooming in. Yet, the effort to put together a map teaches you a little bit about the land you are rendering and its features. Mapping can teach you about a land where you have never been before, and prepare you and interest you in a future trip.there. Mapping requires you to pay attention to the landscape, correcting invalid data, and trying to create the best possible presentation of the landscape’s natural and man-made features.
Even when you’ve never been on a piece of land, making a map can teach you much about the landscape and how it’s laid out. A map can tell you many details both by the features on the map and the implied features that you calcuate based on the relation of one land form to another piece of land.
A map makes it possible to better understand a piece of land, without ever putting a foot on it. While maps aren’t always accurate, and sometimes they can be confusing on an unfamiliar piece of land, they do provide context. Maps are a great source of exploring the unknown and unfamiliar.