Search Results for: photo line of green

Weekend at Bear Springs Mountain, Delaware Wild Forest, Warren Highlands

Based on the forecast for the long weekend, I decided to head down to the Western Catskills rather then Moose River Plains. It certainly was a bit sunnier, drier, and less snowy then it looks like they got up at Moose Plains. I simply did not another Memorial Day Weekend at Moose Plains, sitting in rain and snow showers.

I ended up heading down to the Western Catskills. Didn’t leave home until after 10 AM, because I was putzing around. So be it. I also had to stop at Walmart to buy another blaze orange hat, for hiking, because I lost mine. I knew it would be hunting season down there, and figured better safe then sorry. The previous night, they didn’t have one at Glenmont Walmart, so had to visit the Decided to head out the Warren Anderson Expressway (I-88) down to NY 10, and take that all the way south to Walton.

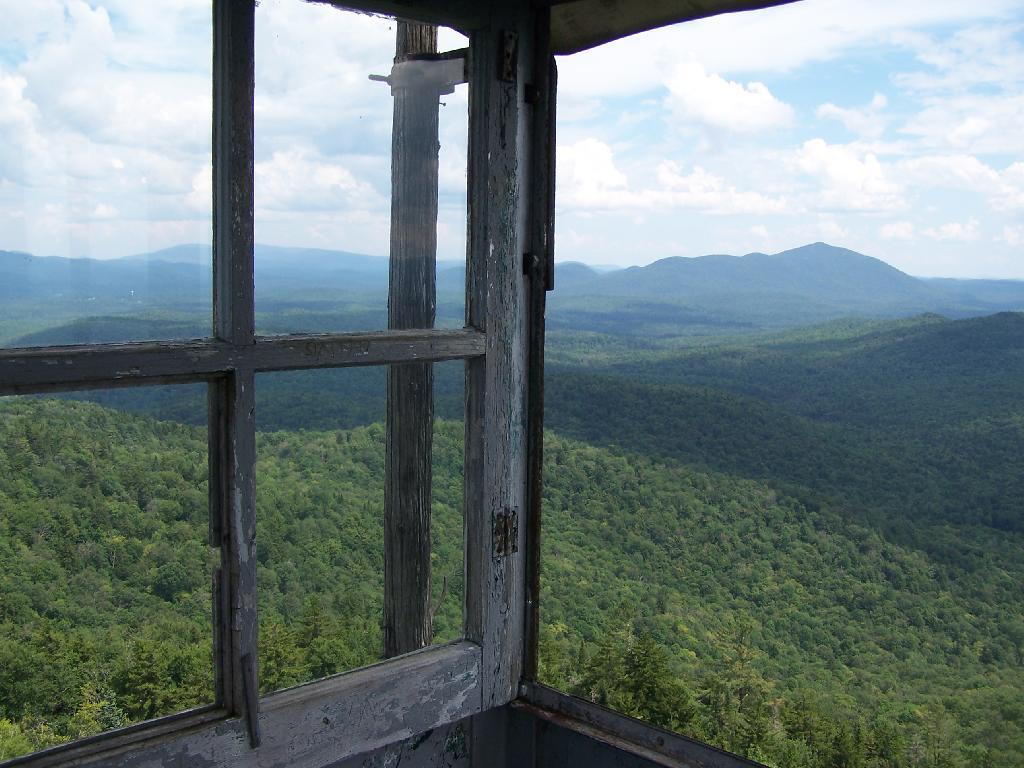
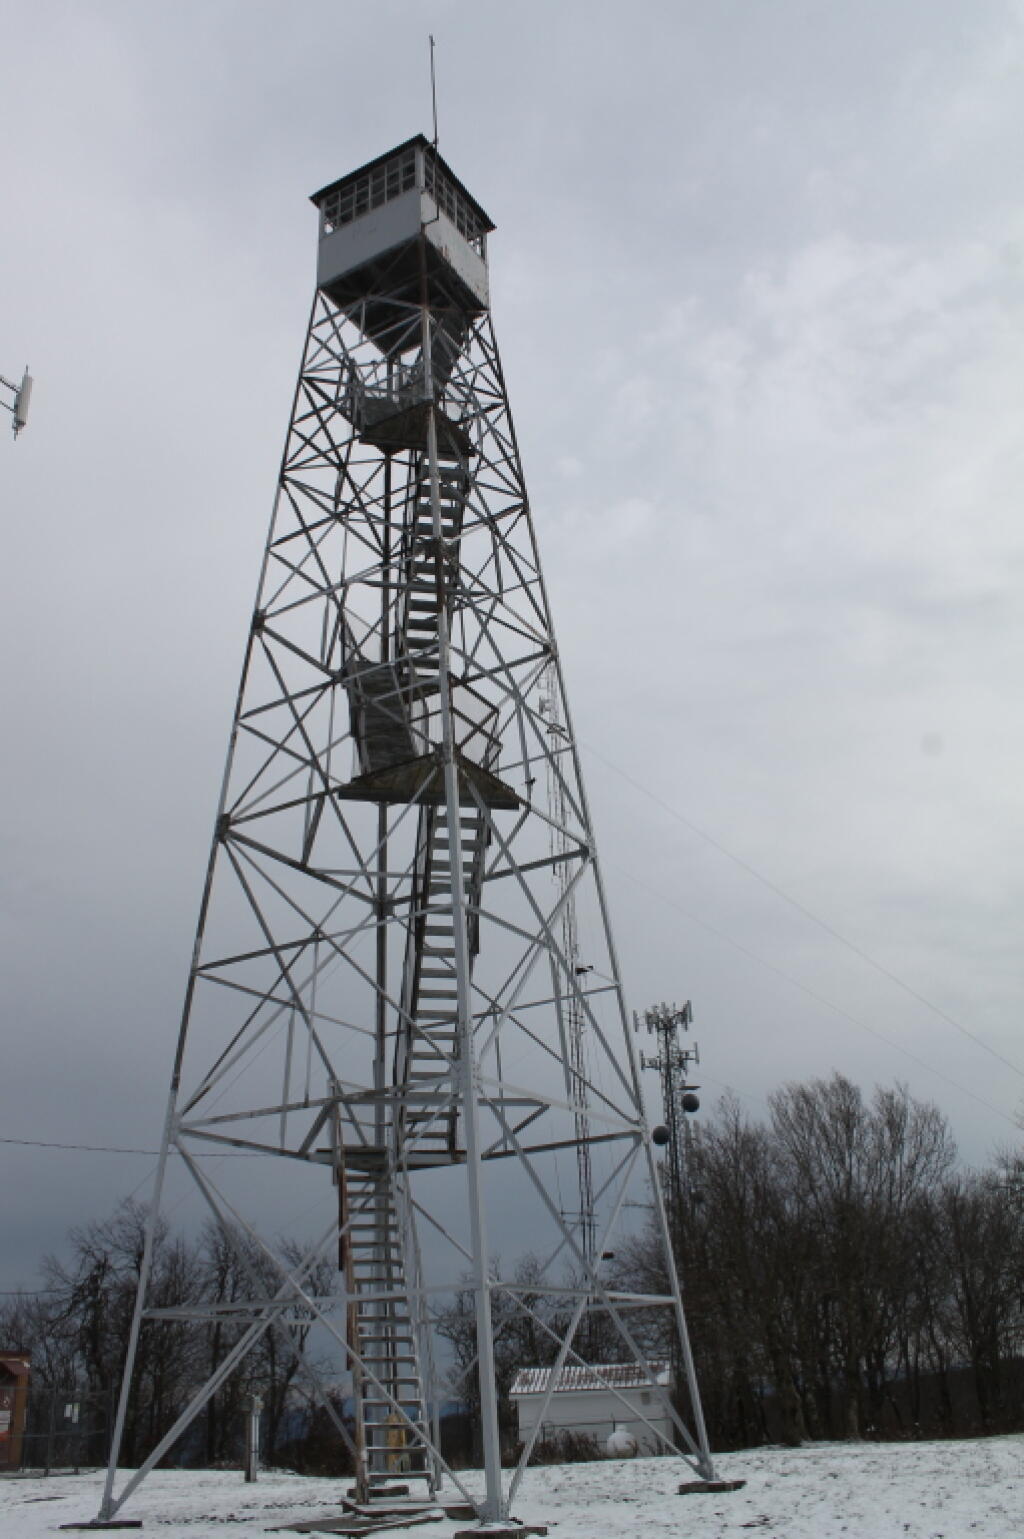
Fire Tower

Driving down NY 10, as soon as I reached Summit, you could see a dusting of snow on the summits around. Stopped in Stamford, drove up to Mount Utsaythana. There was a dusting of snow there too, in parts it looked like a winter wonderland. Then it was down to Walton, following NY 10 and the East Branch of Delaware River. Drove through Delhi, a small rural college town. I had been through Delhi years ago, meandering around Stamford, but not in years. Then I went down to Walton, climbed an enormous hill in the truck, and was at the Bear Spring Mountain Wildlife Management Area (aka Public Hunting Grounds).

At Bear Spring Mountain WMA there is a state DEC campground known as Bear Spring Mountain Campground. It consists of two parts, a fully developed campground with hot showers that is open during the summer months near Launt Pond, and the Spring Brook area with stud pends and a pit privy, similar to Charles Baker State Forest. Both areas are a $18 a night in summer, but from October to the end of hunting season, the lower area is free, but the water is shut-off down there. The designated campsites there are crunched together, and there is no privacy, so I can’t imagine it’s much fun camping there, especially with the smell of horses on a hot summer’s afternoon.

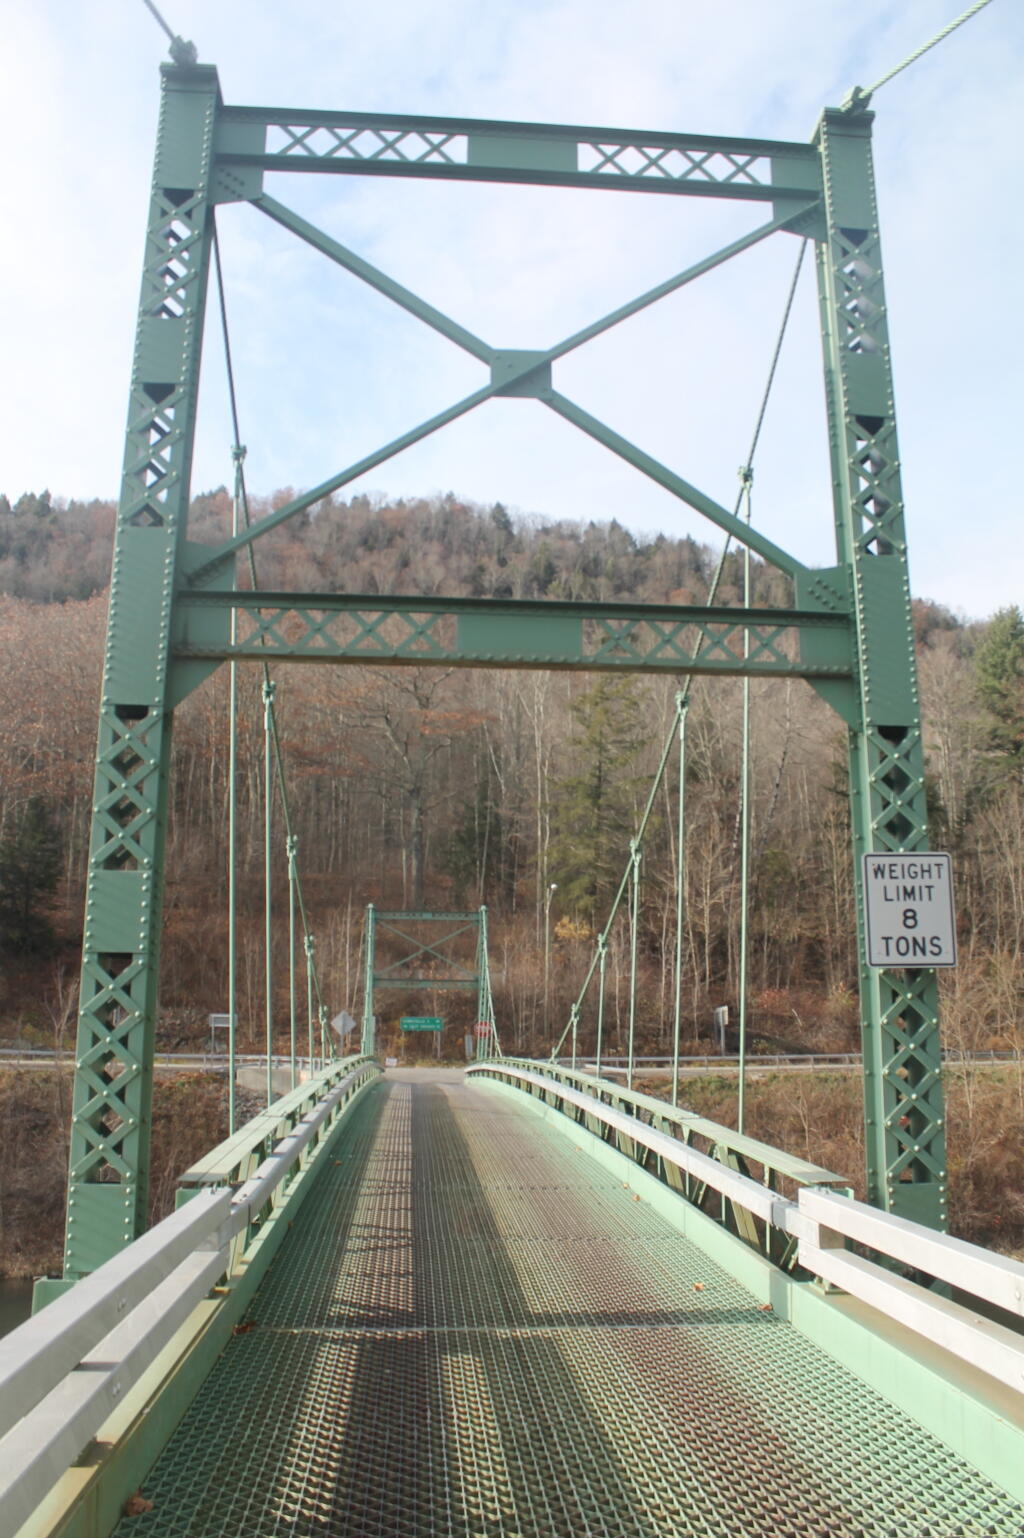
By the time I got down there, it was fairly early, so decided to explore a bit. Drove up to Corbett, explored the Corbett Suspension Bridge, and an old chimney from the β€œacid factory”, which made an acid from tree bark for smokelesss gunpowder. Decided to head back and explore Bear Spring Mountain WMA a bit more, and drove up West Trout Brook Road, past several hunters. There are some limited views from end of East Trout Brook Road, namely at the summit Bear Spring Mountain. There are better views from NY 206, climbing up from Walton, but with few view points. Also explored Beers Brook Road, which had some limited but nice views into the valley below, and Russ Gray Pond.

Bridge Tower

Bear Spring WMA, being a federally-funded public hunting grounds, does not allow camping. The only camping there is those tiny, smashed together developed campgrounds known as the Bear Spring State Campground, operated by the DEC. I decided it was getting late, and I would camp there tonight, especially because it looked like one of campers had packed up, and the only other person around, was a female bow hunter, on far end of the campground. I wasn’t thrilled, as it meant I would have to keep the music down, but at least the campground was deep in the valley, protected from the wind.

It wasn’t a bad night though. The pit privies were kind of gross, but probably not worst then most of the outhouses in the woods. There was surprisingly a lot of wood in woods near the campground. The truck worked well with keeping the lights on, since switching the truck’s radio back to the starting battery and evenly discharging both batteries. The radio shuts off automatically when the starting battery is starting to get a bit low, and Big Red’s DIC says β€œBattery Low: Start Engine Low”. Previously, with the starting battery at full charge, hooked up to the discharged auxiliary battery, the alternator wouldn’t kick up to full charge, so the auxiliary battery would fail to get fully charged. Now, with the starting battery slightly discharged – but with enough charge to crank the engine, things kept working well all night long. There was a little bit of sleet in the evening, but nothing major.

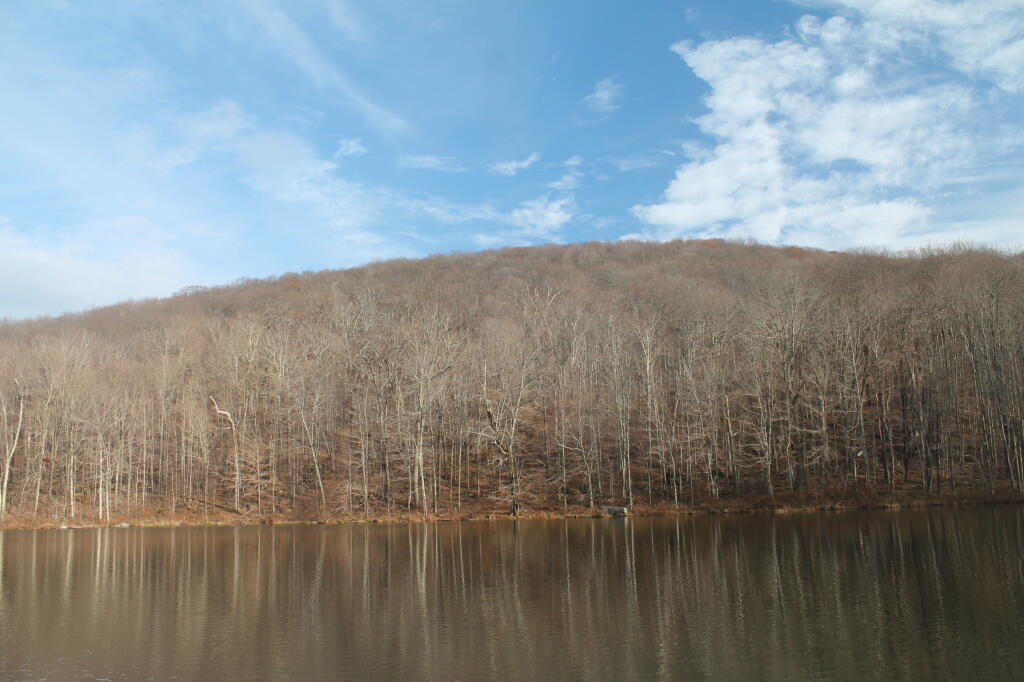
Russ Grey Pond

The next morning, I got a slow start. It was drizzling, and I kind of slept in. I didn’t have a tarp set up, which didn’t help. I probably didn’t break camp until 10:30 AM..I was thinking of hiking the NYC DEP trail that overlooks the Pepacton Reservoir, but I ended up turning off onto Holiday Brook Road, and deciding to check out Huggins Lake. Hugging Lake was a nice hike back, following an old woods road back there. There is a campsite down by the lake. Apparently on the ridge above Huggins Lake, there is an old growth forest, but I never got back there.

Then it was off to Mary Smith Road. On Campground Road, one of the cut-over roads, I got to a cover bridge, which had a clearance of 6’6”, which is about an inch too low for my pickup truck with the cap and racks on. So I had to turn around, and back track for about 5 miles. That sucked. Stopped and grabed a few pictures. When I got on Mary Smith Road, and back in forest preserve, I was pleasantly surprised to find three roadside campsites on it. I ended up camping at the most used of the sites – as witnessed by vegetation – along the Finger Lakes Trail/Mary Smith Trail/Middle Mountain Trail. It was a pretty nice roadside campsite.

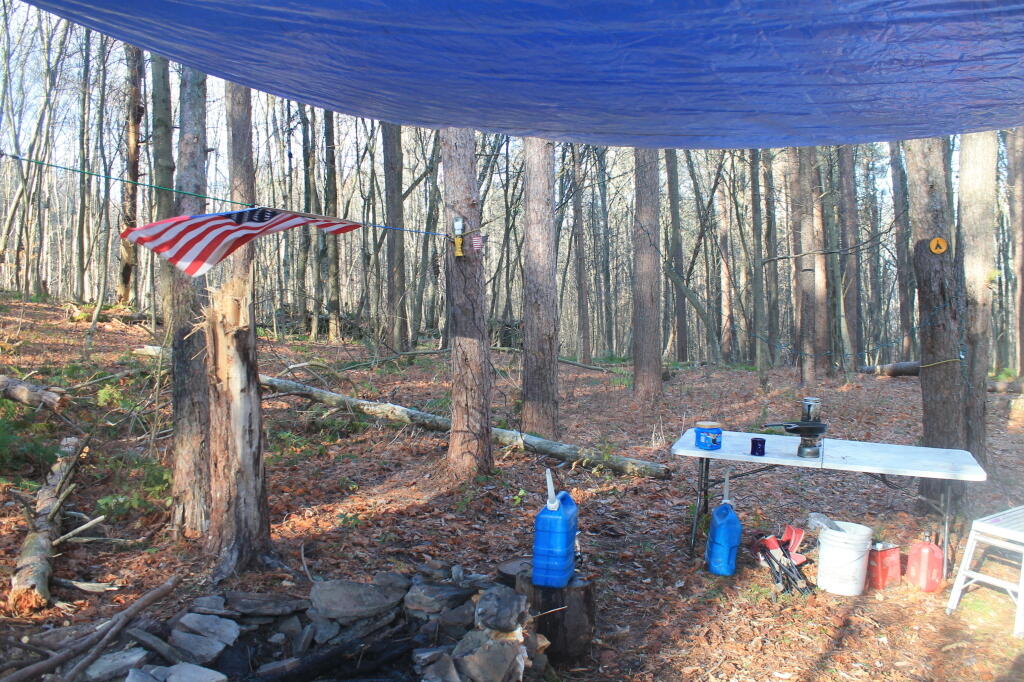
About as soon as I scoped out the campsite, I realized it would be a pretty night up there. Despite the mountains on both sides, the north wind was whipping along the col. But I liked the campsite, and there was plenty of trees to hang a tarp up. I starting setting up camp at 2:30 PM – which was kind of early – but I figured it was too late to hike Mary Smith Hill (which wasn’t true), but it did start to rain/sleet a bit. Got the tarp up, then the lights strung up and flag up. A heavy sleet squall pounded the col, for a while bad enough I hid out in the cab of the truck. Then I went out, built a fire, and spent sometime listening to a podcast and reading a book about the 1964 World Fair in New York.

The new 60-watt equivalent LED bulb I bought worked real well in the cold, which got down below freezing that night.. But with the bulb focused on the book, it was easy reading and plenty bright. In the cold, the 60-watt equivalent LED bulb was actually brighter then the 100-watt florescent bulb I had at camp, even after fully warming up, because the cold wind made it impossible for the florescent tube to get warm enough to fully atomize the mercury in the fixture.

At times the wind picked up, and it was pretty darn cold, to say the least. I end up putting the fire out cold before bed, to reduce the risk of the fire spreading, and because the tarp partially covered the fire pit, I was afraid it could fall into the fire, and possibly set the truck on fire or cause dripping plastic to fall on it. The fire was out cold, and I went to bed around 10:30 PM. No nightmares.

Mary Smith Hill Roadside Campsite 1

After bedding down, the wind started to whip around. It literally was howling, and the tarp was snapping up and down, making quite a bit of noise. Morning came, and it was beautiful blue skies, but very cold. That was when I first saw car actually pass by on Mary Smith Hill Road – despite being a through-road, and not a super remote road at that. Had another slow breakfast, and built a small fire to burn up some camp garbage. Usually I don’t start fires in the morning, but I was chilly, and knowing that it may be a while until I got out camping again, I wanted to have a fire.

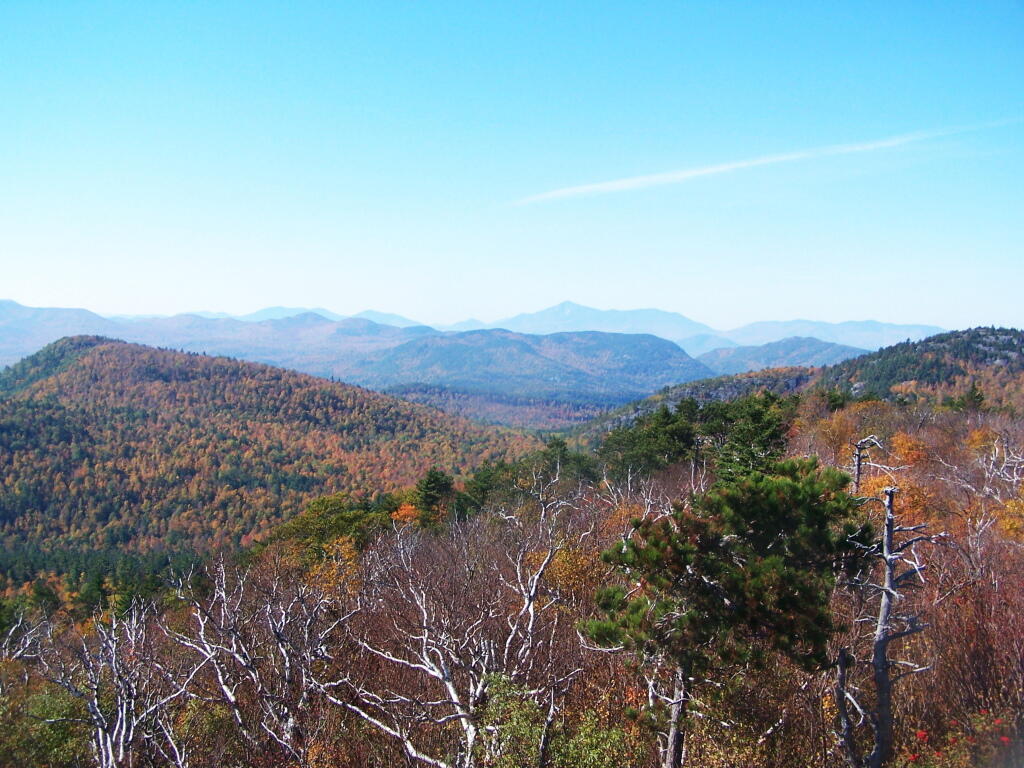
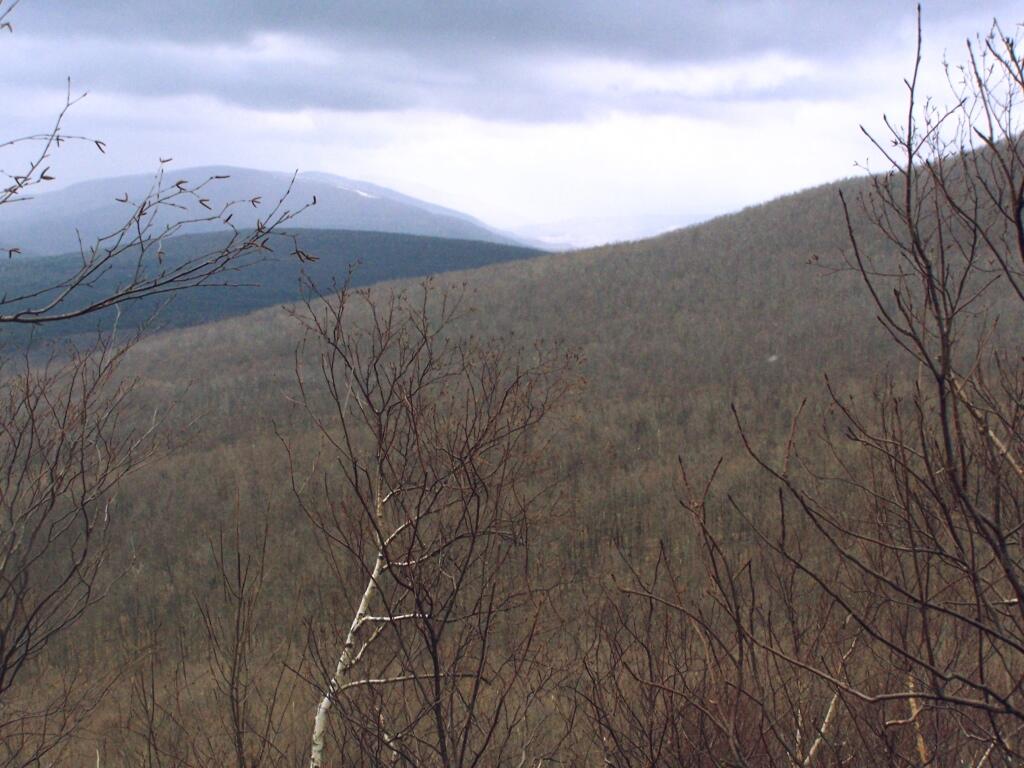
Once I finally got going, I hiked up Mary Smith Hill to the overlook. It really was a lot less further then I expected, and ha+d some interesting views to the north. Nothing totally breathtaking, but still an interesting short hike of maybe 20 minutes each way. Then I drove over to Russell Brook Falls, making a wrong turn and ending up going through Livingston Manor and the world famous fly fishing town, Roscoe. My impression of Roscoe, was it was a very a long and pokey 30 MPH zone, but with more stores then one would expect in such a rural, small town. I probably should have stopped, but I was burning daylight.

Finally made it to Morton Hill Road, and passed a Game Warden in a unmarked green suburbanite-style Jeep. The only reason I know that, was I saw him outside of the car talking to somebody in full uniform. Morton Hill Road climbs a lot from Roscoe out to where it hits Russell Brook Road. There are three campsites along Russell Brook Road, although in all of them there is a boulder barrier between the campsite and fire pit. One might still be able to use them for a pickup with a camper on them, I guess.

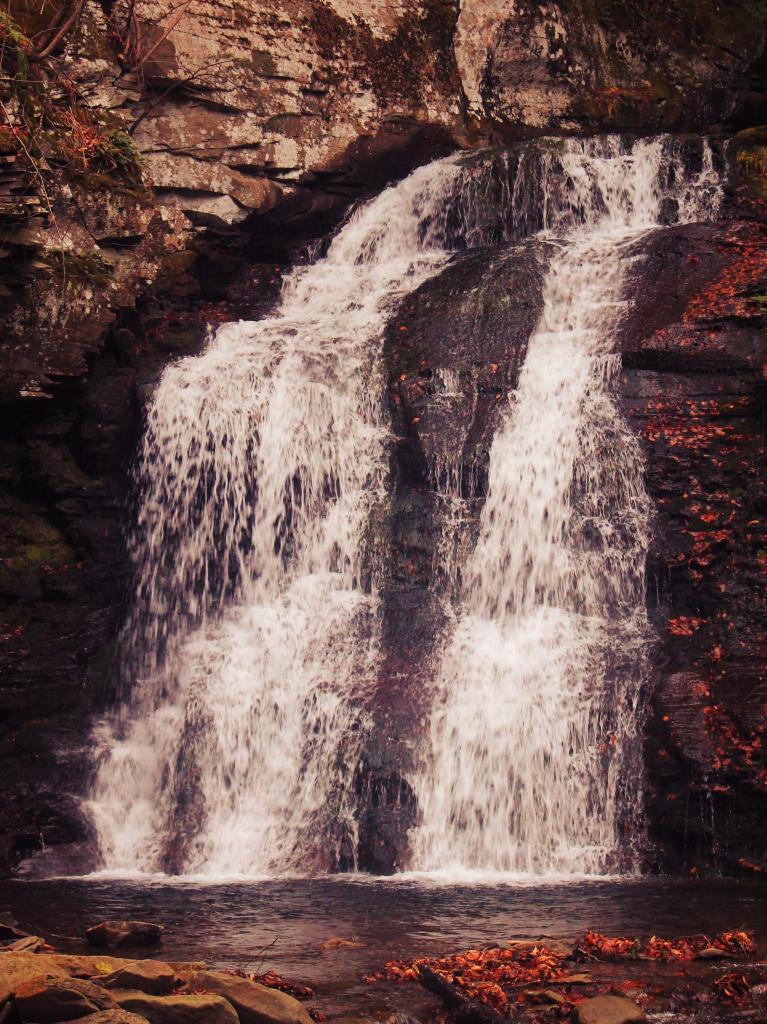
Russell Brook Falls 2

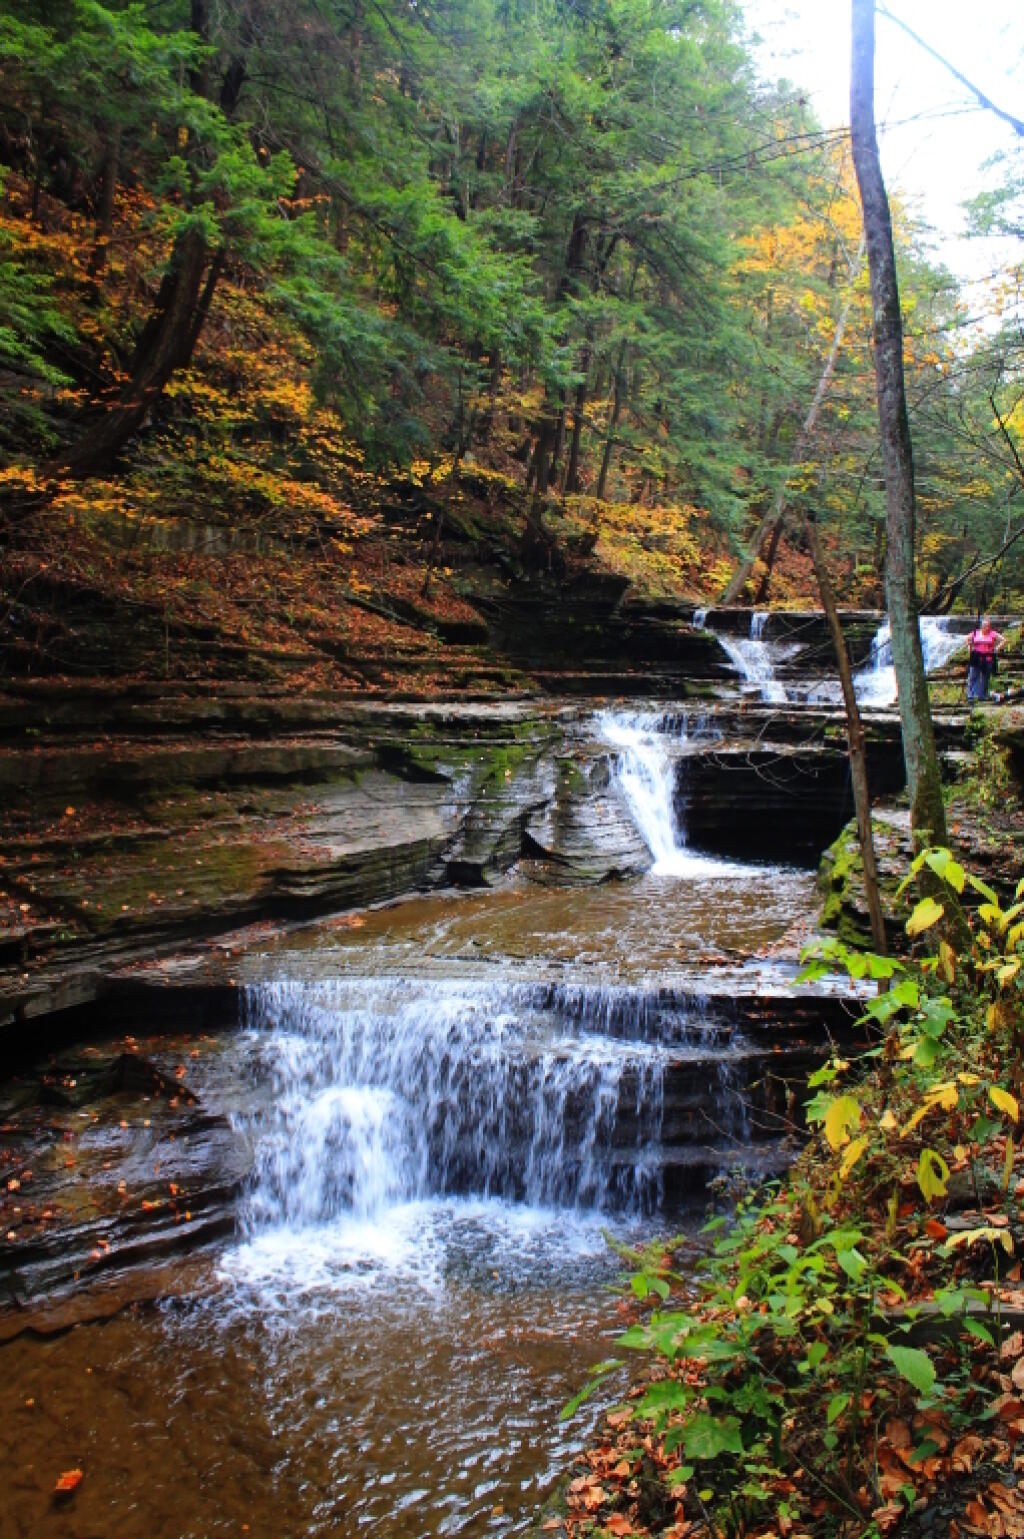
I hiked back to Russell Brook Falls – a beautiful but relatively unknown set of falls – at least to non-regulars to that part of state. They are less then quarter mile from the Russell Brook Falls parking area. I stopped and grabbed some pictures. Then, it’s easy hike back to back to Trout Pond, following a gated road 9/10th of a mile from the parking area. There is a slight incline on the road, but nothing to make one break a sweat, even a fat out of shape dude like me, who spends too much time sipping cold buds in the woods. The road is a designated route for people with disabilities – somebody very strong with a wheel chair could theoretically get back there, or maybe with a CP-4 disabled with an ATV permit.

Back at Trout Pond, there is a campsite on the easterly end, and the gated road continues to the west end of lake. On the west end of the lake, there are two other campsites, spaced a ΒΌ mile apart, along with two lean-tos. All are designed for those with disabilities. There is also a trout spawning shelter on one of the creeks leading into lake. One of the lean-tos was well equipped – somebody left behind some nice pots and pans, all cleaned up, and a selection of perfectly good adult beverages and soda along the back wall of the lean-to. Talk about paying it forward to the next person who will use that lean-to – most certainly a hunter this time of year.

It’s small game hunting season, heard several small game bullets ring out, while hiking back there. No hunters nearby, as far as I could see, but I did wear plenty of blaze orange. I am sure next week, there will be a lot more hunters back there. Wish them luck. Hiked back to my truck and explored Campbell Mountain Road and Campbell Brook Road, looking for additional roadside campsites, preferably the kind you can back a pickup all the way back to. No such luck. Oh, well.

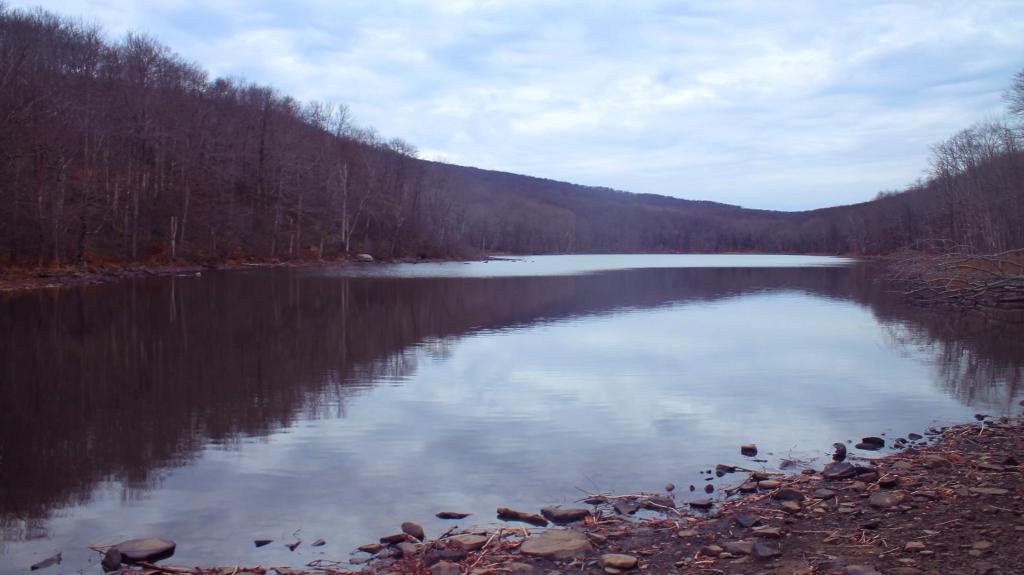
Trout Pond

Then I drove down NY 30, through the hamlet of Harvard, then East Branch. Took Old Route 17 to Hancock, then poked around the Poconos and the Warren Highlands in Pennsyltucky, before eventually ending up in Susquehanna and Great Bend. The area around Hancock is very mountainous and beautiful. The Warren Highlands were rough, mostly hunting and rural landscape country, with a relatively small amount of farming going on. Lots of open burning going on too – I love Pennsylvania..

I love that wild country, and everything Pennsylvania. Fueled up, picked up certain Pennsylvania products not legal in New York and/or cheaper then New York, then hopped on I-88/Warren Anderson Expressway, and made a bee-line back to Delmar, stopping only momentarily at the rest stop on I-88. That place was creepy as all hell after dark, and not well lit either. I seriously thought of just taking a piss in some farm

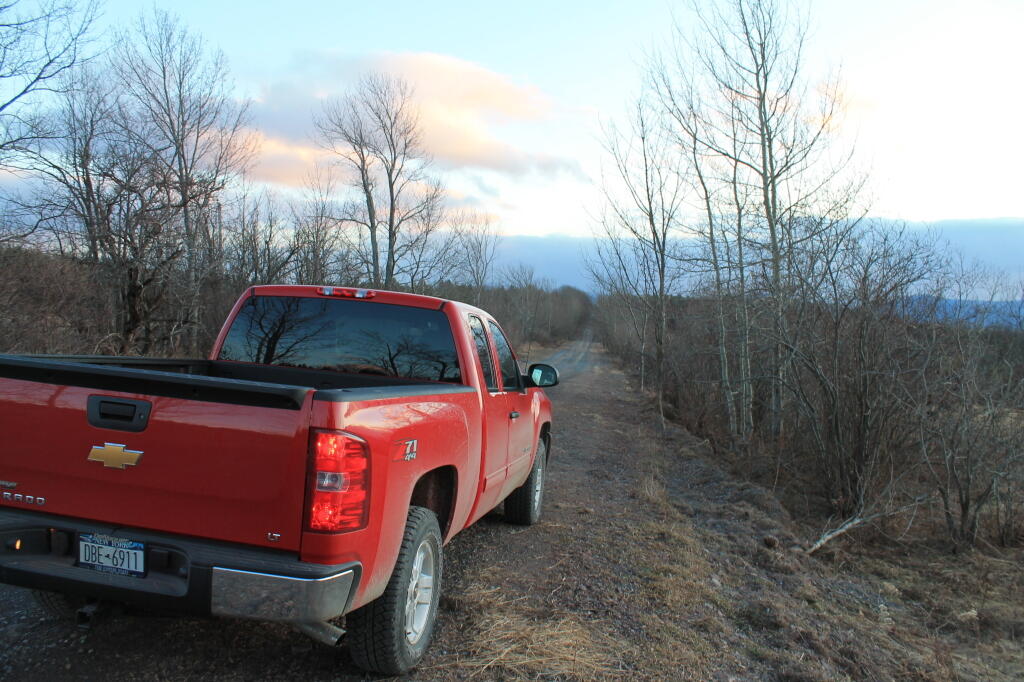
I made it back to Delmar around 7 PM. It was a good adventure. Burned through more gasoline, then I had planned, although on the trip back along I-88, I average 19.9 mpg in my Big Red Silverado pickup, so not complaining.
A long-weekend trip in early November to explore the the Western Catskills.

Gorging on Gorges, An Adventure, Day 2

I awoke for Day 2 of Gorging on Gorges, and it was a fairly warm morning, at least for the day before Columbus Day, in the back country of the Finger Lakes National Forest. I decided I wanted a full breakfast this morning, so I got some sausage frying up, the coffee peculator doing its thing, then scrambled some eggs with mushrooms and sweet peppers. It was a good breakfast. Packed up my gear, folded the flag, headed out on Potamac Road, and stopped grab a few pictures of the pastures along the road.

Potamac Road 2

Driving along all these back-country roads, I was amazed during most of my trip in New York State, on how many anti-SAFE Act signs there were in front of houses and farms along the way. If there ever was an issue that galvinized the backwoods of Upstate NY, it has to be that stupid gun law. I would reminded of the opposition to the SAFE Act all week, until I finally crossed into Pennsylvania state-line – the last SAFE Act sign ended a ΒΌ mile before I left the state. I bet you that poor dairy farmer, was awful pissed to live on the wrong side of an imaginary line, so they had to be subjected to stupid laws, high taxes, and anti-farm regulations.

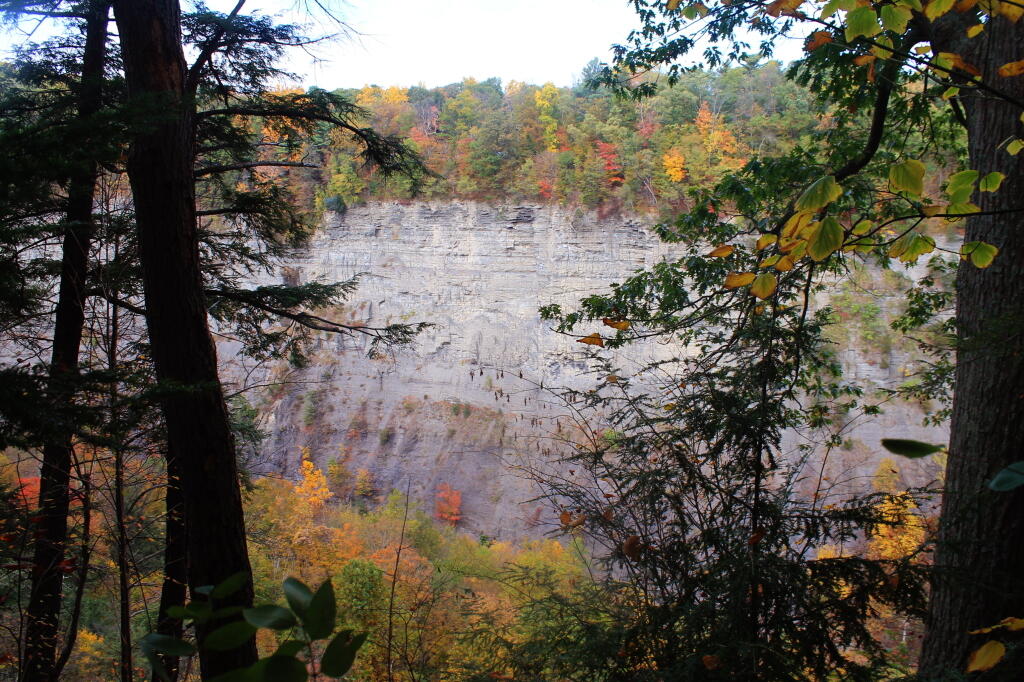
Across the Gorge

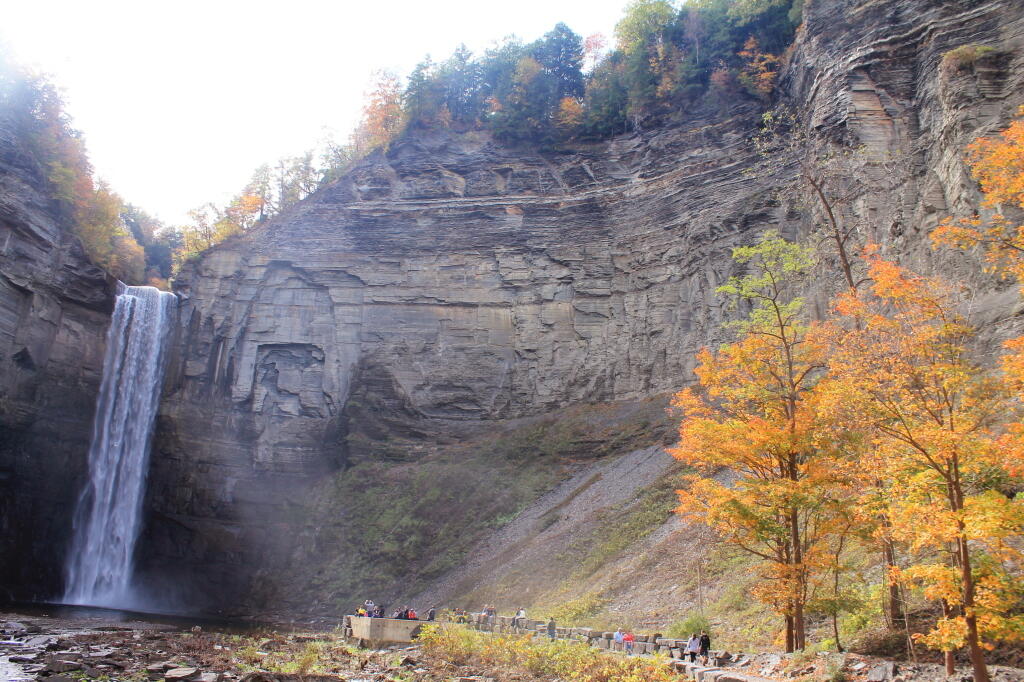
Drove down to Trumansburg and then to Taughannock Falls State Park’s Gorge Overlook. The main overlook, next to the parking lot was a complete tourist trap, with dozens of tourists, many obviously traveling a long ways to get there, crowded around the overlook deck, as everyone – myself included – scrambled to get that one trademark photo of the falls. I was glad to get away from that overlook.

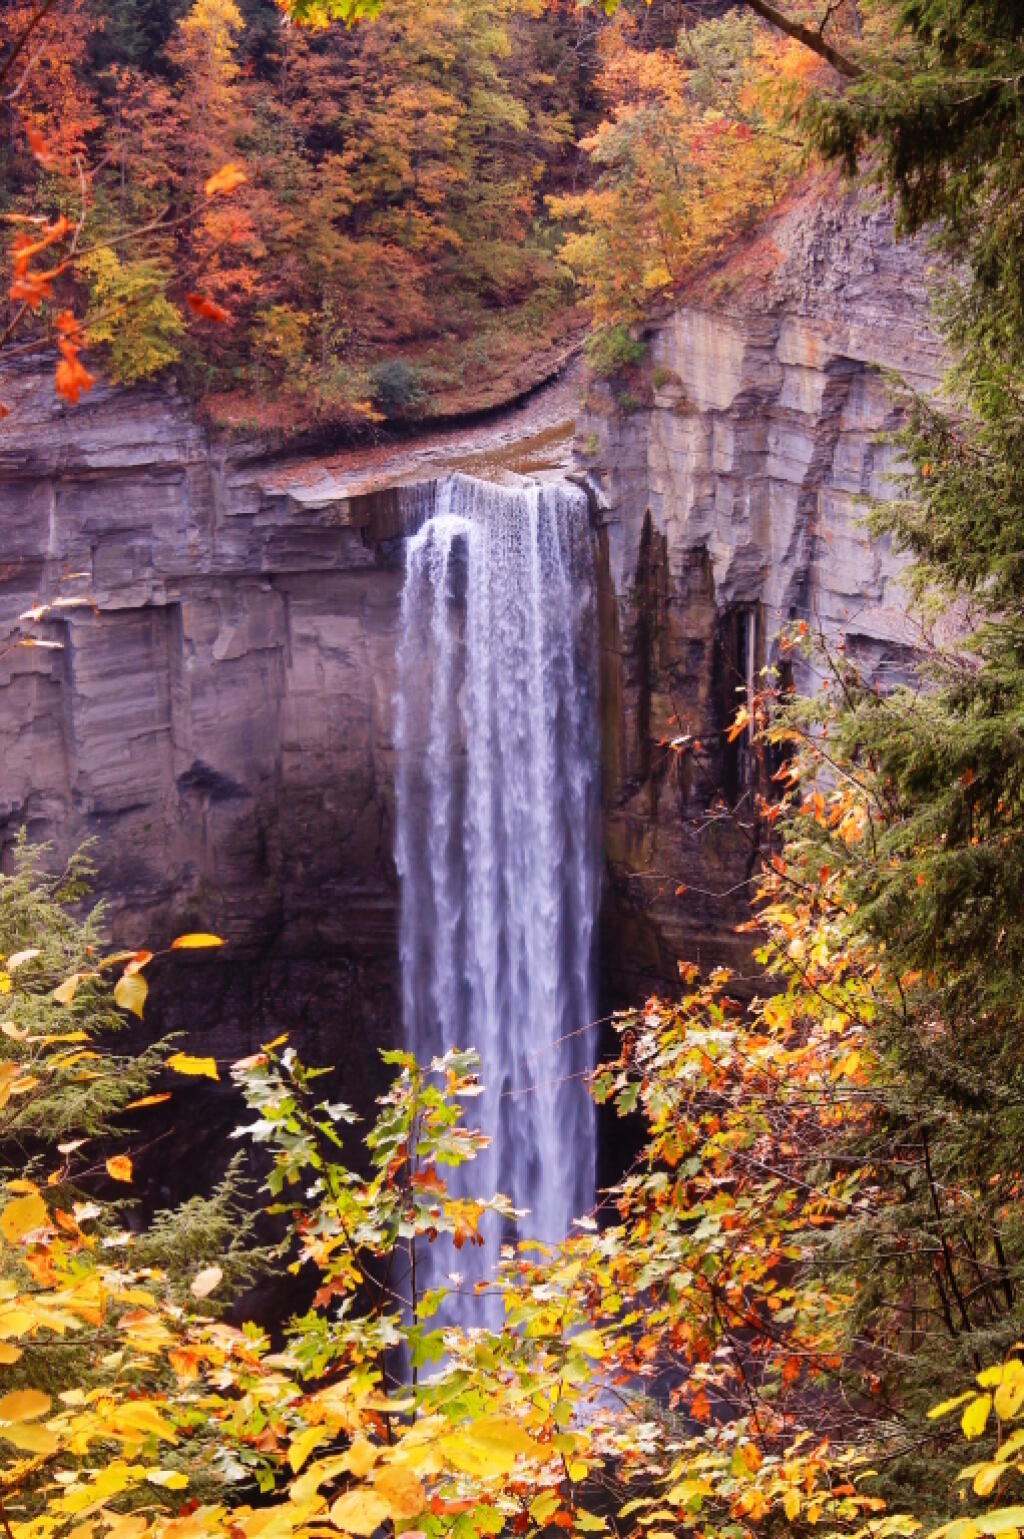
Started along the North Rim trail along the gorge. I was looking for secret places to find isolated, beautiful views of fall, and the hike did not disappoint. I found one perfectly shrouded in colorful fall leaves, but with a view of falls. I snapped a picture. I continued along, and found some good views in the gorge, showing the depth and width it below the falls. Then I ran into Robin Smith and his wife – Twitter and Facebook friend. Chatted for five minutes, then I proceeded on.

A Secret Spot for Observing the Falls

In part, I was in a bit of a rush, trying to find a place to take a piss. All that coffee plus maybe an eye-opener drink wasn’t great for the bladder. There also were a few to many people around to do it right on trail, especially being so close to the road most of way. But eventually I did it, and was on my way.

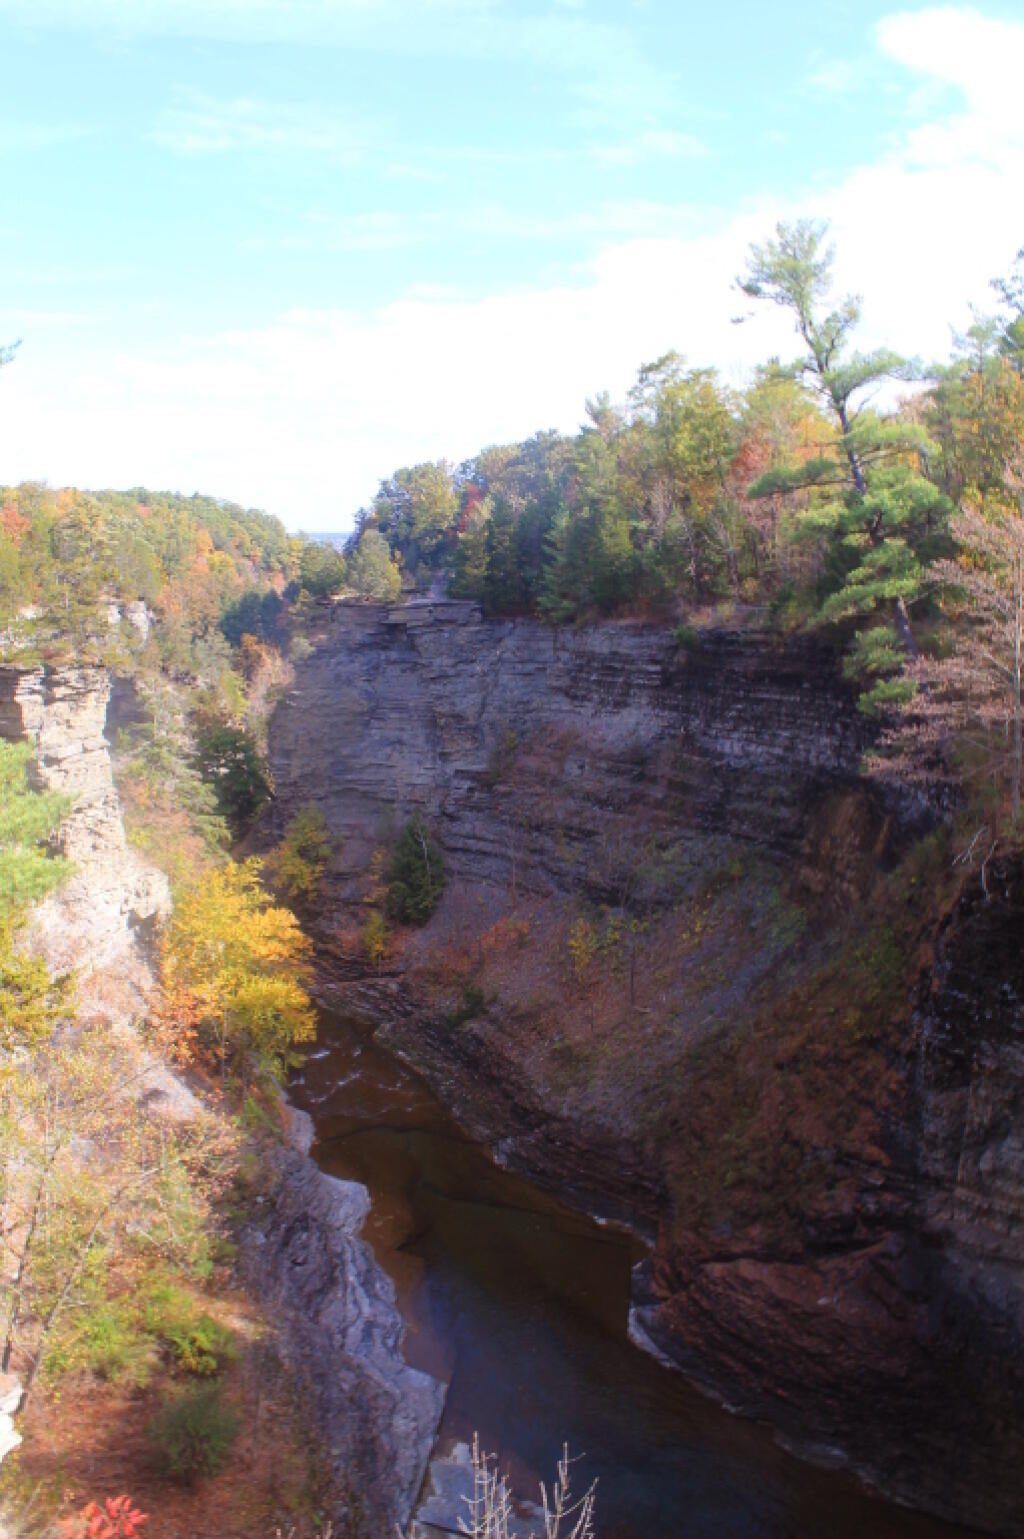
The North Rim trail runs into the Black Diamond Trail, which crosses an old railroad bridge, converted to a hiking trail via some concrete slaps and fence placed on it. The high, old railroad trestle provides views of a smaller, upper waterfalls and the little known, but quite impressive upper gorge. The upper gorge, above the falls, is a deep, narrow, but beautiful gorge where the Taughannock Creek runs, cutting deep into the valley. For the best views, you have to take the South Rim trail, which is what I took next.

Upper Gorge

The South Rim trail is impressive. There is the big parking lot from the Gorge Overlook on Taughannock Road, or you can alternatively take Gorge Road, and halfway down it, park in the smallish pull-off. Don’t miss it though. If you follow the South Rim Trail, there are some views of the gorge below the falls, and one view of the gorge, extending out to Seneca Lake.

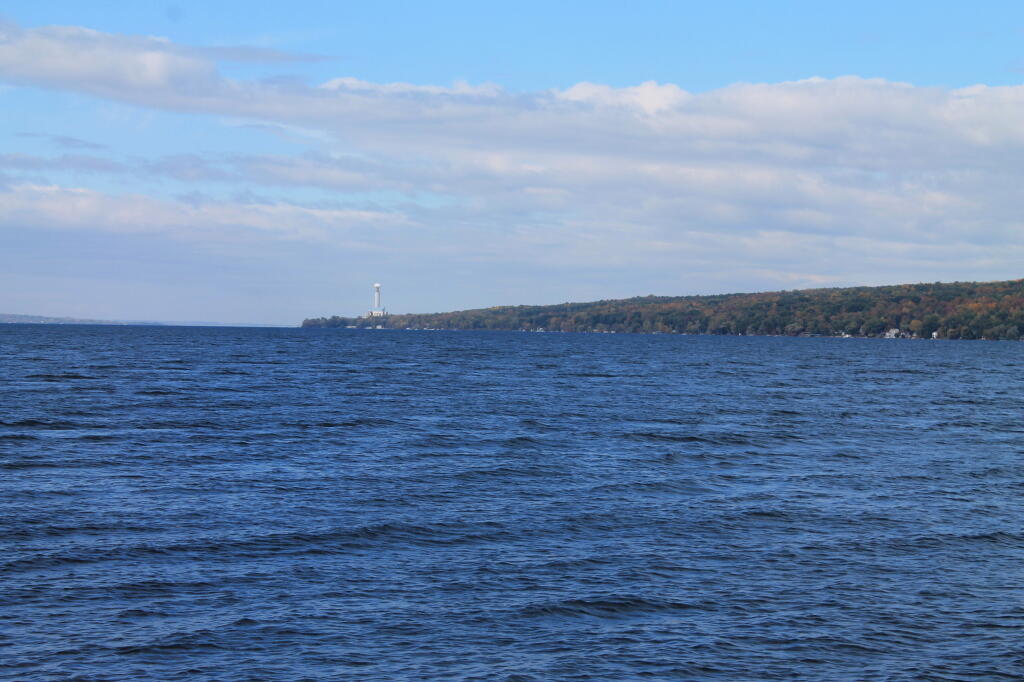
I hiked back to my pickup truck, and then drove down to the main part of Taughannock Falls State Park. I parked in main portion of the park, rather then the always crowded and tight to park in lot next to the trail to Gorge Trail, which runs inside the gorge to below the falls. Not wanting my truck damaged by an overly excited tourist, I figured it’s always safer to park in an empty lot. Walked down to Seneca Lake, and noticed how green the trees were still on the lake shore. This contrasts to sections of US 20, the previous day, where the colors were burnt out to say the least. I was also surprised to see the AES Cayuga in Lansing, across the lake, burning coal today. They must keep in standby for when the line frequency drops to low locally. Stopped in the bathrooms at Taughannock Falls State Park, which were just very gross – clean, but rusty and in old shape – like so many state facilities.

AES Cayuga Coal Plant in Lansing

Then I hiked along the gorge trail to the fall, taking several moments to stop and take photos, and explore the river bed. I had previously been here, in mid-July, but it certainly was different now that fall was in full swing. The trail was popular, and in some places, downright crowded, but the riverbed, at least as far as one could hike, wasn’t nearly as crowded. The gorge walls were pretty with the fall leaves, although by the time I got the falls, the sun was right over the top of the waterfalls, so most of the pictures of the falls came out pretty poorly.

The Falls From Below

Headed back to the truck, then drove down to Ithaca. The traffic was as awful as always in that city. I had stop at the pharmacy, then it was off to Buttermilk Falls State Park. I was surprised they were still charging – the last day must be Columbus Day. By now, it was too late to keep Robert Treman State Park on my list; that will have to wait until tomorrow. This time, I intentionally hiked up the North Rim trail, up to West King Road, then down into the gorge. Last November, I hiked up the gorge, so I figured it would be interesting to go the other way this time.

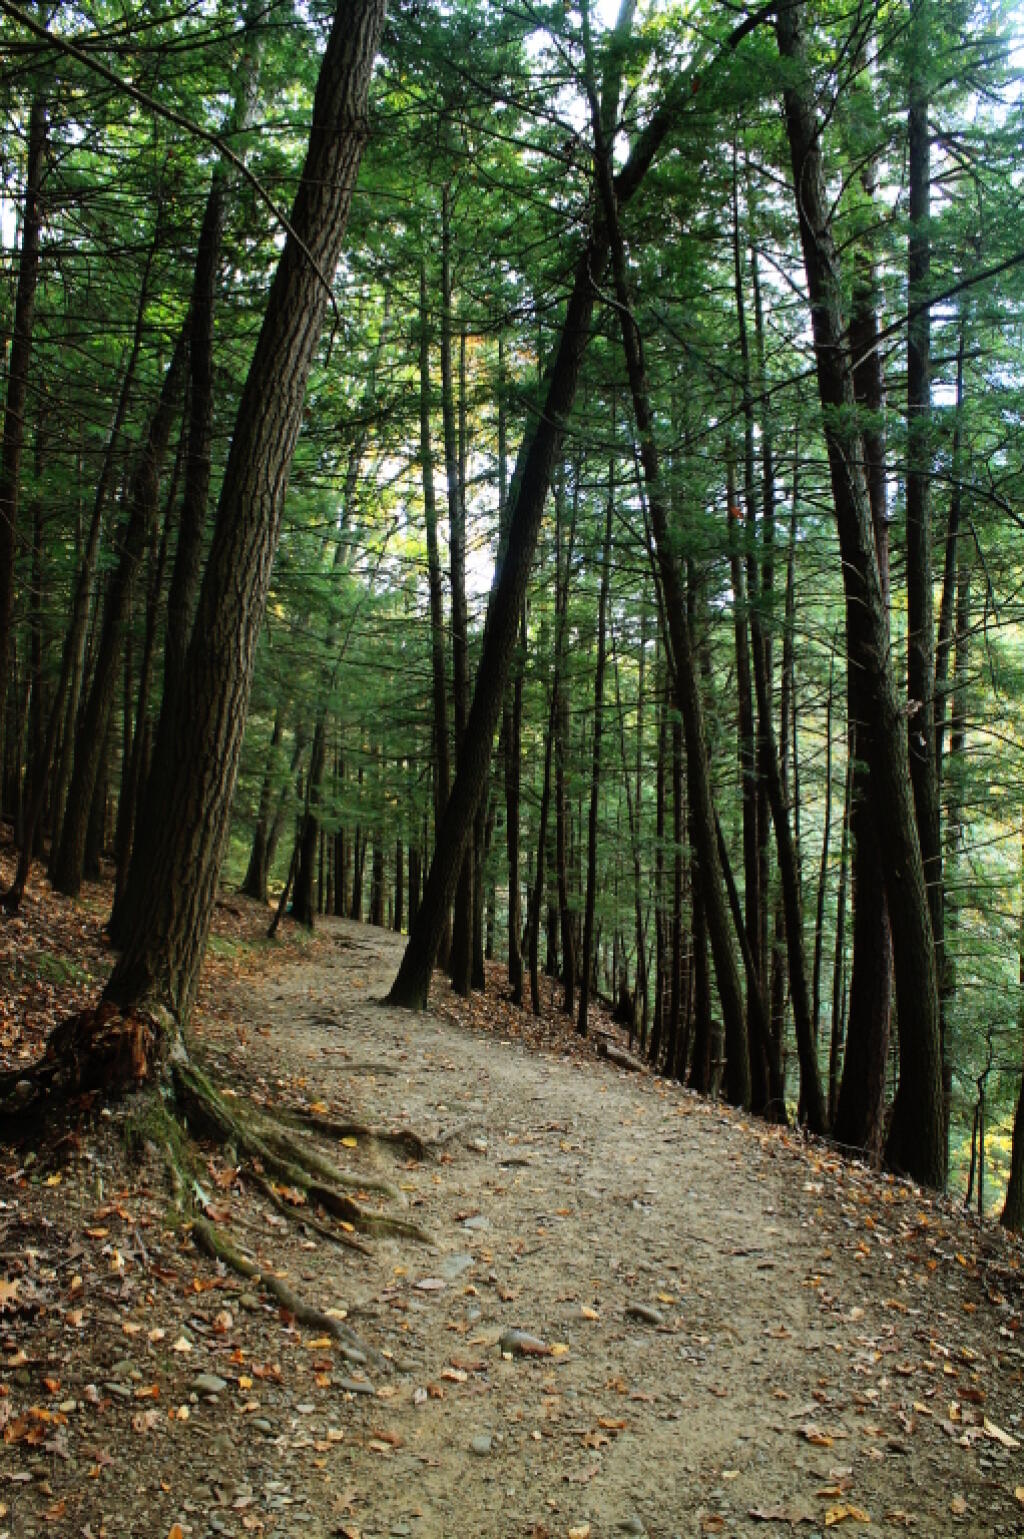
North Rim Trail

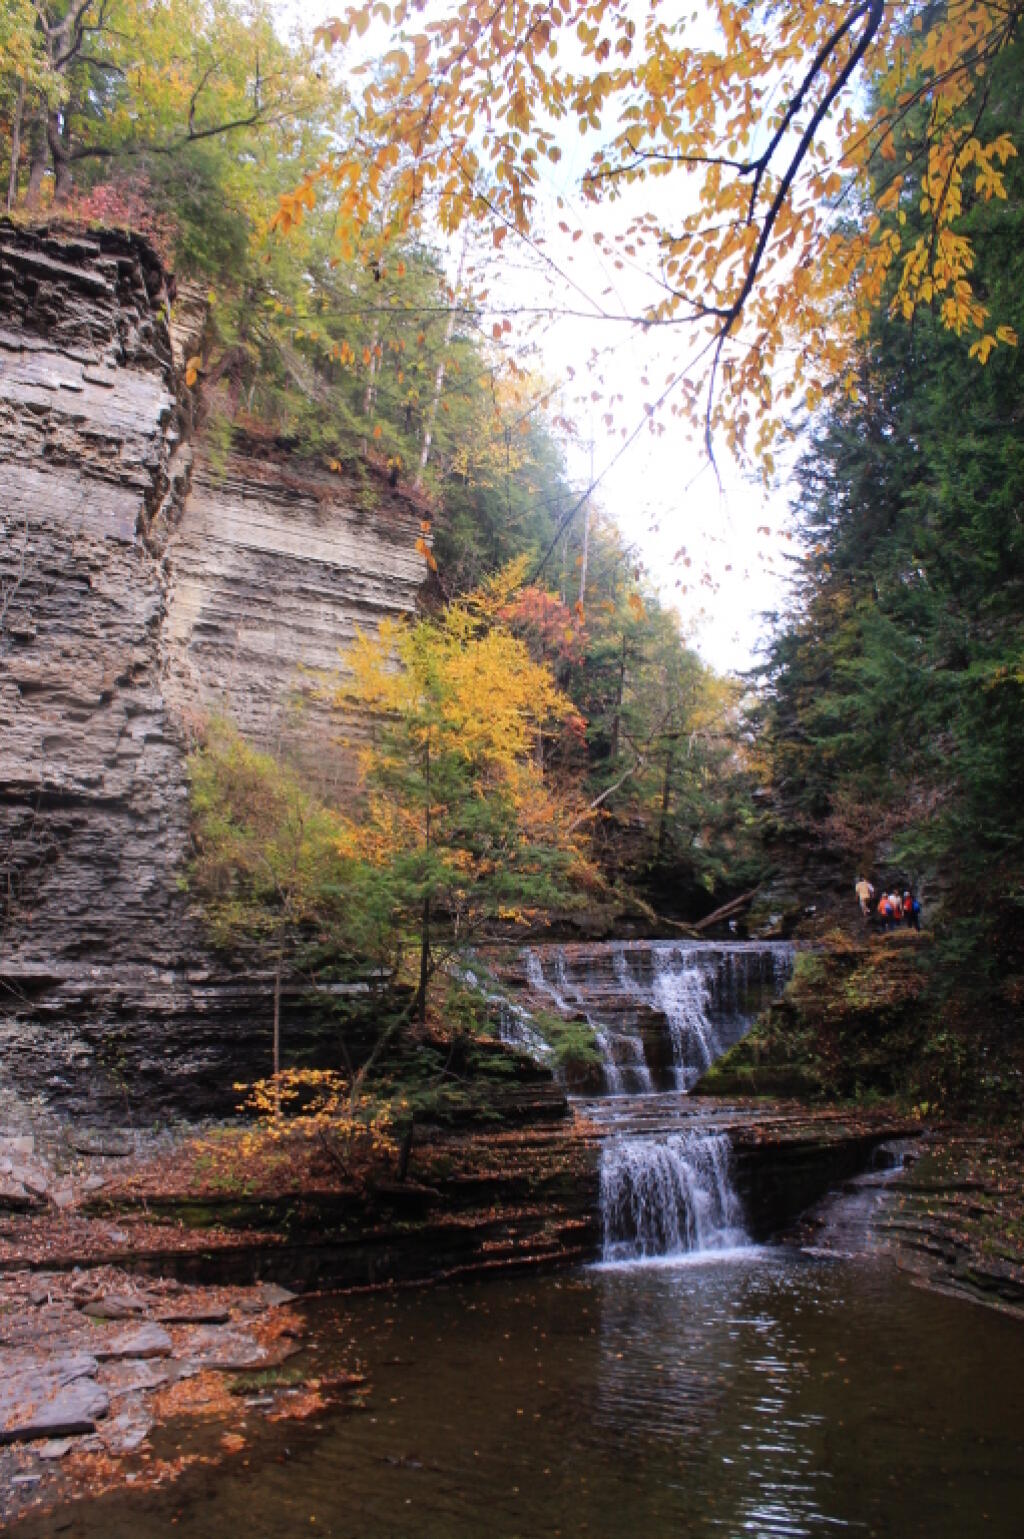
Hiking down Buttermilk Falls was scenic, but not as a scenic as I remember it. Maybe after all this time hiking in gorges and exploring the gorges, they also start to look a bit alike – and we are only day two. It’s more scenic then most of other glens, besides Enfield Glen and Watkins Glen, but it’s still a step below them. The gorge swimming pool at the bottom of the gorge it was nice.

 An Autumn Afternoon at the Falls

It was a good hike, until descending the slippery stairs, I slipped, and dropped my camera, and it fell like 20 feet, hitting a dozen of the stone stairs before coming to a rest. The fall did some serious damage to the camera, as one might expect. The protective UV filter was shattered, the case was cracked up the lens. I was not pleased, to say the least. There may have been a few cuss words. But so be it. The camera was under a drop warranty that I bought when I got it, but I was more worried that the fall would damage the camera, so I would be out of luck for taking more pictures for the rest of the trip.

I might have been pissed at myself for my careless handling and missteps, for a little while, cussed myself out. I was less pissed when I discovered the lens wasn’t destroyed, only the $5 UV filter. The camera seemed to continue to work well, although the flash doesn’t always pop up – a feature I almost never use at any rate. The camera seemed to work okay, and I picked up a second UV filter at Walmart later in the evening. Later in the week, I noticed the automatic focus was sticking – fortunately I have a drop warranty on the lens too. One of these days, I will get around to sending the camera back to the factory for warranty repairs or replacement.

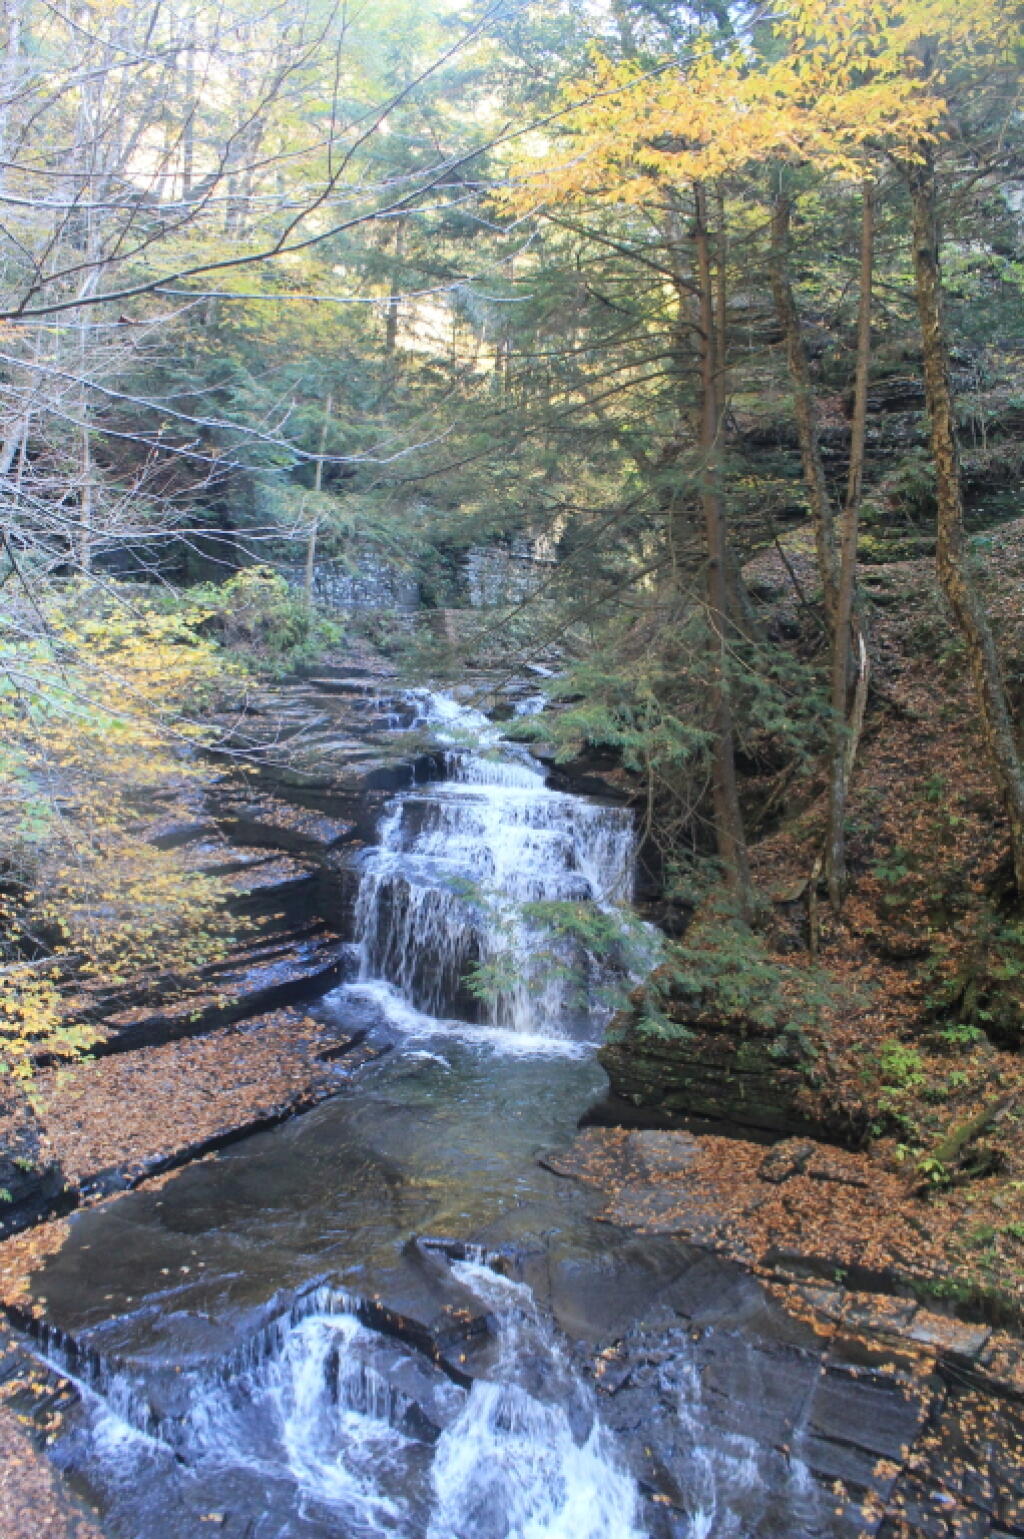
Nice Little Falls

Once I got over the shock, anger, and amusement of smashing up my camera, and got the shattered UV filter off the camera – it took a little fiddling, as the impact of the fall bent the ring – I enjoyed the remaining hike and vistas of falls. Snapped several other quite nice pictures. Went to Walmart to pick up a few supplies, then back to Finger Lakes National Forest, for another evening at camp.

When I drove up to the campsites on Chicken Coop Road, I was pleasantly surprised to find out the campsite I like was vacant. Whoever was the night before packed up, and there was no mess left over. Hung the flag up, set up the table, hung lights up, and gathered wood. Started a campfire, cracked open a beer, had soup and sandwitches for dinner. The colors in the woods were about peak here. Around 6:15 PM, walked across the road, to take a closer look at the cows grazing in the pasture.

Pasture View from Campsite

I stayed up until 8:15 PM, when it started to sprinkle, and quickly turned to a heavier rain, and decided it was time to seek shelter under the truck cap. Again a bit annoyed about the rain, and my stupidity about not setting up a tarp earlier in the evening. I listened to the radio for a bit, played on my cellphone, and retired for the night. The good news was that by morning, the rain would have passed, although the skies would be cloudy, damp, and the temperature only around 47 degrees.

Gorging on Gorges, An Adventure, Day 1

About a month ago, I took a trip I gave the name β€œGorging on Gorges”. As the name would suggest, most of the trip involved visiting various gorges, taking photographs of them, and otherwise exploring them. About half of them I had previously been to, while the rest were new. I also visited several other state parks, state forests, and national forests – and did something I haven’t done in a long time – camped one night in a developed campground.

Towards the Park

I started out my trip from Albany, taking US Route 20 West from I-88. I really wanted to avoid expressways for the bulk of my trip, is my general view is that expressways are the best way to get across America without really seeing anything. It’s more then a philosophical argument for me – what’s the purpose of a vacation if your rushing from point β€œA” to point β€œB”.

The first part of the trip, I drove to Chittenango Falls State Park via Nelson and beautiful farm country so high above. I walked down into the gorge, and up and around the falls. The color was somewhat muted, but it still was quite pretty. Then I headed off, taking some side roads as recommended by my GPS’s most direct route, and ended up passing a few miles from Labrador Hollow and the beautiful Labrador Pond, and said, heck, I got to stop on by there.

I drove down to Labrador Pond parking area, and hiked down to the pond. The colors were still not fully-turned on Jones Hill, but on Labrador Mountain were well past peak. Despite the crowds of fall foliage peepers from Syracuse, crowding the area, there were adequate opportunities for solitude. I walked down to the lake, snapped a few photos, then hiked the nature trail/boardwalk. It was nice. It also was great to see the boardwalk being used by a disabled man – he could get out and enjoy nature, despite his difficulties he had walking. One of the large dairies in the area was spreading something on fields nearby, and it sure stunk – it seemed nastier then fermented grain, although that’s probably what it was. Didn’t stick around too long, as I had places to go.

Somewhat Faded Colors

Drove down through Prebles, another deep, rich agricultural valley, dotted by large dairies that take advantage of the area’s rich soils for producing many bushels of corn on each acre. Got held up for about 5 minutes during a paving job, where they had the road restricted to one lane, for what had to been a half mile or so. Noticed how most of remaining trash burning barrels had disappeared from the landscape, that might have only been there 3 or 4 years ago.

Then it was off to Homer, where I passed a moose, made out of welded scrap metal along the road. It was kind of a neat roadside attraction, and I really should have stopped and got a picture, but I had a tight schedule and was burning daylight. I would come to later regret not getting that picture, but heck, I figure I can probably find a picture of it on the Internet using Google Images or Flickr. If not, it will certainly be there, the next time I find myself going through this roadside wilderness.

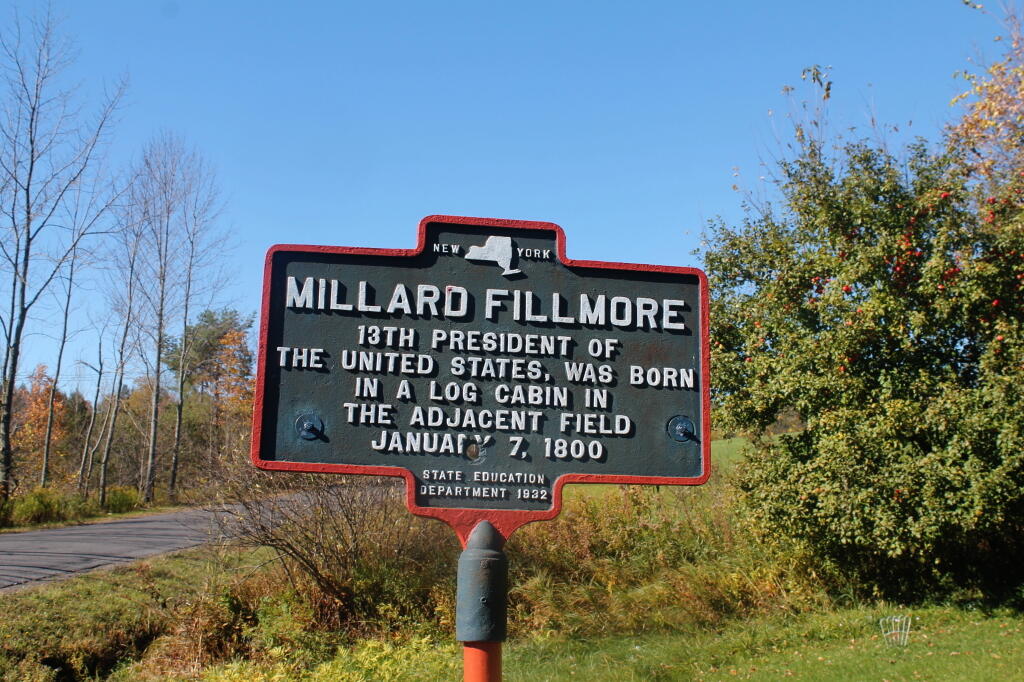
Millard Fillmore Historic Marker

I got lost on my way to Moravia. Not really lost, because I was following the GPS, but because I had programmed the β€œmost direct route” rather then β€œfastest route”, the GPS.decided to take me up a rough dirt road through Hewitt State Forest. I declined, and eventually the GPS found a new route, that happened to take me past Milton Fillmore’s birthplace. There is now a picnic pavilion and a some landscaping in that location. I turned around, snapped a few pictures, and explored it briefly. I wanted to a get a picture for dad for his historical markers collection.

Then it was off to Fillmore Glen. I was running a bit late at this point, but it’s a pleasant drive down to Filmore. The landscape is pretty rural until you drop, rather quickly into Moravia. Moravia is a pretty, small rural town; the glen is located at far southernly end of the town. There was a bridge being replaced in town, and you had to wait, for what seemed like an eternity for the light to green on the on-one lane bridge.

Finally, I got to the park entrance. The older guy there, grumbled when I said I had an Empire Pass. He was like β€œwhere is it – I can’t see it”. The rear window on my truck where the Empire Pass is tinted, but not that dark. I was slightly annoyed that the park entrance guy wasn’t friendly, and I forgot to ask for a map. I was kind of rushing. Got parked, and there was a big wedding going on, complete with horse drawn carriage. Crossed the β€œDry Creek” and started up the trail, first to the Cow Shed falls, then decided to take the Northern Rim Trail. It wasn’t apparent at first that it was the rim trail, but I didn’t have a map. I actually printed up a map, and had it my truck, but I of course forgot it.

Small Waterfall in Gorge

The Northern Rim climbs a fair bit, then runs along the rim, with very limited and occasional views. It crosses a pretty little creek that tumbles down the gorge, and eventually leads to a path down to the gorge trail, three-quarters the way up the gorge. I decided to hike down to the gorge trail, and then head back down the gorge towards the parking area. I missed a bit of the gorge trail, and the overlook, but so be it, time was tight.

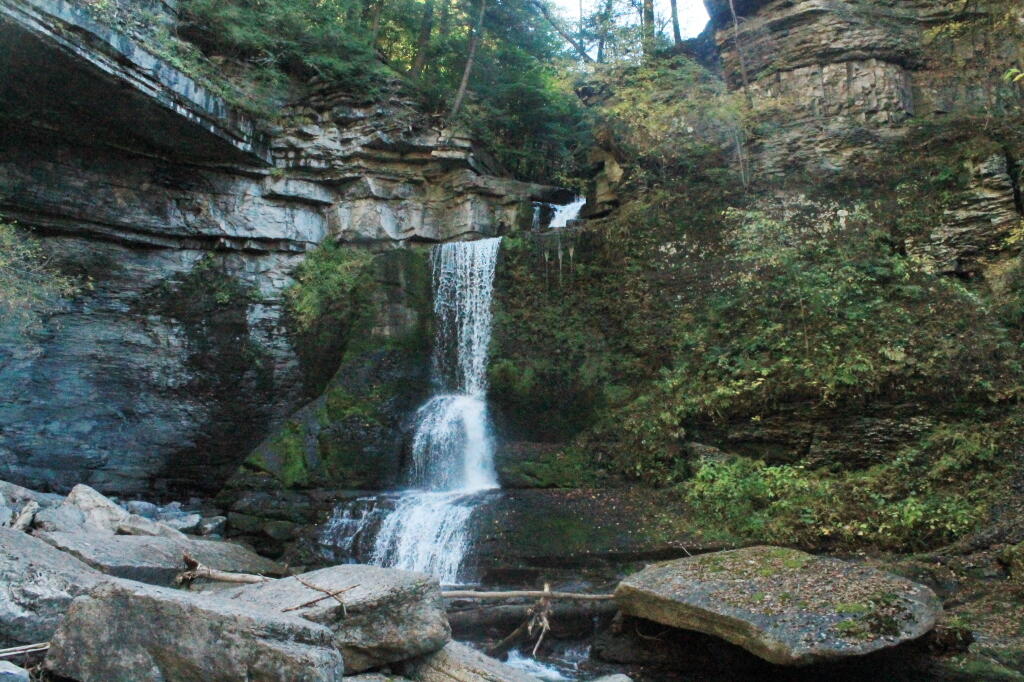
The Gorge trail was scenic, but certainly not the most scenic of gorges. There were several small waterfalls, and some stairs and bridges, although most of the trail was gravel along the edge. The β€œDry Creek” had plenty of water, but in general, the gorges was smaller then other Finger Lake gorges. There were several glens of interest, but the most beautiful portion of the glen was the Cow Sheds in the button of the gorge. Cow Sheds falls, are the wider portion of the gorge, where at one time, historically, cows would gather for shelter in severe or cold weather.

Cow Sheds Falls

Snapped a few more pictures of Fillmore Glen, and it was off to Ithaca. I made pretty good time to Ithaca, although I admit I certainly wasn’t poking along. I really should have stopped more places, but I wanted to get to the Finger Lakes National Forest relatively early so I could set up camp and/or make alternative plans should my desired campsite on Chicken Coop Road be unavailable. Passed a giant bull statue on a farm, along NY 38, a few miles south of Moravia. I really should have stopped for a picture, but I was burning daylight, and the Finger Lakes National Forest, was over an hour away. I think this is the one, that the farmer paid like $10,000 to haul from an abandoned Steakhouse in Binghamton to the farm. I am sure the bull will be there for a long time – in case anybody forgot what is raised on farms.

Then it was down to Freeville.. The only thing real remarkable about that town, was the pine barrens and swamps, consisting of heading into it. When you think of the Finger Lakes, you tend to think open landscapes and farms, at least until you get mostly south of them of them, or in the highest points to the west. But not here. The Finger Lakes Trust owns some land, on the north side, where it the land is mostly the backwaters of the Oswaco Inlet.

Finally made it to Ithaca by 4:45 PM. I was lucky at this hour that traffic wasn’t too much of a slog by Ithaca standards, then I was off heading up Trumansberg Road. It seemed like an endless drive. Finally made it to Perry City, and then to the Finger Lakes National Forest. There was no sign of the government closure when I got there, but a bit disappointed, my favorite campsite on Chicken Coop Road was already taken. It was off to campsite on Potamac Road, just past the hunting camp.

I wasn’t thrilled by campsite, a big field campsite, but it had some trees along one edge for hanging the flag and lights. It was pretty good site for observing the stars, although there was a hunting camp down the road a little ways, so I had to keep the music down. I really don’t want to piss off the hunters. I gathered up some firewood from the woods, and got a fire started. The sun was fading fast, but so be it. I wired up my lights, some Christmas lights, and got the spot light on the flag.

It got dark, and I tuned into the Ithaca Progressive Radio Station, and gazed on the stars for a couple of hours. Nibbled on some snacks, cracked open a beer or two. Tossed some more wood on fire, and was happy to finally be on vacation.

Untitled [Expires August 10 2024]

It was a good first day… more adventures to come.

What Does 100 Miles from the Rapp Road Landfill Look Like?

About a year ago, in the Capital Region Solid Waste Plan, the City of Albany proposed creating a mega-solid waste authority to manage the Solid Waste for most of the Eastern Half of New York State. The plan specifically called for creating a regional authority — to service up to nine counties, and cover an area of 100 miles from the center point of the Rapp Road Landfill.

So I decided to make a map, and run some numbers…

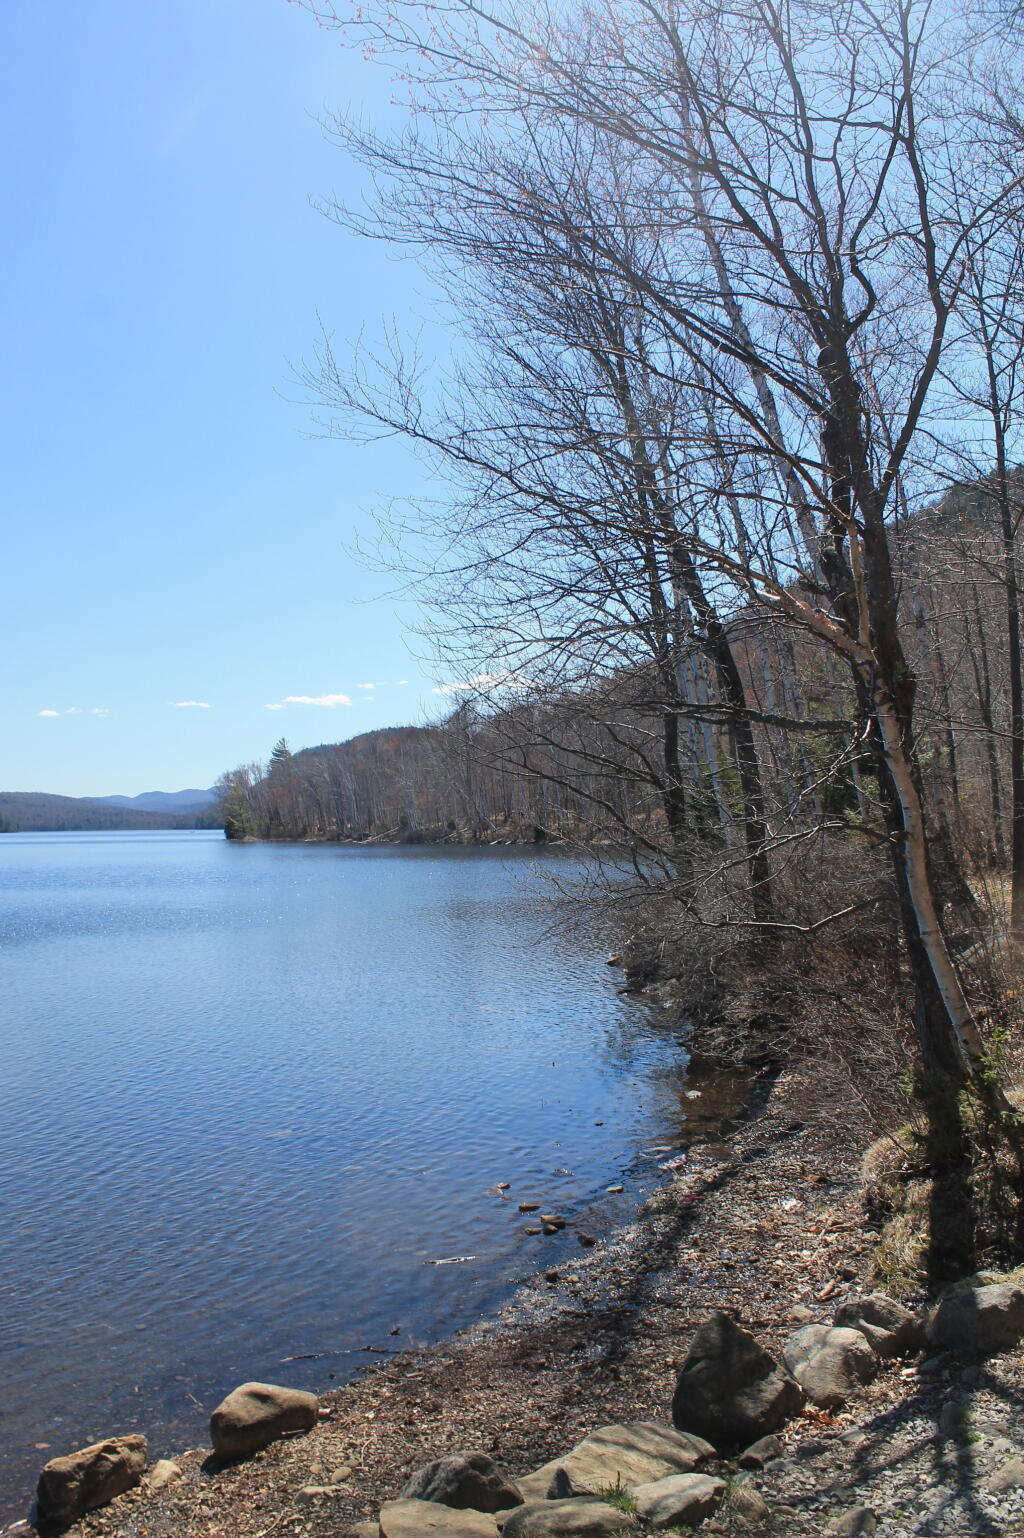
Along the Lake

100 square miles equals roughly 30,500 square miles, with 21,500 sq miles in New York State and 9,000 sq miles out of State — primarily Southern Vermont, but also most of Western Massachussets, roughly 3/4th of Connecicut, and part of Pennsylvania in the Poconos.

In contrast to 30,500 square miles, Adirondack Park “Blue Line” covers roughly 9,100 sq miles in NY State and the Catskill Park “Blue Line” covers roughly 1,100 sq miles. That includes all land within those parks, publicly and privately owned.

That area, within NY State, covers an area were 2,957,993 persons reported residing in the 2010 census.

That is 2.95 million people, or almost 3 million people, a population greater then Manhattan at 1.5 million persons, and even Brooklyn at 2.5 million.

While no one town or city in the proposed in Authorty is particularly large — the City of Albany is the largest population center at 97,856 followed by Colonie at 81,591, the reality is those numbers add up, when you include the 406 towns and cities in NY State that fall within the 100 mile distance from the Rapp Road Landfill.

Large Cities and Towns in Proposed Authority.

Town /City Population
Albany city 97,856
Colonie town 81,591
Schenectady city 66,135
Utica city 62,235
Troy city 50,129
Poughkeepsie town 43,341
Cortlandt town 41,592
Monroe town 39,912
Clifton Park town 36,705
Yorktown town 36,081
Guilderland town 35,303
Carmel town 34,305
Rome city 33,725
Bethlehem town 33,656
Poughkeepsie city 32,736
Warwick town 32,065
Newburgh town 29,801
Glenville town 29,480
Rotterdam town 29,094

All Towns and Cities in NY State within 100 miles of Rapp Road Landfill.

Here is entire list of towns partially or wholely contained in the proposed jurisdiction of the Albany Solid Waste Authority (including large cities and towns listed above)…

Town /City Population Area (sq mi) Pop sq/mi
Albany city 97,856 21 4659.8
Colonie town 81,591 57 1431.4
Schenectady city 66,135 10 6613.5
Utica city 62,235 16 3889.7
Troy city 50,129 11 4557.2
Poughkeepsie town 43,341 31 1398.1
Cortlandt town 41,592 49 848.8
Monroe town 39,912 21 1900.6
Clifton Park town 36,705 50 734.1
Yorktown town 36,081 39 925.2
Guilderland town 35,303 58 608.7
Carmel town 34,305 40 857.6
Rome city 33,725 75 449.7
Bethlehem town 33,656 50 673.1
Poughkeepsie city 32,736 5 6547.2
Warwick town 32,065 105 305.4
Newburgh town 29,801 46 647.8
Glenville town 29,480 50 589.6
Rotterdam town 29,094 36 808.2
East Fishkill town 29,029 57 509.3
Newburgh city 28,866 4 7216.5
Middletown city 28,086 5 5617.2
Queensbury town 27,901 64 436.0
Wallkill town 27,426 62 442.4
Wappinger town 27,048 28 966.0
Saratoga Springs city 26,586 28 949.5
New Windsor town 25,244 36 701.2
Kingston city 23,893 8 2986.6
Peekskill city 23,583 5 4716.6
Montgomery town 22,606 51 443.3
New Hartford town 22,166 25 886.6
Fishkill town 22,107 32 690.8
Niskayuna town 21,781 15 1452.1
Hyde Park town 21,571 39 553.1
Halfmoon town 21,535 33 652.6
Somers town 20,434 32 638.6
Saugerties town 19,482 67 290.8
Whitestown town 18,667 27 691.4
Amsterdam city 18,620 6 3103.3
Milton town 18,575 35 530.7
Southeast town 18,404 34 541.3
Blooming Grove town 18,028 35 515.1
East Greenbush town 16,473 24 686.4
Wilton town 16,173 35 462.1
Cohoes city 16,168 4 4042.0
La Grange town 15,730 40 393.3
Gloversville city 15,665 5 3133.0
Beacon city 15,541 4 3885.3
Thompson town 15,308 87 176.0
Stony Point town 15,059 31 485.8
Malta town 14,765 31 476.3
Moreau town 14,728 43 342.5
Glens Falls city 14,700 3 4900.0
Beekman town 14,621 30 487.4
Shawangunk town 14,332 56 255.9
New Paltz town 14,003 34 411.9
Oneonta city 13,901 4 3475.3
Goshen town 13,687 44 311.1
Kent town 13,507 43 314.1
German Flatts town 13,258 34 389.9
Wawarsing town 13,157 133 98.9
Fallsburg town 12,870 79 162.9
Schodack town 12,794 63 203.1
Kingsbury town 12,671 40 316.8
Cornwall town 12,646 28 451.6
Highlands town 12,492 33 378.5
Lewisboro town 12,411 29 428.0
Ulster town 12,327 28 440.3
Mamakating town 12,085 98 123.3
North Greenbush town 12,075 18 670.8
Patterson town 12,023 32 375.7
Chester town 11,981 87 137.7
Chester town 11,981 25 479.2
Brunswick town 11,941 44 271.4
Putnam Valley town 11,809 42 281.2
Catskill town 11,775 64 184.0
Oneida city 11,393 22 517.9
Woodbury town 11,353 37 306.8
Red Hook town 11,319 40 283.0
Lloyd town 10,863 33 329.2
Plattekill town 10,499 35 300.0
Kirkland town 10,315 33 312.6
Watervliet city 10,254 1 10254.0
Herkimer town 10,175 32 318.0
Liberty town 9,885 80 123.6
Ballston town 9,776 30 325.9
Pleasant Valley town 9,672 33 293.1
Philipstown town 9,662 51 189.5
Rensselaer city 9,392 3 3130.7
Crawford town 9,316 40 232.9
Lenox town 9,122 36 253.4
Esopus town 9,041 41 220.5
Marcy town 8,982 33 272.2
North Elba town 8,957 156 57.4
Coxsackie town 8,918 38 234.7
Marlborough town 8,808 26 338.8
Johnstown city 8,743 4 2185.8
Dover town 8,699 56 155.3
New Scotland town 8,648 57 151.7
Sand Lake town 8,530 36 236.9
Kinderhook town 8,498 32 265.6
Pawling town 8,463 45 188.1
Waterford town 8,423 7 1203.3
Stillwater town 8,287 43 192.7
Deerpark town 7,901 67 117.9
Greenfield town 7,775 67 116.0
Schaghticoke town 7,679 51 150.6
Frankfort town 7,636 36 212.1
Rhinebeck town 7,548 39 193.5
Coeymans town 7,418 53 140.0
Rochester town 7,313 89 82.2
Wawayanda town 7,266 35 207.6
Norwich city 7,190 2 3595.0
Johnstown town 7,098 71 100.0
Mount Hope town 7,018 25 280.7
Hoosick town 6,924 63 109.9
Hudson city 6,713 2 3356.5
Hamilton town 6,690 41 163.2
Cairo town 6,670 60 111.2
Granville town 6,669 56 119.1
Cobleskill town 6,625 30 220.8
Corinth town 6,531 58 112.6
Mayfield town 6,495 64 101.5
Lee town 6,486 45 144.1
Fort Edward town 6,371 27 236.0
Hurley town 6,314 35 180.4
Verona town 6,293 69 91.2
Windsor town 6,274 93 67.5
Fort Ann town 6,190 111 55.8
Westmoreland town 6,138 43 142.7
Duanesburg town 6,122 71 86.2
Rosendale town 6,075 20 303.8
Claverack town 6,021 47 128.1
Woodstock town 5,884 67 87.8
Sidney town 5,774 50 115.5
Pittstown town 5,735 64 89.6
Gardiner town 5,713 43 132.9
Saratoga town 5,674 42 135.1
Marbletown town 5,607 55 101.9
Greene town 5,604 75 74.7
Walton town 5,576 97 57.5
Amsterdam town 5,566 30 185.5
Hamptonburgh town 5,561 26 213.9
Vienna town 5,440 95 57.3
Vernon town 5,408 37 146.2
Ghent town 5,402 45 120.0
Broadalbin town 5,260 39 134.9
Eaton town 5,255 45 116.8
Colesville town 5,232 79 66.2
Oneonta town 5,229 33 158.5
Mechanicville city 5,196 0
Delhi town 5,117 64 80.0
North Salem town 5,104 22 232.0
Northumberland town 5,087 32 159.0
Ticonderoga town 5,042 88 57.3
Little Falls city 4,946 3 1648.7
Greenwich town 4,942 44 112.3
Union Vale town 4,877 37 131.8
Moriah town 4,798 71 67.6
Nassau town 4,789 45 106.4
Washington town 4,741 58 81.7
Boonville town 4,555 72 63.3
Poestenkill town 4,530 32 141.6
Trenton town 4,498 43 104.6
Minisink town 4,490 23 195.2
Amenia town 4,436 43 103.2
Olive town 4,419 65 68.0
Paris town 4,411 31 142.3
Unadilla town 4,392 46 95.5
Minden town 4,297 51 84.3
Deerfield town 4,273 33 129.5
Bethel town 4,255 90 47.3
Greenport town 4,165 20 208.3
Charlton town 4,133 32 129.2
Chatham town 4,128 53 77.9
Warrensburg town 4,094 64 64.0
Athens town 4,089 28 146.0
Sherburne town 4,048 43 94.1
Whitehall town 4,042 58 69.7
Norwich town 3,998 42 95.2
Oxford town 3,901 60 65.0
Otsego town 3,900 59 66.1
Mohawk town 3,844 35 109.8
Stanford town 3,823 50 76.5
Floyd town 3,819 34 112.3
Argyle town 3,782 57 66.4
Rockland town 3,775 95 39.7
Middletown town 3,750 97 38.7
Middleburgh town 3,746 49 76.4
Greenville town 3,739 39 95.9
Greenville town 3,739 30 124.6
Canajoharie town 3,730 43 86.7
Livingston town 3,646 38 95.9
Perth town 3,646 26 140.2
Tuxedo town 3,624 49 74.0
Copake town 3,615 42 86.1
Neversink town 3,557 86 41.4
Galway town 3,545 45 78.8
Lake George town 3,515 32 109.8
Schuyler town 3,420 40 85.5
New Baltimore town 3,370 43 78.4
Westerlo town 3,361 58 57.9
White Creek town 3,356 48 69.9
Lake Luzerne town 3,347 54 62.0
Manheim town 3,334 29 115.0
Bainbridge town 3,308 34 97.3
Palatine town 3,240 41 79.0
Hancock town 3,224 161 20.0
Schoharie town 3,205 29 110.5
Otego town 3,115 45 69.2
Shandaken town 3,085 120 25.7
Sherrill city 3,071 2 1535.5
Callicoon town 3,057 48 63.7
Milford town 3,044 47 64.8
North East town 3,031 43 70.5
Annsville town 3,012 60 50.2
Madison town 3,008 41 73.4
Davenport town 2,965 52 57.0
Guilford town 2,922 61 47.9
Stephentown town 2,903 58 50.1
Afton town 2,851 46 62.0
Stockport town 2,815 13 216.5
Berne town 2,794 64 43.7
Hunter town 2,732 90 30.4
Durham town 2,725 49 55.6
Salem town 2,715 52 52.2
Florida town 2,696 51 52.9
Knox town 2,692 41 65.7
New Berlin town 2,682 46 58.3
Delaware town 2,670 35 76.3
Northampton town 2,670 34 78.5
St. Johnsville town 2,631 17 154.8
Green Island town 2,620 0
Richmondville town 2,610 30 87.0
Russia town 2,587 60 43.1
Sangerfield town 2,561 30 85.4
Brookfield town 2,545 78 32.6
Highland town 2,530 52 48.7
Glen town 2,507 39 64.3
Roxbury town 2,502 87 28.8
Pine Plains town 2,473 31 79.8
Lumberland town 2,468 49 50.4
Laurens town 2,424 42 57.7
Franklin town 2,411 81 29.8
Sanford town 2,407 91 26.5
Johnsburg town 2,395 206 11.6
Richfield town 2,388 32 74.6
Milan town 2,370 36 65.8
Easton town 2,336 63 37.1
Bolton town 2,326 90 25.8
New Lebanon town 2,305 35 65.9
Newport town 2,302 32 71.9
Hartford town 2,269 43 52.8
Stamford town 2,267 48 47.2
Worcester town 2,220 46 48.3
Marshall town 2,131 32 66.6
Grafton town 2,130 45 47.3
Princetown town 2,115 24 88.1
Middlefield town 2,114 63 33.6
Hartwick town 2,110 40 52.8
Stockbridge town 2,103 31 67.8
Winfield town 2,086 23 90.7
Colchester town 2,077 142 14.6
Esperance town 2,076 20 103.8
Hadley town 2,048 41 50.0
Stuyvesant town 2,027 26 78.0
Crown Point town 2,024 81 25.0
Cambridge town 2,021 36 56.1
Augusta town 2,020 27 74.8
Lincoln town 2,012 25 80.5
Providence town 1,995 45 44.3
Nelson town 1,980 44 45.0
Clermont town 1,965 19 103.4
Salisbury town 1,958 108 18.1
Germantown town 1,954 13 150.3
Western town 1,951 54 36.1
Carlisle town 1,948 34 57.3
Remsen town 1,929 36 53.6
Hillsdale town 1,927 48 40.1
Oppenheim town 1,924 56 34.4
Maryland town 1,897 51 37.2
Watson town 1,881 116 16.2
Berlin town 1,880 59 31.9
Morris town 1,878 39 48.2
Hebron town 1,853 56 33.1
Sharon town 1,846 39 47.3
Rensselaerville town 1,843 62 29.7
Edmeston town 1,826 44 41.5
Webb town 1,807 484 3.7
Plymouth town 1,804 42 43.0
Jackson town 1,800 37 48.6
Butternuts town 1,786 53 33.7
Leyden town 1,785 33 54.1
North Norwich town 1,783 28 63.7
Seward town 1,763 36 49.0
Fenner town 1,726 31 55.7
Root town 1,715 51 33.6
Deposit town 1,712 44 38.9
Canaan town 1,710 36 47.5
Windham town 1,703 45 37.8
Ashland town 1,695 25 67.8
Ephratah town 1,682 39 43.1
Kortright town 1,675 62 27.0
Gallatin town 1,668 39 42.8
Coventry town 1,655 48 34.5
Schroon town 1,654 141 11.7
Austerlitz town 1,654 48 34.5
Fairfield town 1,627 41 39.7
DeRuyter town 1,589 31 51.3
Little Falls town 1,587 22 72.1
Columbia town 1,580 35 45.1
Harpersfield town 1,577 42 37.5
Ancram town 1,573 42 37.5
Wright town 1,539 28 55.0
Forestport town 1,535 78 19.7
Meredith town 1,529 58 26.4
Petersburgh town 1,525 41 37.2
West Turin town 1,524 102 14.9
Bridgewater town 1,522 23 66.2
Tusten town 1,515 48 31.6
Litchfield town 1,513 30 50.4
Fulton town 1,442 65 22.2
Jefferson town 1,410 43 32.8
Horicon town 1,389 71 19.6
Lewis town 1,382 65 21.3
Charleston town 1,373 42 32.7
Cochecton town 1,372 37 37.1
Pittsfield town 1,366 38 35.9
Springfield town 1,358 45 30.2
Indian Lake town 1,352 266 5.1
Lebanon town 1,332 43 31.0
Smithville town 1,330 50 26.6
Hamden town 1,323 60 22.1
Masonville town 1,320 54 24.4
Westport town 1,312 66 19.9
Taghkanic town 1,310 40 32.8
Gilboa town 1,307 59 22.2
Andes town 1,301 112 11.6
Smithfield town 1,288 24 53.7
Smyrna town 1,280 42 30.5
Tompkins town 1,247 104 12.0
Lyonsdale town 1,227 70 17.5
Cherry Valley town 1,223 40 30.6
Thurman town 1,219 92 13.3
Edinburg town 1,214 67 18.1
Caroga town 1,205 54 22.3
Greig town 1,199 94 12.8
Elizabethtown town 1,163 83 14.0
Summit town 1,148 37 31.0
Warren town 1,143 38 30.1
Burlington town 1,140 45 25.3
New Lisbon town 1,114 44 25.3
Keene town 1,105 156 7.1
Steuben town 1,100 42 26.2
Otselic town 1,054 38 27.7
Preston town 1,044 35 29.8
Danube town 1,039 29 35.8
Fremont town 1,008 51 19.8
Ohio town 1,002 307 3.3
Exeter town 987 32 30.8
Columbus town 975 37 26.4
Georgetown town 974 40 24.4
Broome town 973 48 20.3
Jewett town 953 50 19.1
Hampton town 938 22 42.6
Plainfield town 915 29 31.6
Kingston town 889 7 127.0
McDonough town 886 39 22.7
Westford town 868 33 26.3
Day town 856 69 12.4
Forestburgh town 819 56 14.6
Minerva town 809 160 5.1
Lexington town 805 79 10.2
Pitcher town 803 28 28.7
Lake Pleasant town 781 198 3.9
Stony Creek town 767 83 9.2
Norway town 762 35 21.8
Stark town 757 31 24.4
Clinton town 737 38 19.4
Conesville town 734 40 18.4
Long Lake town 711 449 1.6
Roseboom town 711 33 21.5
Prattsville town 700 19 36.8
Hague town 699 80 8.7
Ava town 676 37 18.3
Wells town 674 177 3.8
Dresden town 652 54 12.1
Bovina town 633 44 14.4
Stratford town 610 76 8.0
Putnam town 609 35 17.4
Pharsalia town 593 39 15.2
Denning town 551 105 5.2
Bleecker town 533 59 9.0
Newcomb town 436 233 1.9
Hope town 403 41 9.8
Lincklaen town 396 26 15.2
Blenheim town 377 34 11.1
Decatur town 353 20 17.7
Inlet town 333 66 5.0
Arietta town 304 329 0.9
Halcott town 258 23 11.2
North Hudson town 240 185 1.3
Hardenburgh town 238 80 3.0
Benson town 192 83 2.3
Morehouse town 86 194 0.4
Total 2,957,993 21,462 386.0

Making Maps of Round Lake Wilderness in QGIS

You are thinking about going to the Round Lake Wilderness for a Canoe Trip. You would like a map, but don’t want to spend $10 bucks to buy one, when you get a better looking map for free with more accurate data from the NYS Department of Environmental Conservation and NYS Department of Transportation, using a free GIS program known as Quantum GIS or “QGIS” for short. When you are done with this tutorial, you will end up with a map that looks like this.

Fermented

QGIS like all GIS programs can seamlessly glue together multiple topographic quadrangles (such as the Sabbist and Little Tupper Lake quads needed for this map), and then superimpose campsites, trails, and other data you need β€” that might not be available on a typical topographic map. As your printing your own map, you don’t have to worry about keeping it dry or keeping it from getting damaged.

All GIS software is highly technical and a bit complicated to use. Putting together a good map is a fair bit of work, but once you master it, you will be able to put together quite nice looking maps. I hope this rather length fodder article will send you on your way to making good maps of NY State.

Step 1: Download and Install QGIS.

First you need to download a free copy of the open-source Quantum GIS program from QGIS.org. It runs on Windows, Linux, or Mac OS X and is relatively easy to install. Then open QGIS on up. It will look something like this, depending how many plugins you have installed and your version of QGIS.

Hint: Save your work regularly when working in QGIS by going to File -> Save Project menu. It’s always good to save regularly in any GIS program, as your dealing with large files, and its always possible that QGIS could crash, and you would lose your work.

Step 2: NYS DOT Topographic Index.

Next, you will need to get some data to fill up that blank screen. You will probably want to go the NYS GIS website and download the 7.5 minute topographic index (aka 1:24,000 scaled topographic maps). This “Shapefile” β€” a file containing data used to draw shapes, dots, or lines in a Geographic Information System (GIS) program β€” contains an overview map of NY State, with boxes representing each of the 965 7.5 minute topographic maps that make up NY State.

NY 1:24,000 Topographic Map Coverage Index Shapefile. (90 KB) Contains the outlines of all 965 7.5′ topographic maps in NY State. Freely available from NYSGIS Website, under the Digital Raster Quadrangles.

Download, expand, and open the NYSDOT Topographic Map. You can open it in QGIS by using Vector -> Add Vector Layer.

7.5 minute topographic maps are the most accurate topographic maps typically available. The NYS Department of Transportation provides high-resolution, 509 DPI, scans of all 965 topographic maps it creates. Each scanned in map is in a file called a “GeoTIFF”, and is divided into 3 or four files, consisting of each color used on a standard DOT topographic map.

Step 3: Projection.

It’s Very Confusing, BUT VERY IMPORTANT!!

When you load that 7.5 minute topographic index into QGIS, you might be surprised to see how that map is distorted, and does not look like the map above. This is because the earth is not a flat surface, and there are many ways to draw a map of the earth, to reflect the curvature of the earth. We call that the projection of the map β€” how we project a curved surface on a flat sheet of paper or a flat screen.

There are actually thousands of ways to project the surface of the earth, such as unprojected latitude and longitude (called WGS84) that squashes north and south on maps, regular Mercator which puts things on an even latitude or longitude on a flat plain (NY State appears with a flat border along Pennsylvania at the 42nd parallel), and Universal Transverse Mercator (UTM), which most accurately shows distance and relative position of items, at the cost of over distance appearing somewhat distorted.

For all your New York State mapping projects, you are only going to use one projection β€” Universal Transverse Mercator (UTM) Zone 18. This is one set in official state regulations as what all state agencies are supposed to use, and it’s what NYSDOT Topographic maps are drawn in. For your adventures in making maps for hiking, camping, hunting, fishing, and boating, your going to want to always use NAD83 / UTM Zone 18N in NY State.

Go to File -> Project Properties, and click on the Coordinate Reference System (CRS) tab. Browse through the list for NAD 83 / UTM Zone 18N. Click on “Enable ‘On the Fly CRS Transformation”.

Clarification. Then click the triangle next to Projected Coordinate Systems, then click the triangle next to Universal Transverse Mercator, then scroll down to NAD 83 / UTM Zone 18N (ESPG:26918). Alternatively on the search box on that same page, search for Authority: All, Search for: ID, and enter in 26918. QGIS will remember your settings and default to this projection for future projects.

To ensure everything is projected in NAD 83 / UTM 18N, make sure to Enable ‘On the Fly’ CRS Transformation. QGIS will automatically convert “Shapefiles” and other vector data into the proper projection. QGIS can not do this for scanned in images or similar “raster” data.

Check and recheck to make sure you did this projection step correctly. Otherwise, you will get messed up maps, and you will get lost. Confusing, definitely but the most important step.

Step 4: Now Let’s Load Some Data.

Shapefiles and vector data are all loaded in the same way. You download the file, expand it, and load it into QGIS. Here are some Shapefiles I recommend you download and load into QGIS:

DEC Lands Outlines Shapefile. (5.4 MB) Contains the outlines of all lands under the control and jurisdiction of the Department of Environmental Conservation. Does not include Town Parks, Canal Authority Parks, Parks Maintained by Office of Parks, Recreation, and Historic Preservation. Also does not include Conservation Easements. Freely available from NYSGIS Website, under the DEC Section.

DEC Roads and Trails Shapefile. (5.8 MB) Contains many of the roads and trails maintained by the DEC. Does not include local, county, or state roads, and in some regions of state, there is no trail data available. Freely available from NYSGIS Website, under the DEC Section.

DEC Physical Assets Shapefile. (0.2 MB) Contains many of the physical facilities maintained by DEC β€” specifically lean-tos, back country campsites, boat launches, fishing docks, firetowers, etc. This is available using a Freedom of Information Law Request. The DEC will send it to you in 5 days, if you email the Records Access Officer. I have put a copy of this file on my blog, of the exact form I got it back from the DEC, to allow you to avoid unnecessary FOIL requests.

OpenStreet Map: NY State Shapefile. (105 MB) I found this some time ago on a now defunct website and have made several modifications to it over the years. It is freely available data, originally based on US Census TIGER lines, but with certain modifications, such as removing certain roads from wilderness areas. One should consider it public domain as it’s just US Census data, and you are free to edit and redistribute it. You can download my copy from this blog.

Once you load the data into QGIS you should be able to zoom in and explore the map, and get a general idea of what area you are interested. The random colors chosen by QGIS to display this data are pretty hideous, but we will change them in a bit.

Zoom into the area you interested in, by looking at the general outlines of the public lands. You can use the maganifying glass to zoom in, the hand to move around, and the cursor next to the (i) icon, to display information about various features.

Step 5: NYSDOT Topographic Maps.

Next we need to figure what NY State Department of Transportation (NYSDOT) 7.5″ topographic maps we will need to make a “base” map of Round Lake. Click the cursor next to the (i) icon, then onto the the map, where you need to figure out what topographic map you want. As I see from the results, I will need the Sabbatist Quadrangle (among 4 others nearby), which is available from NYSGIS.

NYSDOT Topographic GeoTIFFs at 1:24,000 Scale. (2 MB per quad) There are 965 quads in NY State. The NYSDOT topos have the most up to date roads on them, and come with each color layer seperate. The average file is about 2 MB. I downloaded the whole set from their FTP site, but you can download only the ones you need at first, but having the full set sure is convient.

NYSDOT Topographic Maps are scanned at 508 DPI, and are georeferenced NAD 83 / UTM 18N GeoTIFF images, that QGIS will automatically position on map for you to create a seamless map across data layers, as long as you properly set the projection in QGIS in Step 2. Maps will line up perfectly, even a certain map consists of many different quadrangles.

I do not recommend the USGS Digital Raster Graphic (DRG) Quadrangles. They are typically older, use the obsolete UTM 18 / NAD 27 coordinate system, and do not have individual files for each color layer. Moreover, the 1:100,000 Digital Raster Quadrangles and 1:250,000 Digital Raster Quadrangles, do not have the needed resolution (detail) for doing hiking or other outdoor maps. If your doing a broad overview maps β€” like for spotting peaks off a firetower, they might be useful, but not for general use.

Each NYSDOT Topographic Map consists of 4 different black and white GeoTIFF images. There is no transparency data in this maps, nor any color in them. You are free to set transparency or color as you please. They are as follows:

  • plan – Man made features and labels such as roads or mountain names. May also include unnavigable streams, borders on lakes, etc. Anything that would be printed black on the NYSDOT topographic map.
  • hyd – Lakes and navigable waterways. Anything that would be printed light blue on the NYSDOT topographic map.
  • topo – Topographic lines showing general elevation and slope. Anything that would be printed light brown (color of topographic lines) on the NYSDOT topographic map
  • bua – Built Up Area, background. Areas that have a lot of development, such as cities. Anything that would be printed light pink or yellow on a NYSDOT topographic map. I usually don’t use this layer, not found in rural quads.

You can load them using the Layer Menu -> Add Raster Layer, menu item. Using the control key, you can load multiple files at one. I try to load all the layers I will need at once, as it can take time to load layers, and it’s good to get it done at once.

Remember, these are scanned in images or pictures of the topographic maps, they can not be easily edited or queried in QGIS. Zoom in too far, and they become pixelated. Yet, they usually provide an excellent back drop for outdoors maps.

When you first load one of these maps, you will see a picture like this. The topographic layers for some reason chose to load first, and appear on top, and with no color or transparency set, they are pretty useless out of the box.

Typically you will want to arrange the topographic layers, so that the plan layers are on top, followed by the hyd layers, then the topo layers, and finally the bua layers. With the plan layer up top, the map will start to make a little bit more sense, give you a better idea if you loaded the proper quads.

Next you will want to go through every GeoTIFF Topographic Map layer you have uploaded, and change white to transparent. You do this by right clicking on each layer, and choosing Properties. Then click on the Transparency tab in the Layers Properties dialog that comes up.

Double click on -32768.00 on the Indexed Value column, and change it to 0. This will make all white portions of the map 100% transparent. NYSDOT Topographic Maps do not contain any useful transparency data, so you will want to make all white areas in the map transparent.

If you are working on a hyd layer, topo layer, or bua layer, you will want to go the color map layer, and change the color for value 1.00000 by double clicking on the color next to it. Black is the default color, but that isn’t helpful except for the plan layer. You need not change the 0.0000 color, as you have already set that to be transparent, and it will not be visible on the map.

Then click OK, and the dialog will close, and transparency and colors will be visible on the map layer you just changed. Besides those awful background colors, the map that is being displayed starts to look a lot more useful now.

Right click on NYS_QuadIndex and choose Properties. Go to the Style tab. While we really do not have to use this layer any more, and could just disable it by unchecking it, I like to use it as a yellow background to indicate non-DEC lands on a map. To do this, click on the color box next to Fill Options, and set it to light yellow, as I did, or whatever color you want to represent private lands. Then go to Outline Options and choose an invisible line, to hide the quad boundaries.

It’s now starting to look a little better.

Now it we do the same with DEC Lands Outlines, setting it white or whatever color you prefer. Make sure it’s dragged above NYS Quad Index on the Layers, but below the Topographic Maps. I prefer no borders to be shown, as I find DEC boundaries to be confusing, as often Wilderness borders Wild Forest or Primitive Areas, leading to strange lines appearing in the maps. If you care about such borders, do leave them on though.

Now you got a map that is almost ready for use, that is once we delete roads that we know don’t really exist in a wilderness area, stylize campsites versus other facilities, stylize roads versus hiking trails, and maybe add some labels.

Step 6: Stylizing Roads versus Trails.

I like to make hiking trails a dashed black line of 0.75 map units, and roads a solid black line of 0.75 map units. This ensures on black and white printers one can tell the difference. To do this, right click on DEC Road and Trails, then the Style tab. From here, choose Unique Value from Legend Type.

We will use the MOTORV field to decide if something is a road or a hiking trail. Obviously, if this was a winter map, we might change this field to SNOWMOBILE or X-COUNTRY SKI. This field contains, ‘Y’, ‘N’, ‘M’, ‘U’, and sometimes ‘YES’, ‘NO’, depending on the forest ranger that inputed the data. Set the style as you wish.

Choose classification field MOTORV, then click the classify button. All of the different possibilities for roads or trails allowing motor vehicles will be shown. From there, set the colors and line styles as you so choose.

Step 7: Removing Invalid Roads from NYS Highways Shapefile.

If you use the OpenStreet Map Highway file future on the page, you will see it often has lines that overlap DEC hiking and truck trails, and has old woods roads or other invalid data, that you will need to delete to clean up your map, and avoid confusing users. It’s pretty safe to delete all highways from Wilderness-areas, unless you are sure that such a road actually exists.

You need to right click on New York Highways Shapefile, and choose Toggle Editing. A pencil will appear next to that layer. Then use the select tool on the second toolbar, in the upper left (selected in box below). Highlight the streets you want to delete, and they will appear yellow.

Use the Delete Selected button to delete the roads you have highlighted. Notice buttons nearby that allow you to split features into multiple features. These are helpful if you know only part of a road has been closed or abandoned, and you want to remove only part of the road from your map.

I zoomed in on Round Lake to search for other invalid roads I wanted to remove. Looks okay now, although I still question some of those roads located in Whitney Headquarters. Having not been there, I can not say which ones have been gated or abandoned, so I will leave them on for now. Right click on the NY Highways Layer to save your changes to that Shapefile.

Step 8: Stylizing Assets.

Next we need to change the various DEC Physical Assets from a single color dot, to icons that represent the asset. With the current map, we can not tell the difference between a campsite, a parking area, or trail register. This could be rather confusing for anyone using our map.

This is very similar to changing the symbols for roads versus hiking trails in the previous step. Go back to the properties dialog. This time, we want to stylize things based on Unique Value, then Classification field Asset. Then, click Classify. This will create unique color for each icon. By browsing the “Point Symbol”, you can now give primitive campsites proper looking icons. Don’t forget to set the size. I usually set icons at Size 3.0 or 4.0, but it varies a lot on the final scale of the map.

Finally, I zoomed in to check on my work. Wit the icons set, we have a pretty nice looking map. I can spot the campsites, parking areas, trails, and the private property-public lands boundaries. I know where to put in my kayak, to explore Round Lake. It’s too bad, I don’t know which if any roads to remove from Whitney Headquarters, so I’ll have to go in person if I want to correct the map.

Step 9: Adding Labels to Trails and Roads.

Yet, I would also like to see some names on the roads and trails. Select the DEC Trails layer. Go to Layers menu and choose Labeling. From here, click Label This Layer, then choose Fields with Labels and select Name. The default style of 12 point fonts is almost always too large for most maps, a font size between 5 to 7 points is what you mostly likely will use. Then select, Buffer to create a small white background around each label. This is usually necessary to make your labels appear readable on the map.

Then click the Advanced tab. The default placement for labels is Parallel, which labels the largest amount of items, but doesn’t look very pretty. Curved is the prettiest, but it will not label particularly twisty lines. Priority controls which labels are most important if you have multiple layered roads. I usually set NYS Highway Shapefile to a low priority as the underlying topos usually also have road names, and trails to a much higher priority.

So now you should be set with labels. You have to do this with each layer with labels, such as the NYS Highways layer. You can do this also with the assets layers, although I generally do not bother, as I don’t really care about the sometimes lengthy names the DEC gives campsites.

Step 10: Printing and Making Images to Export.

Looking at a map in QGIS is kind of fun, but pretty useless when your on the trail. Go to File -> New Print Composer. A dialog like this will appear.

Next, you will want to change the paper size to something more reasonable then A4. Most likely you’ll choose Letter-sized paper. Below that set the resolution. Choose the orientation most appropriate for your map, I often use Landscape. To get high quality map print outs, you will want to set the the quality box somewheres between 300 to 500 dpi. Even if you are just exporting as a picture, it is good to preserve the resolution for future printing.

Then click on the canvas icon (circled in blue), to draw the surface the map on your canvas. This will provide you a canvas to draw on your page surface. You may wish to click “Snap to Grid” and set “Spacing to 5.0” to make it easier to line the canvas up. Click the magnifying glass, with the plus sign or the icon directly to the left of it, to expand the window so it’s easier to work on the canvas. This doesn’t change output, only the display on the screen.

Next, click Item tab, and then the Extents label. This will bring up the map extent box. The extents of the map will be listed in Northing and Easting, a series of large numbers that tell you how many meters you are North and East of the Greenwich, England. This is the standard form of measurement used by the Universal Transverse Mercator positioning system. Just click, “Set to Map Canvas Extent”.

Click Map. You can use the Earth on Hand Tool (circled blue on this screenshot), to move around the image on the map. Then you can go to the scale box, and adjust the zoom. Smaller numbers mean more zoom in. A standard topographic map is at 1:24,000 scale, however, I generally prefer a scale of 1:18,000 or so to make the map more readable. If you zoom in too far, the topographic map β€” a raster map, will become pixalated. In addition, if you zoom in too far in or out, you will have to adjust the thickness of trails on the map, and the size of icons.

Scale Bar, Labels.

The labeling tool is fairly self explanatory. It appears like a tag on the top of the screen (circled red). Use it to add labels, such as the name of the map and other details. Set the font, background color, and other options under the Item tab and the various lablels.

More challenging is adding a scale bar. Draw it using the scale bar tool (circled in green). The big hint here is that topographic maps are projected in Universal Transverse Mercator or UTM, which is a metric system. Each map unit is equal to one meter. Chances are you don’t care about kilometers. Set Map units per bar unit to 1610, which is roughly 1610 meters per mile. There are actually closer to 1609 meters per mile, but you will never notice the difference, as the map is at too large of a scale to notice that extra meter.

Then set the Segment size (map units) to a fraction of 1610. I typically do maps at 1:18,000 scale, so a segment size of 402.5, which is equal to 402.5 meters or 1/4 mile works perfectly. For larger maps, you’ll want to use a segment size of 805 meters (1/2 mile), or maybe even 1610 meters (1 mile).

Below Map units per bar unit is 4 Right segments and 0 Left segments. Set them as you please, but if your doing a 1/4 mile per segment scale, then the default of 4 usually works well.

Finally, don’t forget to type in a unit label. This doesn’t effect anything, but it’s nice for the user of the map to know what the scale is done in.

Step 11: Printing or Saving.

Most of the time you’ll want to save your map as a JPEG image, that you can open up at any time easily, add to a Microsoft Word document, email to friends, or print at a later time. I circled the save as an image button with a yellow circle. Assuming, you set the resolution sufficiently detailed (such as 300-500 DPI), you’ll get an excellent print out later on. Save your image and your done.

Alternatively, you can print directly from QGIS. I circled the print icon with red. I do not recommend this option, as it’s a pain to have to open up the saved QGIS project, and then the open print composer, every time you need a particular map, compared to having it saved. Even on fast computers, loading QGIS can take a bit of time to load and navigate.

Conclusions.

Fermented

If all goes well, you should end up with a map that looks like this map. Your styling choices may be different, but you will still know where to put your kayak out, when going up to Round Lake in the Round Lake Wilderness, and the location of all the campsites.

I appologize if I missed any major steps. There are a lot more you can do with QGIS, but I wanted to cover the major steps, and provide hints for some of the things I found most confusing about using QGIS when I started using it regularly about a year ago now. I hope this is helpful. β€” Andy

Cap and Trade or Performance Standards

After reading “Saving Energy, Growing Jobs” by David Goldstein, I am convienced that Preformance Standards, rather then Cap and Trade is a better way to reduce our greenhouse emissions.

Descending Acra Point

Here is Why…

  1. Cost does not always induce conservation or efficency
  2. People and corporations are willing to pay a lot more for energy without changing behavior or investigating alternatives
  3. Individuals have little choice in buying efficent appliances — most appliances of a certain size consume a certain amount of energy
  4. Information on energy efficency is complex, little understood by the public
  5. Energy taxes will hurt the poor disproptionately

Horse Tiedown

What Cap and Trade is…

  1. A hard national limit on emissions is set.
  2. A tax on emissions is set by a market based on the demand to emit carbon dioxide emissions. The more demand for carbon dioxide emissions, the higher the tax.
  3. Every consumer of energy pays a “tax” related to it’s carbon emissions as a disinsentive to consume energy that produces carbon dioxide emissions.

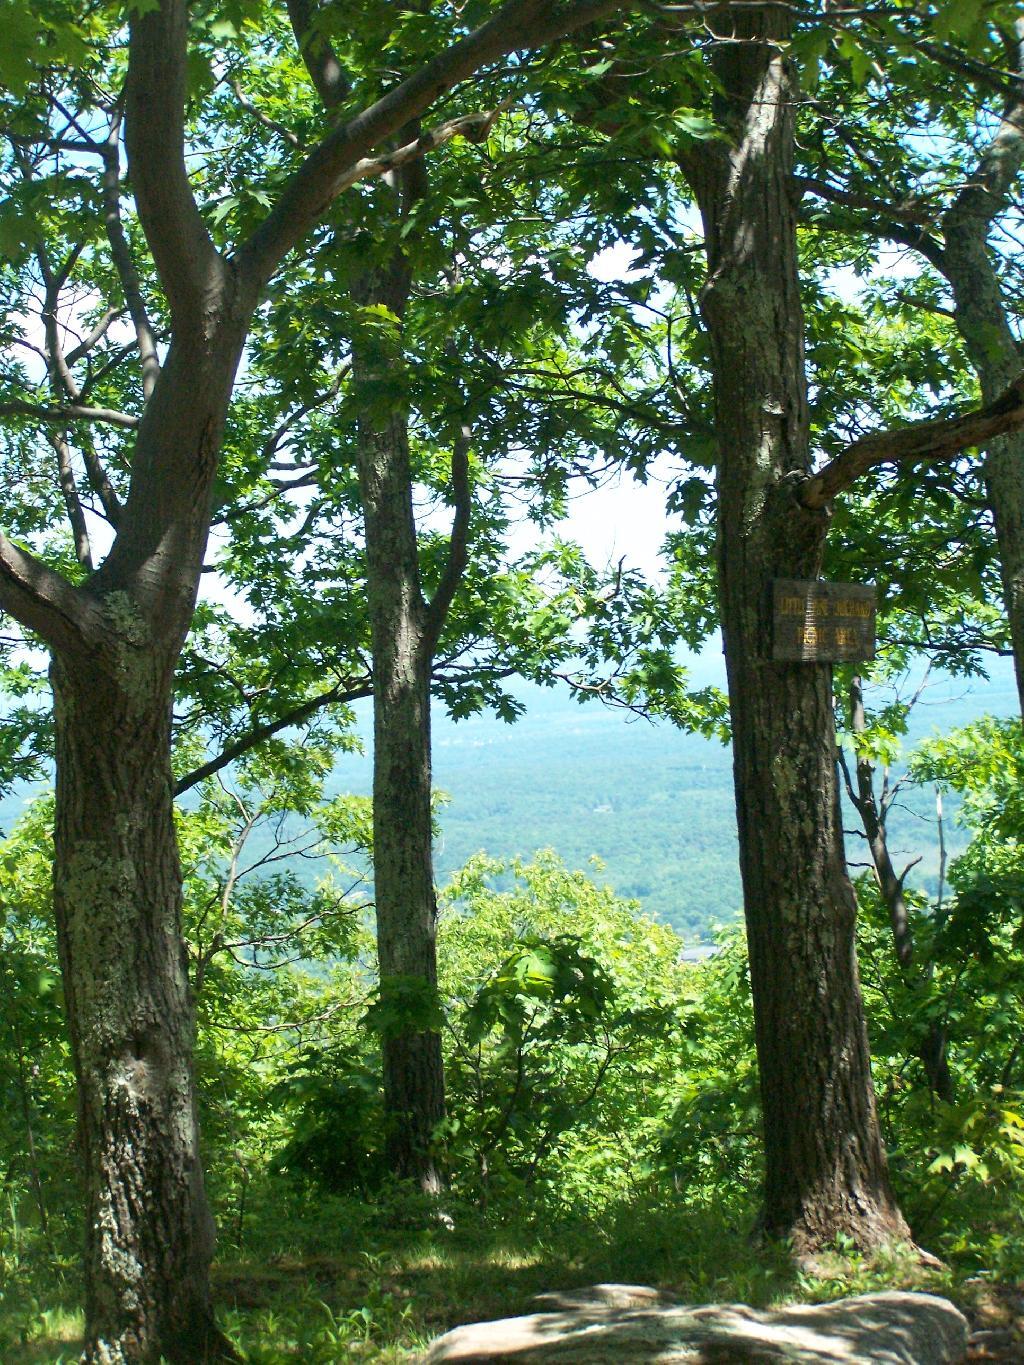
Open Window

What Preformance and Efficency Standards Are…

  1. Every electric utility, every oil or gas supplier is required to meet a standard on how much carbon dioxide may be released per average unit of enery produced and distributed.
  2. If they are above that standard, they must buy alternative forms of energy as part of their mix to reduce their average carbon intensity. Failure to comply will lead to substantial fines. This is how Corporate Average Fuel Economy or CAFE works.
  3. Utilities along with oil and gas suppliers will be required buy more renewables and put them into their mix, to reduce the carbon intensity of the energy source they provide to consumers.
  4. Every new appliance, every new car or truck is required to meet a specified level of energy efficency. A televison for example, would be prohibited from consuming more then X watts per square inch.

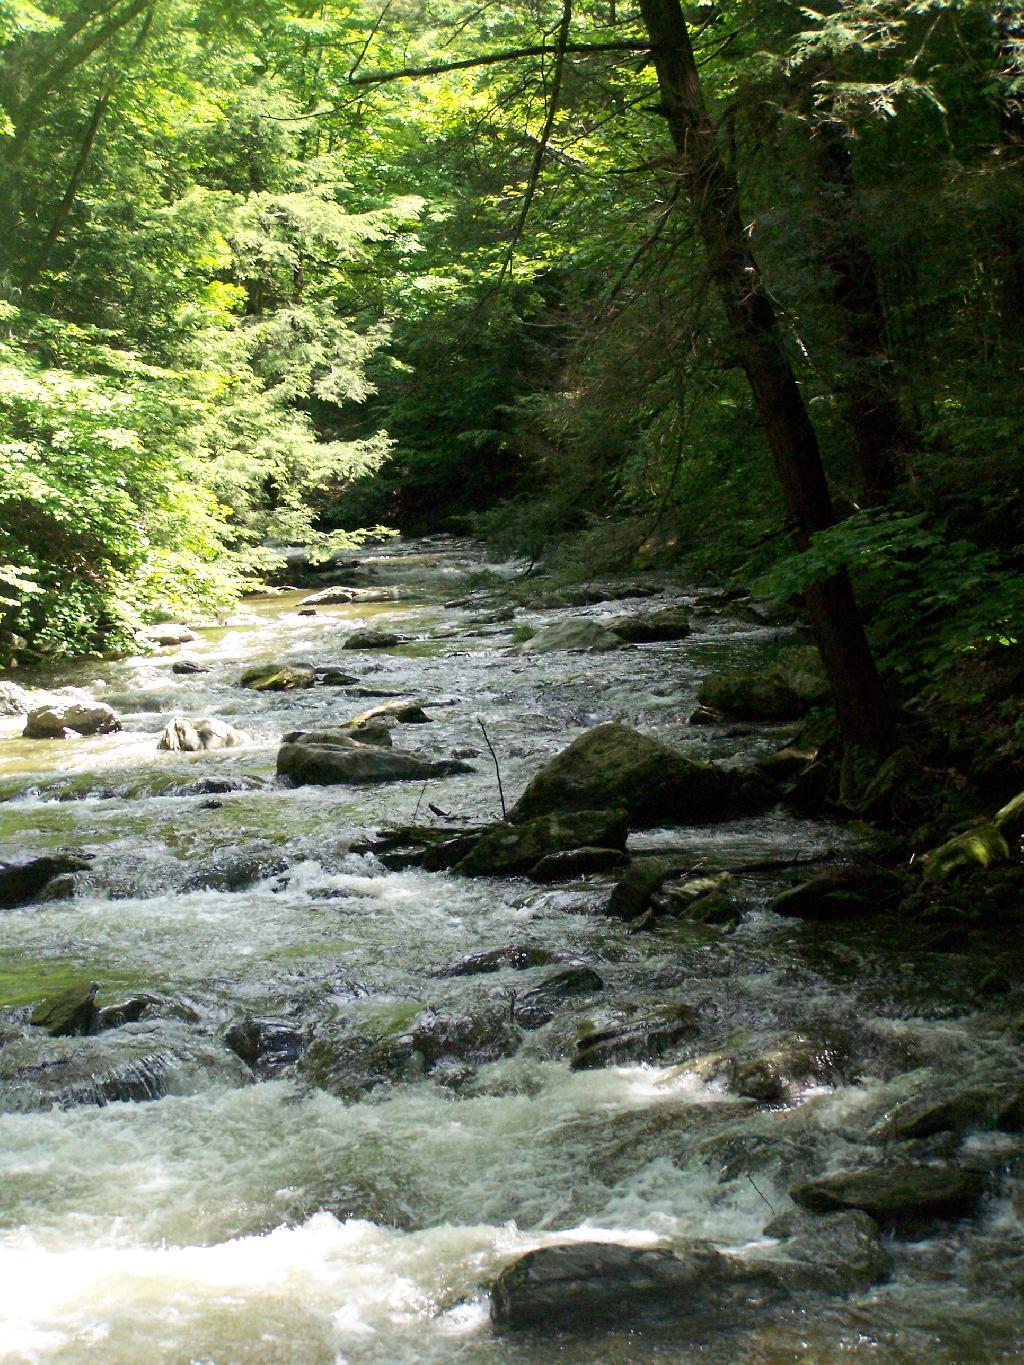
 Brook

Why Preformance Standards are Better…

  1. Preformance standards are not a tax or fee. They do not neccessarly raise the price of energy or of a consumer product.
  2. Consumers save money by ensuring the new appliances they buy are energy efficent. Consumers don’t pay an energy tax as with cap and trade.
  3. Preformance standards, per US Energy Law, do not prohibit features, but instead require high standards of efficency for all models. If you want to buy a gas guzzling SUV or big television, that’s your right, but manufacturers will be required to make sure the average of all cars and television sets are efficent.

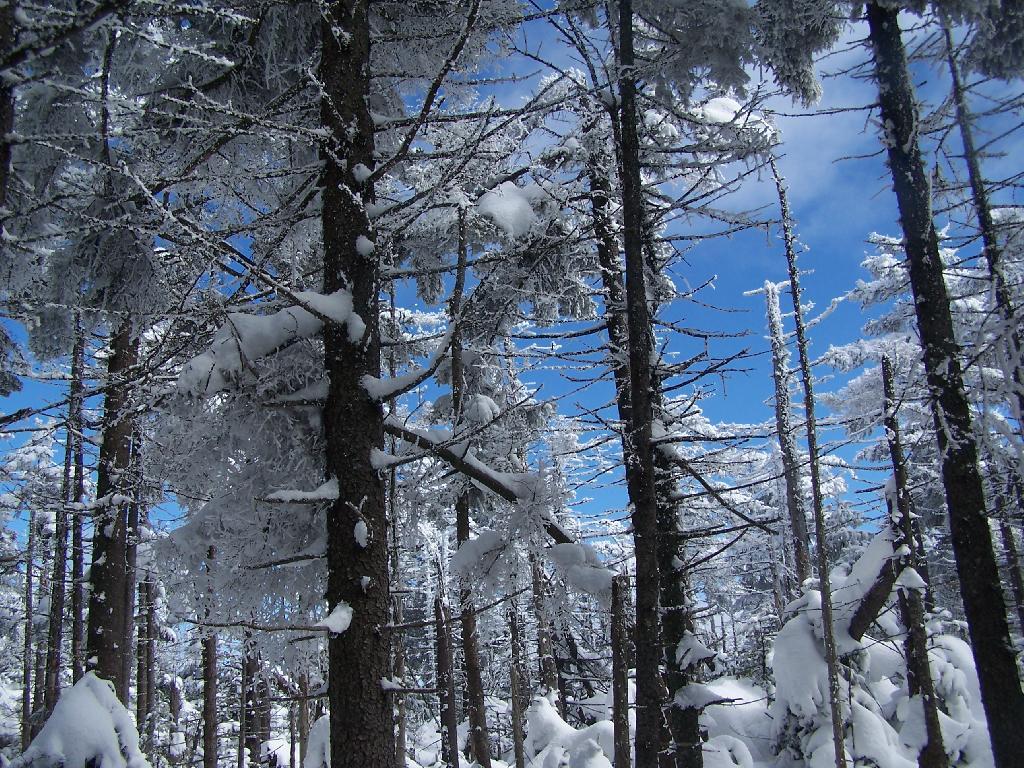
Boreal Forest

There Are No Hard Targets for
Greenhouse Gases with Preformance Standards…

  1. Preformance standards are set based on national goals to reduce greenhouse emissions to levels that are demanded by science.
  2. The objection raised by Cap and Trade proponets is that preformance standards do not guarantee a set level of reduction of greenhouse gases by any one year.
  3. If people use a lot of electricity one year, or drive a lot of miles in their cars, then the preformance standards would be canceled out temporarly.
  4. The EPA can compensate by toughening preformance standards for energy generators and new appliances. People (at different times) are constantly replacing cars, television sets, and appliances. This leads to a constant chance at improval in energy efficency and a constant decline in carbon intensity.
  5. It’s better to have a system that has flexibility, so that carbon emissions can rise temporarily in relationship to a hot summer or sudden economic boom.

Why Preformance Standards Will Ultimately Win
in the Climate Change Debate….

  1. Preformance standards are generally allowed under existing law.
  2. The EPA can regulate emissions from smoke stacks, including carbon dioxide at the tonnage level or the per MW/hr level. The EPA would however need Congressional approval for a system that would set carbon dioxide standards public utility-wide level.
  3. Preformance standards for appliances are well established. While tightening of some standards would require Congressional approval, most legislators are far more comfortable with tougher energy efficency standards then an economy wide tax.
  4. Preformance standards are not a tax and do not raise energy prices.
  5. Energy efficency does mean a ban on any appliance or any feature people are used to. It’s the internal redesign of existing appliances, to make them consume less energy for each unit of work done.