Gilboa is a town in Schoharie County, New York, United States. The population was 1,215 at the 2000 census. The Town of Gilboa is in the south part of the county and is southwest of Albany.
ccording to the United States Census Bureau, the town has a total area of 59.3 square miles (154 km2), of which, 57.8 square miles (150 km2) of it is land and 1.6 square miles (4.1 km2) of it (2.63%) is water.
The south town line forms a border with Delaware County and Greene County. The Schoharie Creek flows northward through the town. New York State Route 30 is a north-south highway in Gilboa. New York State Route 23 cuts through the southwest corner of the town. New York State Route 990V is a highway running eastward from NY-30 in the southeast part of Gilboa.
How to create a Shapefile with the Percentage of Polish Americans from the US Census Bureau 🗺
Often you may want to make maps of Census Data. While you can certainly make good maps using ggplot in R, often using full GIS software like QGIS or ArcMap might be a better option. It is very easy to create shapefiles to use in your favorite GIS application using tidycensus. Changing the resolution setting can help if you are exporting to PDF or SVG from your GIS program to reduce file sizes.
library(tidycensus) # you will need a free Census API, see tidycensus docs library(sf) # required for export
# Use this to find Census variables in RStudio. Browse and search the table for # desired variables. # load_variables(2020, “acs5”, cache = TRUE) %>% View()
# Get data. By setting geometry = TRUE, pol <- get_acs( geography = “county subdivision”, variables = c(“B04006_061”, “B04006_001”), survey = “acs5”, state = “ny”, year = 2020, output = ‘wide’, resolution = ‘500k’, geometry = T, )
# use .gpkg extension for a geopackage, .kml for a KML file # saves by default in your RStudio directory but change path to where you want pol %>% write_sf(‘Polish_Americans.shp’)
Manufactured Housing is very odd the state’s assessment records. Some towns assessors don’t use that code at all, preferring to either leave the housing style field blank or describing such structures as Ranch style. For example, Coeymans doesn’t have a single building that is Manufactured Housing but Cario has several hundred. In some towns its inconsistent – varies widely by property – probably whoever was assessor at the time.
But then again, assessment records are riddled with errors. If you look at the City of Albany assessment records, only two buildings were built before 1850, a fact that doesn’t take long to disprove.
After all these years working in politics – as a researcher, a coordinator and then Deputy Director of Research Services – the position I really enjoy is now being the Director of Data Services. Simply said, I like working with data.
None of this should be a surprise, as a teenager I was the quintessential computer geek, first with my Macintosh computers and then Linux. I’ve used Linux exclusively for years outside of work, I became good at using the Unix text utilities over the years for reasons of convenience and necessity.
For years I wanted to get away from computers, I have nothing but disdain for the culture that celebrates materialism and is filled with the latest high technology. I loved the life of working on the Capitol Hill, although maybe not so much the all nighters, sleeping under the desk. Politics is a lot about clever wit and the use of power to get big things done.
But computers and working with data are a lot of fun too. Nothing beats coming up with a clever little shell script, some sql, a C program or R script to fix a problem. A good script can automate and save a lot of labor and product produce better output. I know I’d rather be checking the output of a program I wrote then doing something by hand.
The neat thing about my work is the tools I use – – especially the Unix text utilities are really simple and old but work incredibly well when piped together. As many of our databases are over 10 million records, it can take a fair amount of processing power on the main frame where they run, but the next result is useful data extracted from the system using simple, reliable tools.
There is all this talk these days about machine learning and advanced computing. But there is something wonderful about the simple old tools we use at work. And I enjoy working with them, along with the people. Plus I know every day I’m refining my skills, building my resume, and developing a better life and future that I will be able to take and put forward towards my future life goals.
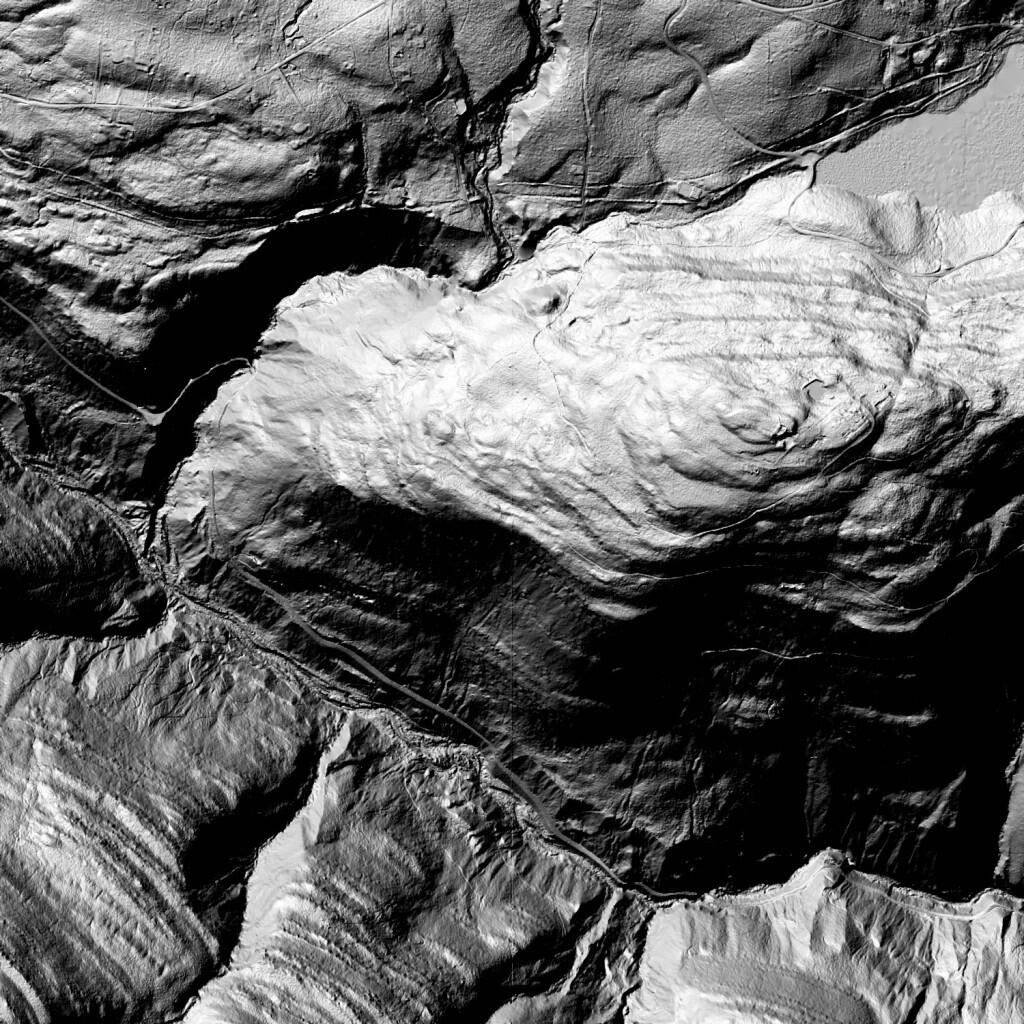
I would definitely use such hillshade data when considering to buy a piece of land, to get a better idea of what its like then what just an aerial photo or map shows. LiDAR see through trees and bushes, it gives a lot more information then you might get without a very detailed survey of a property.
Need a quick Census TIGER/Line Shapefile for a map you are making? 🗺
It is super easy to get using R and tigris and sf libraries. I often will run a command like this in R terminal to get a Shapefile of the of the counties in Maine.
Other common tigris functions I will use is state, county_subdivision, tract, block_group and school_districts which work similarly. A resolution parameter can be supplied to control the resolution downloaded, the cb=T flag obtains cartographic boundaries which follow coast lines, rather then actual boundaries.