Super Duty dreams and off-grid schemes.
How to create a Shapefile with the Percentage of Polish Americans from the US Census Bureau 🗺
How to create a Shapefile with the Percentage of Polish Americans from the US Census Bureau 🗺
Often you may want to make maps of Census Data. While you can certainly make good maps using ggplot in R, often using full GIS software like QGIS or ArcMap might be a better option. It is very easy to create shapefiles to use in your favorite GIS application using tidycensus. Changing the resolution setting can help if you are exporting to PDF or SVG from your GIS program to reduce file sizes.
library(tidycensus) # you will need a free Census API, see tidycensus docs
library(sf) # required for export# Use this to find Census variables in RStudio. Browse and search the table for
# desired variables.
# load_variables(2020, “acs5”, cache = TRUE) %>% View()# Get data. By setting geometry = TRUE,
pol <- get_acs(
geography = “county subdivision”,
variables = c(“B04006_061”, “B04006_001”),
survey = “acs5”,
state = “ny”,
year = 2020,
output = ‘wide’,
resolution = ‘500k’,
geometry = T,
)# calculate percent polish
pol$polish <- (pol$B04006_061E/pol$B04006_001E)*100# use .gpkg extension for a geopackage, .kml for a KML file
# saves by default in your RStudio directory but change path to where you want
pol %>% write_sf(‘Polish_Americans.shp’)

Percentage of Town Area Sloping North
Generally speaking, north sloping property is considered less valuable due to being colder with less sunlight, which is bad for agriculture, solar production and general human happiness.


Building Shadow Analysis Program
Earlier this week I wrote a small PHP script for analysis of the shadow cast by buildings on the surrounding landscape. To obtain sun position and altitude, it relies on SunCalc PHP which must be included in the script. It goes throughout the year, churning out how much of a shadow a building will produce each hour, in feet and direction. Additionally, the script will calculate the maximum point the shadow will be cast as a set of coordinates.
<?php
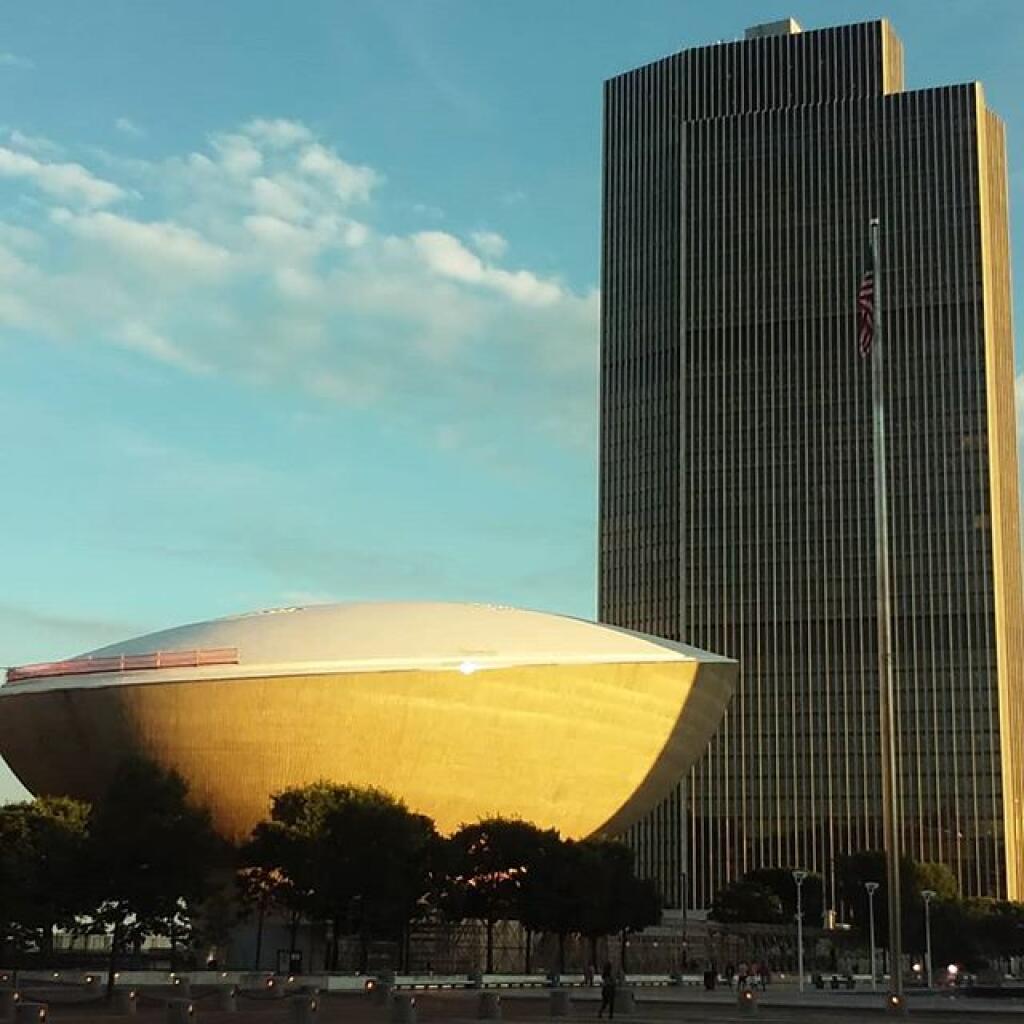
// The current values entered into this script currently are for the Empire Plaza.
$latitude = 42.64915;
$longitude = -73.75950;
$height = 610;
$start = strtotime("January 1, 2020 12 AM");
$end = strtotime("December 31, 2020 11 PM");
include("suncalc.php");
// Compass as a Reference
$compass = array(
'north', 'north-northeast', 'northeast',
'east-northeast', 'east', 'east-southeast',
'southeast', 'south-southeast', 'south',
'south-southwest', 'southwest',
'west-southwest', 'west', 'west-northwest',
'northwest', 'north-northwest');
function newPos($lat, $lng, $dist, $dir) {
// Earth Radius in KM
$R = 6378.14;
// distance in feet to KM
$d = (($dist * 0.3048) / 1000);
// Degree to Radian
$lat1 = $lat * (M_PI/180);
$lng1 = $lng * (M_PI/180);
$brng = $dir * (M_PI/180);
// Really Complicated Math (TM) that works based on the HAVERSINE formula from
// https://stackoverflow.com/questions/7222382/get-lat-long-given-current-point-distance-and-bearing
$lat2 = asin(sin($lat1)*cos($d/$R) + cos($lat1)*sin($d/$R)*cos($brng));
$lng2 = $lng1 + atan2(sin($brng)*sin($d/$R)*cos($lat1),cos($d/$R)-sin($lat1)*sin($lat2));
# back to degrees
$lat2 = $lat2 * (180/M_PI);
$lng2 = $lng2 * (180/M_PI);
return "$lat2,$lng2";
}
$output = "Month,Day,Hour,Sun Angle,Sun Position,Sun Pos Name,Shadow Length,Shadow Direction,Shadow Dir Name,Orginal Lat, Original Lng, Maximum Shadow Lat, Maximum Shadow Lng\n";
for ($time = $start; $time &lt; $end; $time += 60*60) { // get sun position for time $timeObj = new DateTime(); $timeObj-&gt;setTimestamp($time);
$sc = new AurorasLive\SunCalc($timeObj, $latitude, $longitude);
$sunPos = $sc-&gt;getSunPosition($timeObj);
// don't include any time when sun is below the horizon
if ($sunPos-&gt;altitude*(180/M_PI) &lt; 0) continue; // add month, day, hour $output .= date('n,j,G,',$time); // get sun altitude $output .= $sunPos-&gt;altitude*(180/M_PI).',';
// get sun position
$output .= 180+$sunPos-&gt;azimuth*(180/M_PI).',';
$output .= $compass[round((180+$sunPos-&gt;azimuth*(180/M_PI))/ 22.5) % 16].',';
// shadow length
$output .= $height/tan(deg2rad($sunPos-&gt;altitude*(180/M_PI))).',';
// shadow direction
$shadowDir = $sunPos-&gt;azimuth*(180/M_PI) + 360;
if ($shadowDir &gt; 360) $shadowDir -= 360;
$output .= $shadowDir.',';
$output .= $compass[round($shadowDir/ 22.5) % 16].',';
// building latitude and longitude
$output .= "$latitude, $longitude,";
// maximum extent of shadow
$output .= newPos($latitude, $longitude, $height/tan(deg2rad($sunPos-&gt;altitude*(180/M_PI))), $shadowDir).",";
$output .= "\n";
}
echo $output;
Here is an example output:
Month,Day,Hour,Sun Angle,Sun Position,Sun Pos Name,Shadow Length,Shadow Direction,Shadow Dir Name,Orginal Lat, Original Lng, Maximum Shadow Lat, Maximum Shadow Lng
1,1,8,4.370562595888,127.16997476055,southeast,7981.2630997694,307.16997476055,northwest,42.64915, -73.7595,42.662350867593,-73.783180446551,
1,1,9,12.464234785715,138.47001937172,southeast,2759.6833421566,318.47001937172,northwest,42.64915, -73.7595,42.654806428356,-73.766311948646,
1,1,10,18.826346377511,151.18871989968,south-southeast,1789.1660233981,331.18871989968,north-northwest,42.64915, -73.7595,42.653442385927,-73.762710054908,
1,1,11,22.92597731207,165.29270254371,south-southeast,1442.2476816852,345.29270254371,north-northwest,42.64915, -73.7595,42.652969571748,-73.76086316453,
1,1,12,24.317973645092,180.27827074558,south,1349.8710413416,0.27827074557518,north,42.64915, -73.7595,42.652845989302,-73.7594755931,
1,1,13,22.827705402895,195.24737437252,south-southwest,1449.1706789769,15.247374372522,north-northeast,42.64915, -73.7595,42.652978239559,-73.758081165062,
1,1,14,18.641667869753,209.31025239405,south-southwest,1808.2272087538,29.310252394054,north-northeast,42.64915, -73.7595,42.653467170112,-73.756204500047,
1,1,15,12.211118961179,221.98033545934,southwest,2818.7133569306,41.980335459338,northeast,42.64915, -73.7595,42.654887013398,-73.752480800429,
1,1,16,4.0670753820534,233.23837174035,southwest,8579.0650125467,53.238371740354,northeast,42.64915, -73.7595,42.663205632648,-73.733908619093,
1,2,8,4.3645441749857,127.03353849744,southeast,7992.3115188513,307.03353849744,northwest,42.64915, -73.7595,42.662327567958,-73.783255965565,
1,2,9,12.476443037614,138.33095911417,southeast,2756.8958218911,318.33095911417,northwest,42.64915, -73.7595,42.654788550435,-73.766323694576,
1,2,10,18.860737296743,151.04916237459,south-southeast,1785.6561891219,331.04916237459,north-northwest,42.64915, -73.7595,42.653428213262,-73.762717935368,
1,2,11,22.985140372821,165.15894624042,south-southeast,1438.1068136859,345.15894624042,north-northwest,42.64915, -73.7595,42.652956261035,-73.760871335783,
1,2,12,24.401639825801,180.15947237405,south,1344.6352402431,0.15947237405339,north,42.64915, -73.7595,42.652831682677,-73.759486067027,
1,2,13,22.932215921968,195.15131682951,south-southwest,1441.810083379,15.151316829514,north-northeast,42.64915, -73.7595,42.652960530629,-73.7580970562,
1,2,14,18.761308368827,209.23956034287,south-southwest,1795.8375075952,29.239560342872,north-northeast,42.64915, -73.7595,42.653440556697,-73.756234277101,
1,2,15,12.340240887742,221.93268535805,southwest,2788.302504508,41.932685358049,northeast,42.64915, -73.7595,42.654829364851,-73.752562956502,
1,2,16,4.2013827926665,233.20922777897,southwest,8303.8756666826,53.209227778967,northeast,42.64915, -73.7595,42.662764126188,-73.734739101558,