6:00 am sunrise – Friday, April 22 5:45 am sunrise – Tuesday, May 3 5:30 am sunrise – Monday, May 16 5:45 am sunrise – Friday, July 15 6:00 am sunrise – Saturday, July 30 6:15 am sunrise – Sunday, August 14 6:30 am sunrise – Sunday, August 28
Sun today and then cold rain later in evening into tomorrow. 🌦
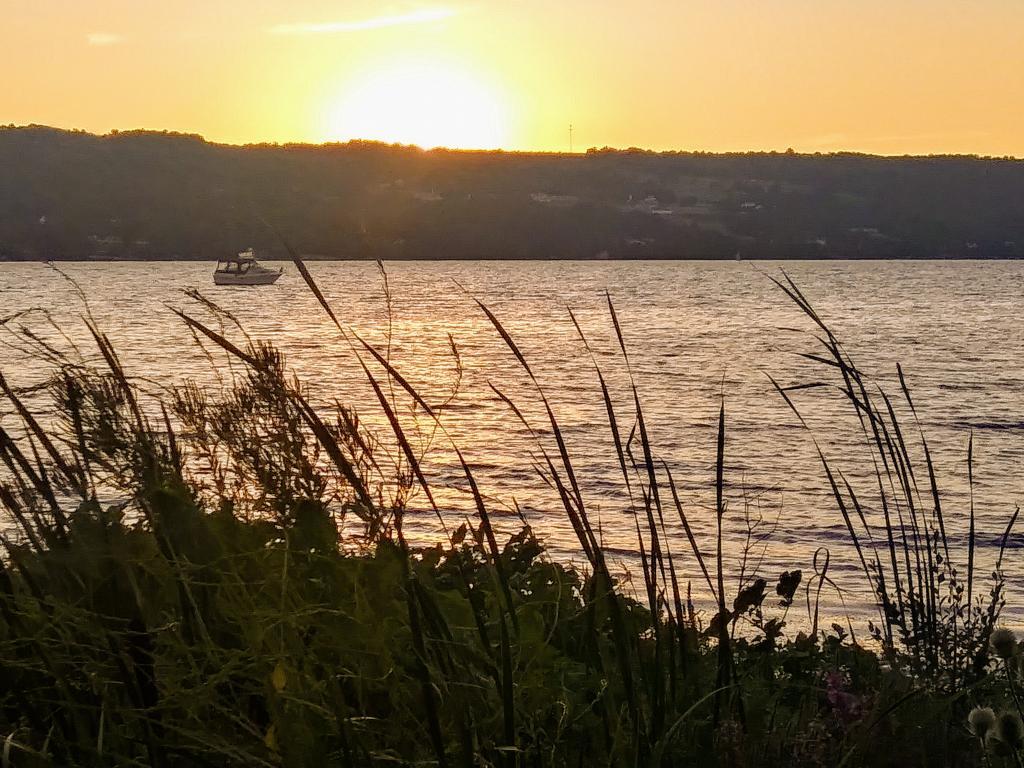
It’s like we get everything this week, although maybe not the snow of the higher elevations. Windows are open today, to dry out my clothes, but I will need to close them by evening. Still mild enough locally I don’t think it will screw up the green up much. I was noticing last night walking at 8 PM that there was still some daylight out, which was nice.
Today. Feels like … April 15th.
Increasing clouds.
Light and variable wind becoming southeast 9 to 14 mph in the morning.
and
59 degrees
,
7:42 sunset.
Tonight. Feels like … April 9th.
Rain before 4am, then rain and snow. Low around 34. Southeast wind 9 to 13 mph becoming northeast after midnight. Winds could gust as high as 23 mph. Chance of precipitation is 100%. New snow accumulation of less than a half inch possible.
and
34 degrees
,
6:05 sunrise.
Tuesday. Feels like … March 24th.
Snow, possibly mixed with rain, becoming all rain after 7am. High near 48. West wind 10 to 16 mph. Chance of precipitation is 80%. New snow accumulation of less than a half inch possible.
and
48 degrees
,
7:43 sunset.
Tuesday Night. Feels like … April 19th.
A chance of showers, mainly before 7pm. Mostly cloudy.
West wind 10 to 13 mph. Chance of precipitation is 30%. New precipitation amounts of less than a tenth of an inch possible.
I have today off and could have stayed in bed 🛏 but I was up and going and decided to head into the office. 🏢 I figured that way it would be easier to get my steps in and it’s not a real nice day.
Sunny and 34 degrees at the Elm Ave Park and Ride. 🌞 Calm wind.
Maybe I should have taken today off, it’s a nice morning 😎 but I don’t know how long the sun will last. And I would rather use the day off some point in the future for a real long-weekend in the Adirondacks. While I can’t head out of town next week due to that family obligation, I am really hoping to take off April 29th, although that might be difficult depending on the work load. It might be a very busy time around the office.
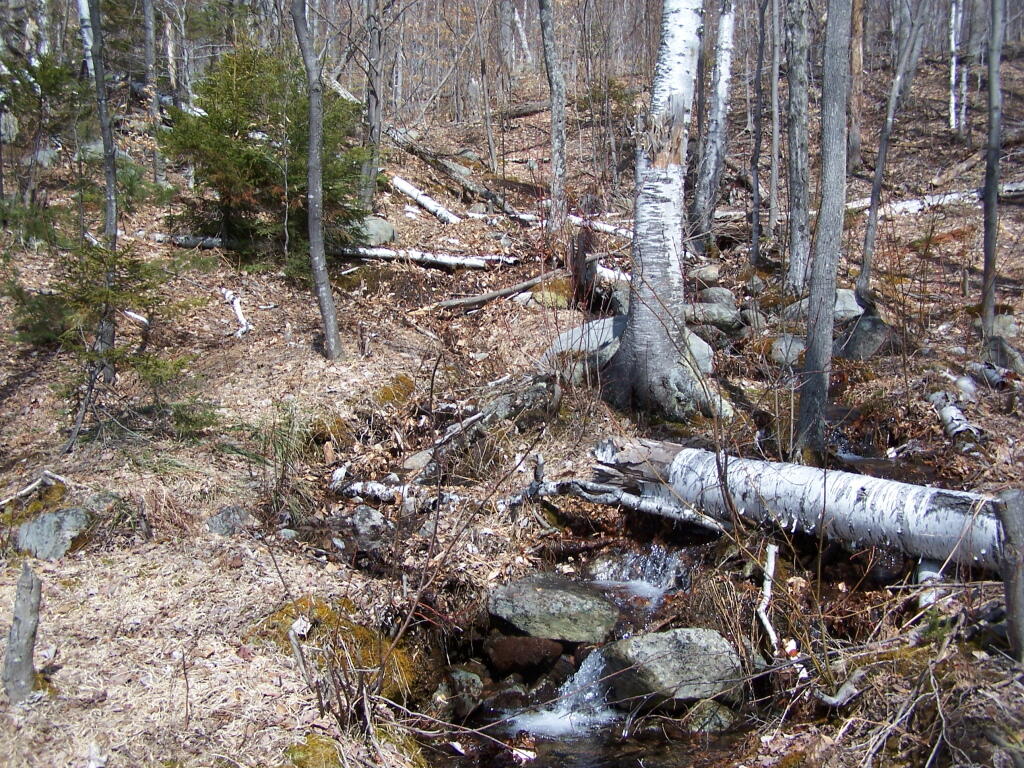
Last night I walked up Blodgett Hill, 🚶♀️ which was legally closed due to the trail being used for logging equipment, 🌲 but I figured it didn’t matter as nobody would be logging at 7 PM on Easter Sunday. Saw a Great Blue Heron up there and a Hermit Thrush I think in the bush and a Robin. Looks like they are doing some clearing of White Pine near the Pitch Pine and on the more densely part on the other side of the hill.
Always a nice hike, good vigorous climb 💪 to the top but not that difficult with the road they built to allow for controlled burns. Maybe more views when they get done with the cut on the other side, did not fully explore it over there as I figured it would be a mess with the recent tree cutting, and time was a bit tight with the setting sun. 🌆
There seems to be a magic line that separates the country from the cities. There is a point where you get far enough from the city, where farms aren’t surrounded by suburbia or concerned with the suburban way of life. There might still be long distance exburbian commuters out in these parts, but they are essentially rural and free of the control of the big city.
There are several things that come to mind when you are truly in a rural place:
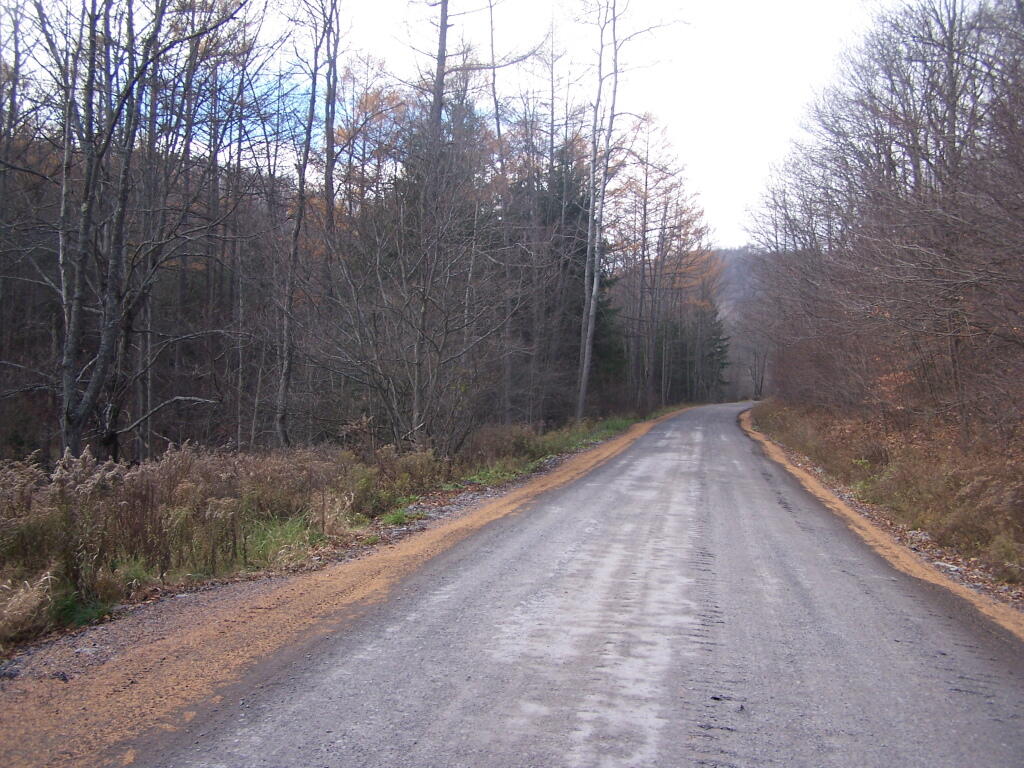
Speed Limit as 55 MPH. The state speed limit starts in almost all non-hamlet parts of rural towns. If the vast majority of roads in the town can be driven essentially as fast as you dare, then your in a rural place.
No Local Police Enforcing Local Laws. Rural communities may still have their own code inspectors and assistance from state police, but there is not the police presence that exists in the big cities. There simply is not the crime in the country, and lots of people leave their keys in their ignition.
Agriculture Not a Quaint Part of the Past. In most truly rural towns agriculture is not just a quaint hobby of people, but is a professional occupation of a number of citizens. In many rural towns there are far more hobby farmers then professionals, but the agriculture preformed on both farms is different then closer to suburbia, and often involves big animals.
People Burn Their Trash. While fewer and fewer people still have burn barrels, particularly in exurbian areas, in truly rural areas the vast majority of people still take their trash out back and burn it. Trash pickup simply is incompatible with the way of life of Rural America.
Big Pickups and Quads. People out in the country are more likely to own pickup trucks and quads. There is a need for vehicles that can haul things, and there is a culture that supports the pickup truck way of life. And people like playing our in nature with their snowmobiles and quads. Not to mention it’s fun to chase cows around on the quad.
Large Segments of Population Don’t Go to the City. The exburban and suburban commuter regularly drives to the city, rural people do not. There may be some exceptions, and most people do come together in a community regardless of where they live, but more often then not it’s a small city of less then 30,000 people.
In other words, a large segment of the rural population is wild and free, and not controlled like people in the big city. They aren’t limited in their possibilies or their land, or how they must live their life.