Lock 2 of the Oswego Canal
Broadway Bridge in Fulton.
Broadway Bridge in Fulton.

You know the rubbish the suburbanite developer didn't want because he couldn't legally fill it in with trash and build on it so it was dedicated preserve.
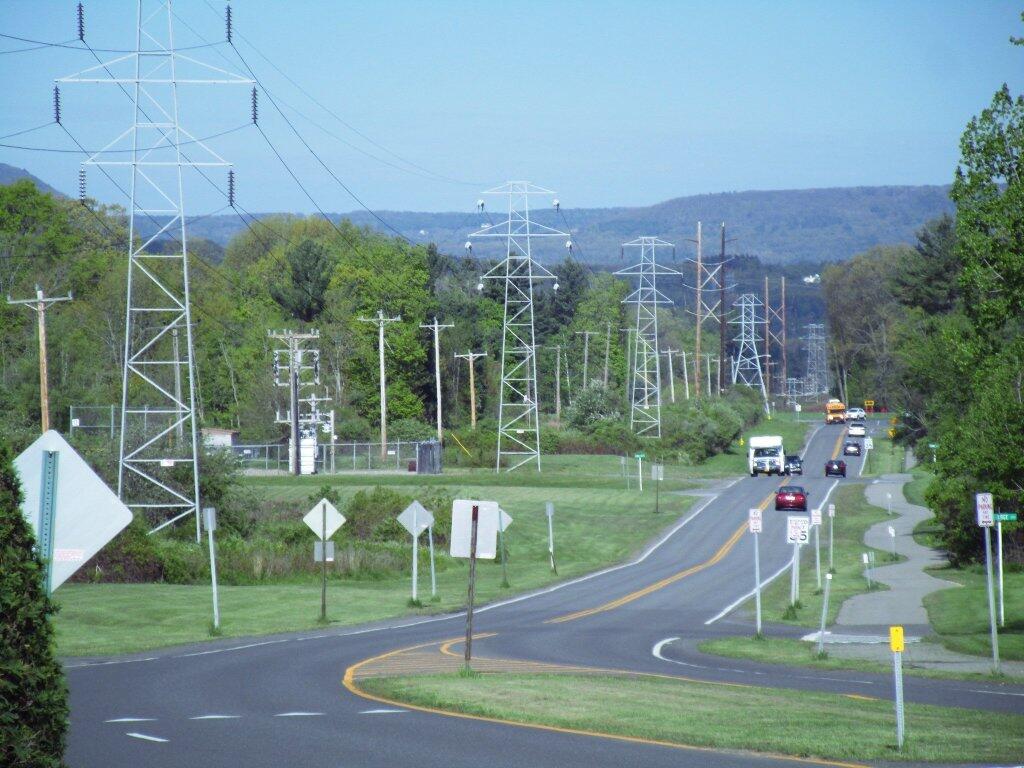
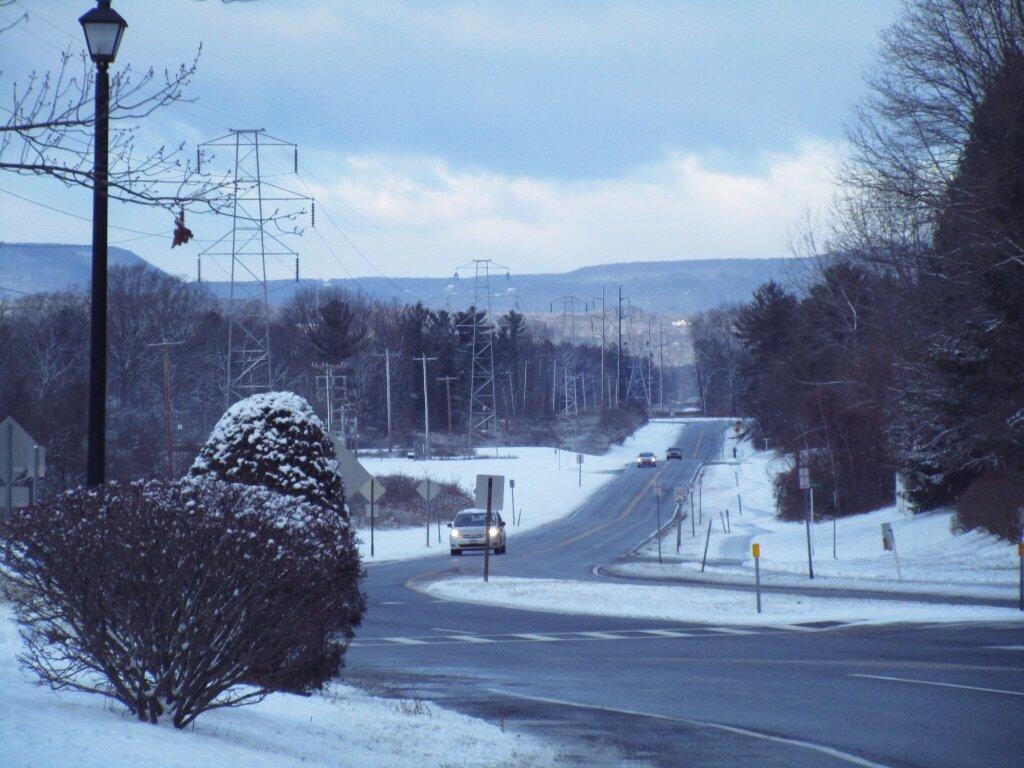
Saturday January 9, 2021 — Elm Ave Park and Ride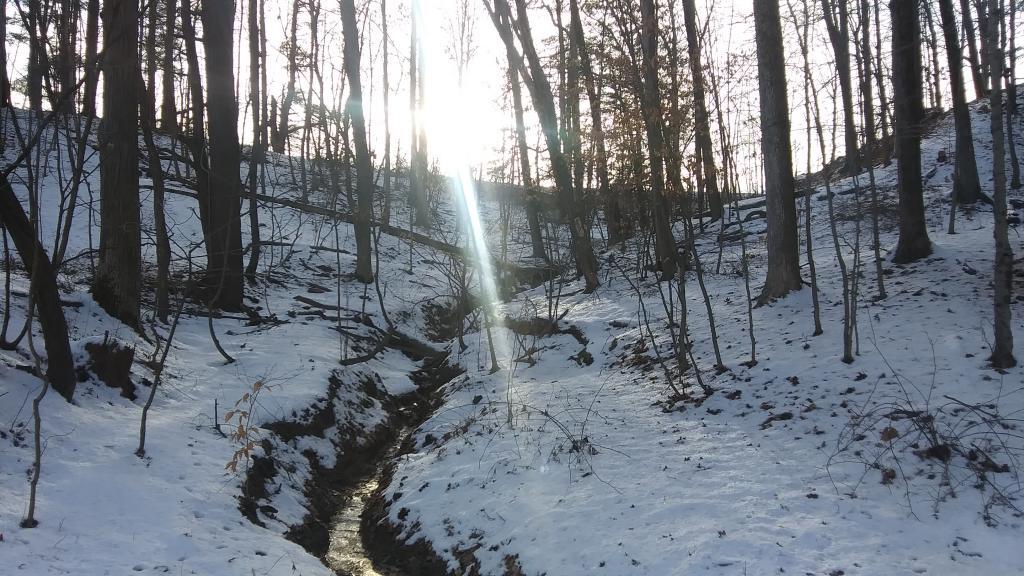


Some of the spikes in cancer are due to the small populations of the town, where one cancer case can quickly spike above what the state-wide average would suggest for a similar demographic.
| Cancers compared to expected cancer levels based on age/gender demographics in Albany County | |||||||||||||||||||||||||
| Municipality | Bladder | Bone | Brain | Breast | Colorectal | Esophagus | Kidney | Larynx | Leukemias | Liver | Lung | Mesothelioma | Nasal | NHL | Oral | Other | Ovary | Pancreas | Prostate | Soft_Tissue | Stomach | Testis | Thyroid | Uterus | Total |
|---|---|---|---|---|---|---|---|---|---|---|---|---|---|---|---|---|---|---|---|---|---|---|---|---|---|
| Albany city | 19% | −38% | −18% | 11% | 5% | 32% | 6% | 44% | −6% | 67% | 26% | −7% | −10% | 7% | −4% | 19% | −4% | 10% | −4% | −7% | 6% | 15% | −36% | −10% | 9% |
| Berne town | −3% | −100% | 110% | 5% | 1% | 32% | 32% | −76% | 3% | −5% | 8% | −100% | −34% | 3% | −4% | 16% | −22% | −39% | −16% | 50% | −15% | 55% | 7% | 34% | 3% |
| Bethlehem town | 33% | −11% | −6% | 21% | −16% | 11% | 29% | −0% | 5% | 8% | 9% | 63% | −27% | 13% | 23% | 20% | 6% | 13% | −4% | −22% | −12% | 45% | 1% | −21% | 9% |
| Coeymans town | 26% | 53% | −0% | −4% | 3% | −6% | 39% | −12% | −15% | −5% | 68% | −28% | −7% | 42% | 80% | 17% | −68% | 23% | −12% | 24% | −32% | 66% | 23% | −3% | 15% |
| Cohoes city | 37% | −100% | −16% | −6% | 11% | 10% | 39% | −5% | −7% | 12% | 58% | −49% | 98% | 20% | −27% | −9% | −4% | −29% | −3% | −30% | −52% | 32% | −28% | 9% | 6% |
| Colonie town | 19% | −46% | −4% | 7% | 3% | −22% | −2% | 10% | 10% | −14% | 16% | −26% | −50% | 14% | 9% | 11% | −12% | −1% | −8% | −25% | −22% | 3% | −5% | −6% | 4% |
| Green Island town | 60% | −100% | −19% | −11% | 45% | −5% | 37% | 27% | −19% | 61% | 81% | −1% | 21% | 10% | 11% | 7% | 27% | −20% | 3% | 1% | −40% | 30% | −33% | 19% | 17% |
| Guilderland town | 27% | −78% | 32% | 15% | −17% | 28% | −1% | −23% | −14% | −25% | 6% | 45% | −20% | −9% | −10% | 6% | −9% | −8% | −9% | −27% | −1% | −15% | −2% | 9% | 1% |
| Knox town | −20% | −100% | 77% | 39% | −0% | 69% | 9% | −73% | 2% | 47% | −15% | 135% | −28% | −25% | 6% | 13% | −49% | −32% | −22% | 32% | 32% | 9% | 2% | 46% | 3% |
| New Scotland town | 34% | −47% | 30% | 24% | 15% | 21% | 15% | −3% | 9% | −21% | 2% | 102% | 27% | −7% | 45% | 18% | −50% | −15% | −9% | 14% | −32% | 90% | 15% | −4% | 9% |
| Rensselaerville town | 25% | −100% | 35% | −6% | 4% | −50% | −3% | −67% | −10% | −49% | 37% | −100% | −8% | 9% | −4% | 30% | 31% | −73% | −12% | 189% | −29% | 133% | −43% | −7% | 3% |
| Watervliet city | 54% | −100% | 10% | 19% | 21% | 2% | 0% | 40% | 0% | 38% | 56% | −14% | −45% | 0% | 40% | 8% | −22% | 18% | −1% | 35% | 6% | −19% | −23% | −27% | 15% |
| Westerlo town | −4% | −100% | 98% | 9% | −0% | 71% | −11% | −75% | −27% | −52% | 22% | 1% | −100% | 4% | 25% | 26% | −5% | −60% | −14% | 143% | −25% | 171% | 17% | 2% | 5% |
| Andy Arthur, 12/23/22. NYS Cancer Mapping Project, aggregated to town level. | |||||||||||||||||||||||||

