The Rattlesnake Hill Wildlife Management Area is a 5,100 acre upland tract, situated approximately eight miles west of Dansville, New York. Roughly two-thirds of the area lies in southern Livingston County, while the remaining third lies in northern Allegany County. The tract was purchased in the 1930’s under the Federal Resettlement Administration and is one of several such areas turned over to DEC for development as a wildlife management area.
The area is appropriately named after the Timber Rattlesnake, which may be occasionally found in the more remote sections of the “Hill”.
The area offers an interesting blend of upland habitats such as mature woodland, overgrown fields, conifer plantations, old growth apple orchards and open meadows.
The area is inhabited by a variety of game species and is open to public hunting. The white-tailed deer, wild turkey, ruffed grouse, grey squirrel, cottontail rabbit and woodcock are found on the area. An occasional snowshoe hare may be observed adjacent to thick creek bottom brush or conifer plantation habitats.
A number of small marsh units have been developed and provide limited hunting for waterfowl. Some of the area’s furbearing species such as mink, beaver and raccoon may be occasionally viewed at these marsh units.
Immigration has played a pivotal role in shaping the landscape of New York State, bringing with it a multitude of benefits that span cultural, economic, and social dimensions.
One of the most prominent benefits of immigration to New York is the rich tapestry of cultural diversity it has woven. The state stands as a melting pot of various ethnicities, languages, and traditions, creating a vibrant mosaic of cultures. This diversity enriches the local communities by fostering cross-cultural understanding, acceptance, and tolerance. It also leads to a culinary, artistic, and intellectual exchange that fuels innovation and creativity.
Economically, immigrants have significantly contributed to the growth and dynamism of New York’s workforce. They fill gaps in the labor market, particularly in sectors where there is a shortage of skilled or willing domestic workers. This influx of talent supports industries ranging from technology and healthcare to construction and hospitality. Moreover, immigrants often bring unique skill sets and experiences that complement the existing workforce, leading to increased productivity and efficiency.
Immigrants are also known for their entrepreneurial spirit, with many choosing to start their own businesses. This entrepreneurial drive has a cascading effect on economic development. As immigrant-owned businesses thrive, they generate employment opportunities, stimulate local economies, and contribute to tax revenues. In fact, a significant number of iconic businesses in New York, from restaurants to retail stores, are owned and operated by immigrants, contributing to the state’s economic prosperity.
Additionally, immigration plays a crucial role in fueling innovation and knowledge exchange. International students and professionals who migrate to New York’s universities and research institutions bring diverse perspectives and ideas, enriching the academic and scientific landscape. Collaboration across borders leads to breakthroughs in various fields, from technology to medicine, further solidifying New York’s position as a global hub for innovation.
In conclusion, the benefits of immigration to New York State are multifaceted and undeniable. The cultural diversity immigrants bring nurtures social harmony and understanding, while their contributions to the workforce and economy drive growth and development. The entrepreneurial spirit and innovative thinking of immigrants invigorate various sectors, ensuring that the state remains at the forefront of progress. As history has shown, immigration continues to be a driving force that shapes New York’s identity and propels it towards a promising future.
How to access WMS Servers in R Programming Language
I couldn’t find a good package to read WMS data into a SpatialRaster or for downloading. However I discovered that you can use sf’s built-in version of gdal_util query the WMS server’s information then use the sf built in gdal_translate to download the WMS image into a temporary file then load it into memory.
library(sf)
library(tidyverse)
library(terra)
rm(list=ls())

# obtain layer info from WMS server using sf built-in version of gdal_info
wms_url <- 'https://orthos.its.ny.gov/ArcGIS/services/wms/Latest/MapServer/WMSServer?'
ginfo <- sf::gdal_utils('info', str_c('WMS:',wms_url), quiet=T)

# extract layers and layer urls from returned layer info,
# create a data table from this data
ldesc <- ginfo %>% str_match_all('SUBDATASET_(\\d)_DESC=(.*?)\n')
ldsc <- ldesc[[1]][,3]
lurl <- ginfo %>% str_match_all('SUBDATASET_(\\d)_NAME=(.*?)\n')
lurl <- lurl[[1]][,3]
wms_layers <- cbind(ldesc, lurl)
rm(ldesc, lurl)

# obtain from census bureau a shapefile of the Town of Cazenovia,
# then find the bounding box around it
bbx<- tigris::county_subdivisions('ny') %>%
  filter(NAME == 'Cazenovia') %>%
  st_transform(3857) %>%
  st_bbox()

# Revise the WMS URL based on the above bounding box
# Web Mercator (3857) is best to use with WMS Servers as
# that is the native projection. As I wanted multiple layers
# I also revised the URL string to include all layers desired
# Seperated by a comma (explore the wms_layer table for details)
url <- wms_layers[4,2] %>%
  str_replace('LAYERS=(.*?)&', 'LAYERS=3,2,1,0&') %>%
  str_replace('SRS=(.*?)&', 'SRS=EPSG:3857&') %>%
  str_replace('BBOX=(.*?)$', str_c('BBOX=',paste(bbx, collapse=',')) )

# Use sf built-in gdal_utils to download the image of Cazenovia based
# on the URL, with an output size listed below. You can also download
# based on resolution by using the tr option that is commented out below.
# then load the temporary file into rast as a Spatial Raster for further
# processing. In addition, adding -co COMPRESS=JPEG greatly reduces the size
# of aerial photography with minimal impacts on quality or loading speed.

t <- tempfile()
reso <-  c('-outsize','1920','1080','-co','COMPRESS=JPEG')
#reso <- c('-tr', '1','1','-co','COMPRESS=JPEG') # "meters" in the 3857 projection
sf::gdal_utils('translate', url, t, reso)
r <- rast(t)

# display the spatial raster or whatever you would like to do with it
# the tiff is stored in the temporary location in the t variable
plot(r)
Last night I went back for a second a look at the world of Geospatial Technology in Python. While Python’s ArcGIS and QGIS bindings are widely touted — and are best way to automate things within ArcGIS or QGIS — you are much better off using R programming language for quick, low-code GIS tasks outside of ArcGIS or QGIS.
Python has a lot of advantages for certain things:
It is a good scripting language that is widely supported in applications.
Python is generally a stronger language for building applications to run on web servers
Both ArcGIS and QGIS have really good Python bindings
But as a stand-alone platform, the Python Geospatial libraries rather suck, and are undeveloped. To be sure you can make maps in Python, you can preform various geospatial operations like transformations, raster math and geometric operations. But it takes a lot of work within Python to get nice looking maps using matplotlib, and but you don’t have access to wealth of Census shapefiles or Census data at your finger tip, and Python’s dot chaining method isn’t necessarily as elegant or readable.
I would argue that the R Programming Language and RStudio are superior in many ways over working directly with Python:
R Programs using tigris library, which gives you instant access to the Census Bureau TIGER/Line with just a single command that can be easily joined again or queried against other data. There is nothing like tigris in Python. If you want to County or County Subdivision lines in Python, you will have to manually download the shapefile and then load it into Geopandas. I’ve looked for things like tigris in Python and it doesn’t exist. The basis of most maps in my experience comes from Census TIGER/Line at least in United States. Cartograpy in Python does have access to Natural Earth Dataset, but that isn’t as good as TIGER/Line in the United States.
There are Census Libraries in Python but they aren’t nearly as up to date, have access to nearly as much Census data or Census TIGER/Line. A lot of maps that you make involve plotting Census data, and that requires both the TIGER/Line and the raw data. tidycensus joins them together as one command, no need to download the TIGER/Line separately like in Python.
While you can chain commands in Python and GeoPandas, the chaining mechanism in R is much stronger and flexible. Often in R you can exchange, transform, load and output a map in a single chain of R commands using the tidyverse and ggplot.
ggplot2 is vastly superior to matplotlib for making maps. ggplot2 has sensible defaults, the output is clean and easily theme-able. ggplot2 main limitation is that is best for simpler, easy to read SVG maps. ggplot2 can be a bit strict in enforcing how Hadley Wickham thinks a map should be presented. matplotlib is more flexible in overlaying and designing maps. Of course, for complicated maps, it’s still best to export the data as a shapefile or geopackage and load it into a full GIS platform like QGIS or ArcGIS.
In general, R has a quirky syntax with cute and weird names, but with more sensible defaults, it often gets geospatial work done with less code and work then the same thing done in Python with Rasterio or GeoPandas. A lot of complicated exchange-load-transform things can be done in one line of code with R. People say that Python is a compact syntax, but it really isn’t compared to R’s geospatial libraries.
I still use Python for some QGIS work but I don’t recommend it for work outside of QGIS or ArcGIS. Python should be seen as a good language to automate processes within QGIS or ArcGIS but the state of geospatial tools in Python is weak when you get away from those automating those graphical GIS applications. If you want your work to end up in a graphical GIS program for additional manual tweaking after automating things, then use Python. But if you are processing GIS data from start to finish, your best bet is R.
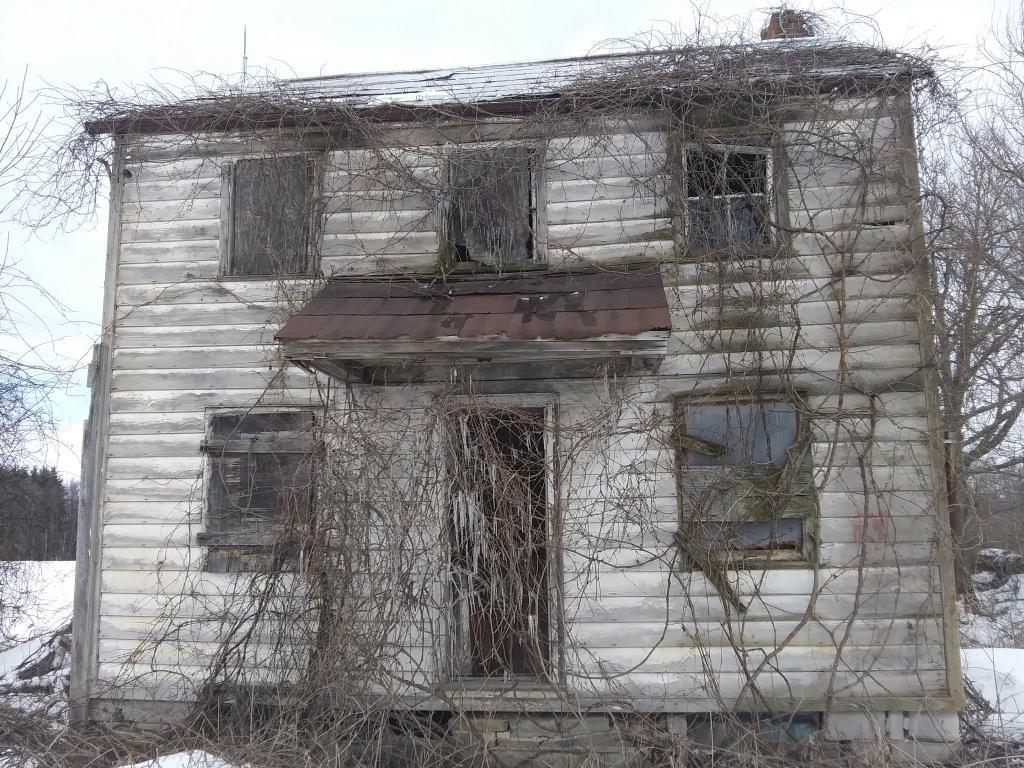
I really should take a look at older, smaller houses out in the country once again. Not just that house next to my parents house, but other things that come onto the market with land. And just decide I am going to dedicate to fixing it up once I have the facts after a good home inspection. A lot of things I can do myself but there will inevitaby be things I have to pay to get done as I lack the skills and knowledge. But it can be done.
Often I discount old structures, seeing the flaws when I should see more of the potential. That property I toured next to my parents house, definately had it flaws, and I didn’t like how it was on the main highway and had another property inset on into it, but had the location been somewhat different, I probably could have made it work. It being old, certainly had a lot of charm, and musty smell of old buildngs. Maybe it’s the smell of rot and mildew, but it also is kind of charming to. For a farm house, that lands it lot of character. There is something quite charming about the smell of old house, wood smoke, cow manure. It’s a reminder of how close one is to the land.
Maybe that old house I looked at next to my parents, would have been an easier sell in my mind, had it had a woodstove, and neighbors a bit farther away for when I had fires or wanted to discharge a firearm for dispatching livestock and predators. Still I don’t know if that’s the right option for me. Depends a lot on the property, I keep looking. I still would much rather go fully-off grid with as little technology and plumbing to deal with as possible. Less modern stuff in a house, less to break. I can’t imagine wiring a house for internet or big screen televisions, and while I guess hot water is good for showers and washing dishes, I certainly wouldn’t want a dishwasher and probably not a laundry machine. Why do my wash at home, when I can take it to town, do it while buying groceries or surfing the web there? Just another appliance to break down.
Being that I can’t afford a color television, I often hear about from people news stories that I had no idea actually happened.
Not that I trust the news – I often think the politicians and government workers make up shit to seem important and TV stations play back press releases with stock and AI generated footage, rather then report on what is actually happening.
Probably would have not been the best weekend to spend out in the wilderness. That said, I’m thinking seriously about taking Friday off and heading north to Piseco-Powley for one last weekend of the summer, with the following weekend working remote on Friday from the Spectulator Library after setting up camp somewhere in the Mason Lake, Speculator Tree Farm or Old Route 8B area for the Labor Day Weekend.
It seems werid to think summer is coming to it’s logical conclusion so quickly. 🍂 Soon it will be camping season for long weekends at Rensselaerville State Forest 🌲 as I can work remote from there, yet not be too far home especially with the shorter days. Seems sad that I’m losing out on this weekend, but yesterday was quiet, as I read, worked on some blog code (breaking some things), 💻 worked on some work stuff including improving my label generation and suppressions code for work, 🤖 and road out to Voorheesville and walked through the tick-infested fields 🌱 of the Black Creek Marsh. 🐸
I was up around 5:30 AM as I am most days, 🌆 made up some ground oatmeal with blueberries and bananas 🍌 and had lots of coffee. ☕ Off to Walmart before the crowds, then I may come home and read for a few hours 📚 as many of my library e-books will automatically be returned this week after three weeks since July 31 comes and goes. Then it’s off to the parents house for Sunday dinner, probably the last time until Labor Day Weekend as I probably won’t come back particularly early from the Adirondacks next weekend. 🍉 Hopefully not hamburgers, because that seems like the only thing they cook any more, but maybe because it’s easy and they’re getting older. I’m increasingly horrified about what I see in their pantry, but then I grew up on that crap. And both of them have diabetes now. It will be the first meat I’ve eaten since I’ve been there last week. 🥩 Hopefully not steak, as I have that dinner at 677 Prime next week. Got look all swanky for that. Taking the bus so I don’t have to worry about having a beer or two before heading home on ol’ 18. Sometimes you need a break from all that healthy shit.
Baked some bread for the first time since spring. 🍞 It’s been a long time since I’ve had bread. Came out a bit salty, I must have dropped too much salt on it. It seems like with the brining salt I use that often grab too much salt, and I know salt is unhealthy, but it’s not like I’m getting out of processed foods, as I don’t eat those. I’ve been looking for new things to eat, as I’m getting bored with having fried zucchini and onions six or seven nights a week, even if it’s relatively healthy and easy to cook. The egg plant was a change, but it’s still not all that unlike egg plant and summer squash. I was thinking soon it will be winter squash and pumpkin season, both which are excellent backed in the oven, the later with lots of cinnamon and ginger.
Yesterday was humid and smokey from the wildfire smoke. ☁️ Really nothing positive to say about the weather yesterday. The library was crowded and I worked outside until my laptop battery 🔋 was done after about an hour and a half. There was some things I’m trying to perfect with the blog’s revised style sheet, but I wanted to go a simpler style. I also think I will move away from SVGZ graphics, as I’m having trouble with the export with the latest version of R’s graphics device and SVGs that have been compressed, and most people prefer JPGs even if they are kind of silly in principle for vector-based on graphics. 🖼 The space and bandwidth savings isn’t that much, and the thing is I’m now automatically cleaning up short-term photos, graphics and graphs with an expiration tag after about two weeks by defaults. 💾


 I’m increasingly horrified about what I see in their pantry,
  but then I grew up on that crap. And both of them have diabetes now.
  It will be the first meat I’ve eaten since I’ve been there last week. 🥩 Hopefully not steak, as I have that dinner at 677 Prime next week. Got look all swanky for that.
  Taking the bus so I don’t have to worry about having a beer or two before heading home on ol’ 18. Sometimes you need a break from all that healthy shit.
 It seems like with the brining salt I use that often grab too much salt, and I know salt is unhealthy, but it’s not like I’m getting out of processed foods, as I don’t eat those.
  I’ve been looking for new things to eat, as I’m getting bored with having fried zucchini and onions six or seven nights a week, even if it’s relatively healthy and easy to cook. The egg plant was a change,
  but it’s still not all that unlike egg plant and summer squash. I was thinking soon it will be winter squash and pumpkin season, both which are excellent backed in the oven, the later with lots of cinnamon and ginger.