Been doing a lot of research and experimentation with interpolation of spatial data with R – for example trying to derive block level estimates of election results from election districts – assuming that blocks in Democratic leaning EDs near more Republican EDs will be more Republican. Practical, not sure but interesting. R has some really interesting interpolation libraries and it usually only requires a few lines of code thanks to the ease of the tidyverse.
Also been learning about doing essentially the reverse of that – taking point data or smaller polygons and aggregating it upwards to larger shapes. Tomorrow’s map of the day is an example of that – I calculated based on tax rolls the percentage of buildings each block in New York State where the buildings likely contain asbestos materials – buildings built from 1920 to 1979. Turns out tidyverse is good for that too, mutate a new field that shows if building in that range, do a st_join, then pipe into a group by and then summarize by what you want such as creating a percentage. Neat stuff.
Duanesburg Churches Road
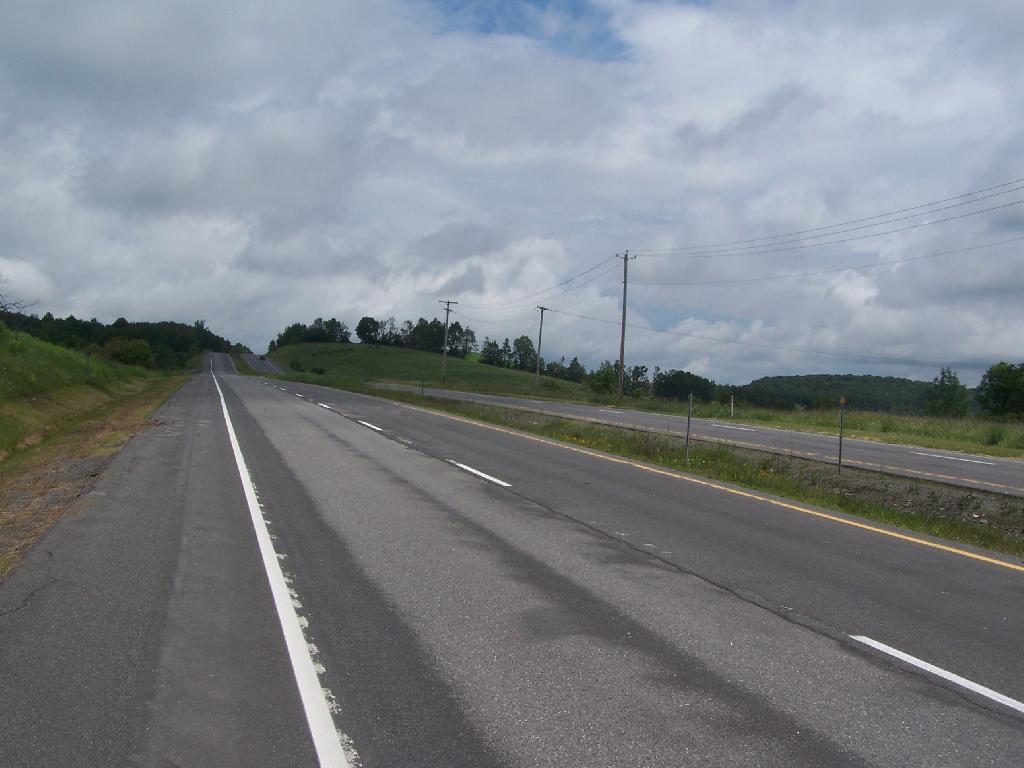
Heading along Duanesburg Churches Road between NY 30 and US 20 to shunpike the city traffic on this beautiful Sunday afternoon.
May 29, 2022 – Fair Weather Clouds As Seen on Aqua
Driving
Hillabrandt Vly
Hillabrandt Vly on a beautiful early spring afternoon in Ferris Lake Wild Forest outside of Caroga Lake in the Southern Adirondacks.
Seventh Lake
BofA
Any further drop in Russian oil supply is likely to lead to a global recession and could even trigger a full-blown energy crisis that pushes prices past $150 a barrel, strategists at Bank of America have warned in a note.
Russian oil production has fallen by roughly 1 million barrels per day (bpd) in 2022, according to a BofA team led by Francisco Blanch. The fall has come as countries and traders cut their purchases of the country's energy following its invasion of Ukraine.

