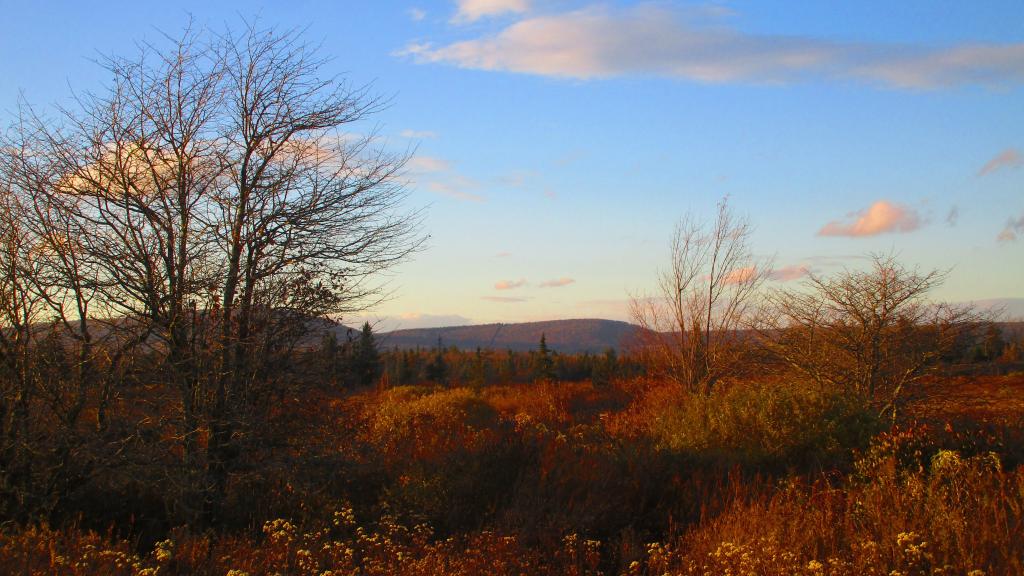
This time I was less impressed with the mountains in West Virginia. While certainly bigger than the hills I woke up to this morning camping at Long Pond, they just don’t seem the way they once did in West Virginia.
Maybe it’s because it’s my fifth trip to West Virginia and the scenery isn’t as new and impressive. Visiting Dolly Sods from the much higher base elevation from the West – namely Canaan Valley Wildlife Refuge and Forest Road 80 Freeland Road made the 4,000 summit less impressive. Plus I didn’t get to the real high country – Spruce Knob Mountain area a dozen miles south.
But also looking at Canaan and Backbone Mountain from Olson Firetower made me rethink how impressive the landscape really is. Some of the peaks in that part of West Virginia while maybe high in total elevation are rather flat peaked and modest in elevation gain. I guess if I had been more around the Allegheny Front, North Mountain and Backbone Mountain from Bears Rocks in West Virginia I might have had an alternative take.
I don’t know. But maybe my dreams of the impressive hills and hollows of West Virginia where just that – more myth then reality. The truth is I see a lot of the hilltowns of Albany County or even the hollows of Schoharie County in West Virginia. The people there aren’t much different than the people I grew up knowing. The trailers, junk cars and ramshackle homestead all look familiar. Even much of Dolly Sods and Canaan Mountain remind me of parts of the Taconics and Berkshire Mountains, Canaan Heights, WV has a striking resemblance to Canaan, NY especially if you visit the high point at Harvey Hill State Forest.
Sister counties — these are counties that have most similar land cover by percentage, i.e. similar amounts of urbanization, crop land, hay fields, trees. Often, but not always these counties border each other. Sometimes this is true in both directions but not always. Fun with R.
Albany – Schenectady
Allegany – Cattaraugus
Bronx – Queens
Broome – Tioga
Cattaraugus – Allegany
Cayuga – Seneca
Chautauqua – Oswego
Chemung – Chenango
Chenango – Otsego
Clinton – Fulton
Columbia – Cortland
Cortland – Columbia
Delaware – Cattaraugus
Dutchess – Orange
Erie – Onondaga
Essex – Warren
Franklin – Lewis
Fulton – Clinton
Genesee – Seneca
Greene – Sullivan
Hamilton – Herkimer
Herkimer – St. Lawrence
Jefferson – Chautauqua
Kings – New York
Lewis – St. Lawrence
Livingston – Wyoming
Madison – Oneida
Monroe – Niagara
Montgomery – Tompkins
Nassau – Richmond
New York – Kings
Niagara – Wayne
Oneida – Madison
Onondaga – Ontario
Ontario – Livingston
Orange – Dutchess
Orleans – Niagara
Oswego – Chautauqua
Otsego – Chenango
Putnam – Dutchess
Queens – Bronx
Rensselaer – Schoharie
Richmond – Nassau
Rockland – Westchester
Saratoga – Fulton
Schenectady – Albany
Schoharie – Tioga
Schuyler – Steuben
Seneca – Cayuga
St. Lawrence – Lewis
Steuben – Schuyler
Suffolk – Monroe
Sullivan – Greene
Tioga – Broome
Tompkins – Schuyler
Ulster – Greene
Warren – Essex
Washington – Oneida
Wayne – Niagara
Westchester – Rockland
Wyoming – Livingston
Yates – Livingston
The Zonal Histogram was created in QGIS using the NLCD ’19 data. Here is the R script:
library(tidyverse)
rm(list=ls())

# read exported zonal histogram
hist <- read_csv('Desktop/county.csv')

# calculate rowwise percentages of land use
hist <- hist %>% rowwise() %>% mutate(total = sum(across(contains('HISTO_')))) %>%
  mutate(across(contains('HISTO_'), ~(./total)*100 ))

# include only relevant rows -- those in the histogram
hist <- hist %>% select(NAME10, contains('HISTO_'))


# go through each county
for (county in sort(hist$NAME10)) {
  searchCounty <- hist %>% filter(NAME10 == county)


  # calculate distance between search county and others
  # make our searchCounty dataframe the same size as the histogram table
  # subtract from histogram dataframe, taking absolute value
  # sum rows to calculate the distance from the county
  # bind to histogram dataframe
  # better explanation: https://stackoverflow.com/questions/55681573/how-can-i-find-the-record-from-a-data-set-that-is-most-similar-to-a-test-record

  bd <- cbind(hist, dist=rowSums(abs(hist[,-1] - searchCounty[rep(1, nrow(hist)), -1]))) %>%
    arrange(dist)

  print(paste(county,'-',bd[2,1]))
}