essays

Math of Toughening MPG Standards

With the recent government mandated fuel economy standards, there has been a lot of confusion on what is cost-effective, and how much money will be saved with various standards will across the fleet of vehicles. Here is some tables that will help you understand what various improvements on fuel economy really mean.

MPG Improvements.

MPG 10% 20% 30% 40% 50%
10 11 12 13 14 15
15 16.5 18 19.5 21 22.5
20 22 24 26 28 30
25 27.5 30 32.5 35 37.5
30 33 36 39 42 45
35 38.5 42 45.5 49 52.5
40 44 48 52 56 60
50 55 60 65 70 75

Fuel Savings, gallons per 100k mile.

MPG 10% 20% 30% 40% 50%
10 909 1,667 2,308 2,857 3,333
15 606 1,111 1,538 1,905 2,222
20 455 833 1,154 1,429 1,667
25 364 667 923 1,143 1,333
30 303 556 769 952 1,111
35 260 476 659 816 952
40 227 417 577 714 833
50 182 333 462 571 667

Money Saved, per 100k mile @ $3.50/gallon fuel.

MPG 10% 20% 30% 40% 50%
10 $3,182 $5,833 $8,077 $10,000 $11,667
15 $2,121 $3,889 $5,385 $6,667 $7,778
20 $1,591 $2,917 $4,038 $5,000 $5,833
25 $1,273 $2,333 $3,231 $4,000 $4,667
30 $1,061 $1,944 $2,692 $3,333 $3,889
35 $909 $1,667 $2,308 $2,857 $3,333
40 $795 $1,458 $2,019 $2,500 $2,917
50 $636 $1,167 $1,615 $2,000 $2,333

Maximum Cost for 2:1 Payback.

MPG 10% 20% 30% 40% 50%
10 $1,591 $2,917 $4,038 $5,000 $5,833
15 $1,061 $1,944 $2,692 $3,333 $3,889
20 $795 $1,458 $2,019 $2,500 $2,917
25 $636 $1,167 $1,615 $2,000 $2,333
30 $530 $972 $1,346 $1,667 $1,944
35 $455 $833 $1,154 $1,429 $1,667
40 $398 $729 $1,010 $1,250 $1,458
50 $318 $583 $808 $1,000 $1,167

Why I Will Never Own a Foreign Car

While I’ve only owned two different cars in my life, my parents 1994 Plymouth Sundance and my current 1998 Ford Ranger, I do not see myself buying a foreign made car or truck in the foreseeable future. Six years ago when I bought the Ranger I had considered foreign cars, but now I’ve learned why I will not buy an foriegn car.

Simply said, a car or truck is a big purchase. While quality of the vehicle is always important, so is the quality it represents to the community as a whole. Most American manufacturers are union-based, from the Assembly plant to the part manufacturers. Most American cars consist of parts and labor constructed in the United States, such as the typical Chevrolet Silverado or Ford F-150 pickup trucks, which average betwen 75-85% American-made.

Sure It Would Be Nice to Have a Truck Like This

When you buy an American-made and Union-made car (even a used one), you are buying a vehicle:

  • Made in a place where workers enjoy a clear voice on important work place issues.
  • Unions advocate for fair pay and benefits for workers, good healthcare, good public services for working people.
  • Union work places are safe work places, workers advocate for a good working environment.
  • American-made cars are overwhelminly made in America, where there are some of the best standards in the world for clean air and clean water.
  • Your investing in your neighbors — there is often a lot more automotive manufacturing locally then you realize
  • That American-car you buy, more likely then not has parts made in Cortland, Ithaca, North Syracuse, Tonawanda, Massena, and Buffalo.

While many foreign-brand cars are made in the United States, most are made in the South, in plants that pay less and offer less benefits to their workers. Foreign car assembly plants and part suppliers are typically non-unionized. Without unions, nobody is advocating for good working conditions or protections for those who live in the communities where cars are made.

Nowadays, American-made cars are often as good if not better then Foreign-made cars. People do not realize that. Voting for foriegn cars by buying them new or used, means your taking jobs from your community, shipping them down to sweatshops down south or across the globe. These are your neighbors, the folks who hunt, fish, camp, farm, and help conserve the wild spaces. These are the same people who are involved in your community.

As far as I can see, there is only one clear choice — Buy American, Buy Union!

Legitimate $$ Free MONEY $$ (Not a Scam)

Ever wonder how you can make significantly more money, with minimal effort? There is a great “Work from Home Opportunity” that can save you a lot of money, if you only choose to:

  1. Do some pretty simple math (optional).
  2. Flip some switches.
  3. Unplug some appliances.

How do you get this free money? Very simple. It’s lying around in your home, in almost invisible locations. It takes almost no effort. It’s what people have been telling you for years, but you’ve not been listening.

It’s called conserving energy!

Wow. Now for the math part, to calculate how much you can save in electricity by taking some really simple steps.

Step 1: Realize There Are 8,760 hours in a Year.

That is a pretty big number. While most of us think of their being 24 hours in a day and 365 days in a year, we rarely multiply both numbers together. Yet, we should when talking about energy, because we use energy like electricity even when we sleep or at out of the house.

Step 2: Realize Electricity Is Sold in Very Small Bundles.

That is compared to typical household electrical consumption. Power companies bill you on kilowatt hours. So if you use on average 1,000 watts per hour, you use 8,760 kw/h of electricity per year.

The way electricity is priced is similiar to a grocery stores selling food “by the teaspoon”. Shelve prices at such a “by the teaspoon” grocery store might look cheap, but when you get to the register, you would be shelling out some real cash.

Step 3: Realize Electricity Only Looks Cheap.

Electricity where I live costs about 15 1/2 cents per kilowatt hour. Seems pretty cheap. You could use 9,600 watts for an hour, for the same price of a $1.50 bus pass. That’s more energy then your electric clothes drier would use in an hour.

The problem comes in that most people don’t use electricity for an hour. They use it for multiple hours, indeed throughout the year, all 8,760 hours of the year. While people turn appliances on and off, the reality is a lot of electricity is being used year round.

Step 4: Calculate Your Savings.

Once you realize how expensive energy is, the trick is to calculate your savings and figure out where you can spare a couple of watts here and there. Maybe unplugging the television when your not using it rather then putting it in sleep mode, could save you $5 or $10 a year, making sure the computer is turned off when your not using it, could be another free $50-$75 in cash that otherwise would have just gone to power company.

This table looks a that math, based on the typical 15.5¢ an Albany resident would typically pay for electricity. Evidentially, even that little amount adds up. Do you really need that extra alarm clock? Unplug it! That’s another free $8.15 per year in Albany. Replace that 100-watt incadescent bulb you use on average 6-hours per day with a 26 watt florescent equalivent bulb, and get a free $16.75 for each bulb you change per year.

Typical Monthly Energy Costs in Albany-area.

Can you turn some of the below appliances off? How often do they stay on, wasting energy? This is how much you’ll save in energy in Albany.

Appliance Energy Rating in watts 1 hour per day 2 hours per day 4 hours per day 6 hours per day 12 hours per day 24 hours per day
LED Night Light 0.5 $0.00 $0.00 $0.01 $0.01 $0.03 $0.06
LED Christmas Lights 4 $0.02 $0.04 $0.08 $0.11 $0.23 $0.45
Regular Night Light 5 $0.02 $0.05 $0.09 $0.14 $0.28 $0.57
Clock Radio/Alarm Clock 6 $0.03 $0.06 $0.11 $0.17 $0.34 $0.68
60 Watt Equivalent CFL 13 $0.06 $0.12 $0.25 $0.37 $0.74 $1.47
Desktop Computer (Sleep Mode) 15 $0.07 $0.14 $0.28 $0.42 $0.85 $1.70
100 watt Equivalent CFL 26 $0.12 $0.25 $0.49 $0.74 $1.47 $2.94
36 in Ceiling Fan (High) 55 $0.26 $0.52 $1.04 $1.56 $3.11 $6.22
60 Watt Incadecent 60 $0.28 $0.57 $1.13 $1.70 $3.39 $6.79
Laptop Computer 80 $0.38 $0.75 $1.51 $2.26 $4.53 $9.05
100 watt Incadescent Bulb 100 $0.47 $0.94 $1.89 $2.83 $5.66 $11.32
Refrigerator (Average) 100 $0.47 $0.94 $1.89 $2.83 $5.66 $11.32
Desktop Computer 150 $0.71 $1.41 $2.83 $4.24 $8.49 $16.97
Xbox 360 185 $0.87 $1.74 $3.49 $5.23 $10.47 $20.93
PS3 194 $0.91 $1.83 $3.66 $5.49 $10.98 $21.95
50 in LCD Television 250 $1.18 $2.36 $4.71 $7.07 $14.14 $28.29
50 in Plasma Televison 300 $1.41 $2.83 $5.66 $8.49 $16.97 $33.95
Medium Electric Space Heater 900 $4.24 $8.49 $16.97 $25.46 $50.92 $101.84
Window AC Unit 900 $4.24 $8.49 $16.97 $25.46 $50.92 $101.84
Coffee Maker 900 $4.24 $8.49 $16.97 $25.46 $50.92 $101.84
Electric Oven 2000 $9.43 $18.86 $37.72 $56.58 $113.15 $226.30
Washing Machine 3800 $17.92 $35.83 $71.66 $107.49 $214.99 $429.97
Electric Clothes Drier 9000 $42.43 $84.86 $169.73 $254.59 $509.18 $1,018.35

Typical Yearly Energy Costs in Albany-area.

Now if you think you can’t make some real savings in a month, consider the power consumption for these common items over a year.

Appliance Energy Rating in watts 1 hour per day 2 hours per day 4 hours per day 6 hours per day 12 hours per day 24 hours per day
LED Night Light 0.5 $0.03 $0.06 $0.11 $0.17 $0.34 $0.68
LED Christmas Lights 4 $0.23 $0.45 $0.91 $1.36 $2.72 $5.43
Regular Night Light 5 $0.28 $0.57 $1.13 $1.70 $3.39 $6.79
Clock Radio/Alarm Clock 6 $0.34 $0.68 $1.36 $2.04 $4.07 $8.15
60 Watt Equivalent CFL 13 $0.74 $1.47 $2.94 $4.41 $8.83 $17.65
Desktop Computer (Sleep Mode) 15 $0.85 $1.70 $3.39 $5.09 $10.18 $20.37
100 watt Equivalent CFL 26 $1.47 $2.94 $5.88 $8.83 $17.65 $35.30
36 in Ceiling Fan (High) 55 $3.11 $6.22 $12.45 $18.67 $37.34 $74.68
60 Watt Incadecent 60 $3.39 $6.79 $13.58 $20.37 $40.73 $81.47
Laptop Computer 80 $4.53 $9.05 $18.10 $27.16 $54.31 $108.62
100 watt Incadescent Bulb 100 $5.66 $11.32 $22.63 $33.95 $67.89 $135.78
Refrigerator (Average) 100 $5.66 $11.32 $22.63 $33.95 $67.89 $135.78
Desktop Compuer 150 $8.49 $16.97 $33.95 $50.92 $101.84 $203.67
Xbox 360 185 $10.47 $20.93 $41.87 $62.80 $125.60 $251.19
PS3 194 $10.98 $21.95 $43.90 $65.85 $131.71 $263.41
50 in LCD Television 250 $14.14 $28.29 $56.58 $84.86 $169.73 $339.45
50 in Plasma Televison 300 $16.97 $33.95 $67.89 $101.84 $203.67 $407.34
Medium Electric Space Heater 900 $50.92 $101.84 $203.67 $305.51 $611.01 $1,222.02
Window AC Unit 900 $50.92 $101.84 $203.67 $305.51 $611.01 $1,222.02
Coffee Maker 900 $50.92 $101.84 $203.67 $305.51 $611.01 $1,222.02
Electric Oven 2000 $113.15 $226.30 $452.60 $678.90 $1,357.80 $2,715.60
Washing Machine 3800 $214.99 $429.97 $859.94 $1,289.91 $2,579.82 $5,159.64
Electric Clothes Drier 9000 $509.18 $1,018.35 $2,036.70 $3,055.05 $6,110.10 $12,220.20

Four Lanes is Enough

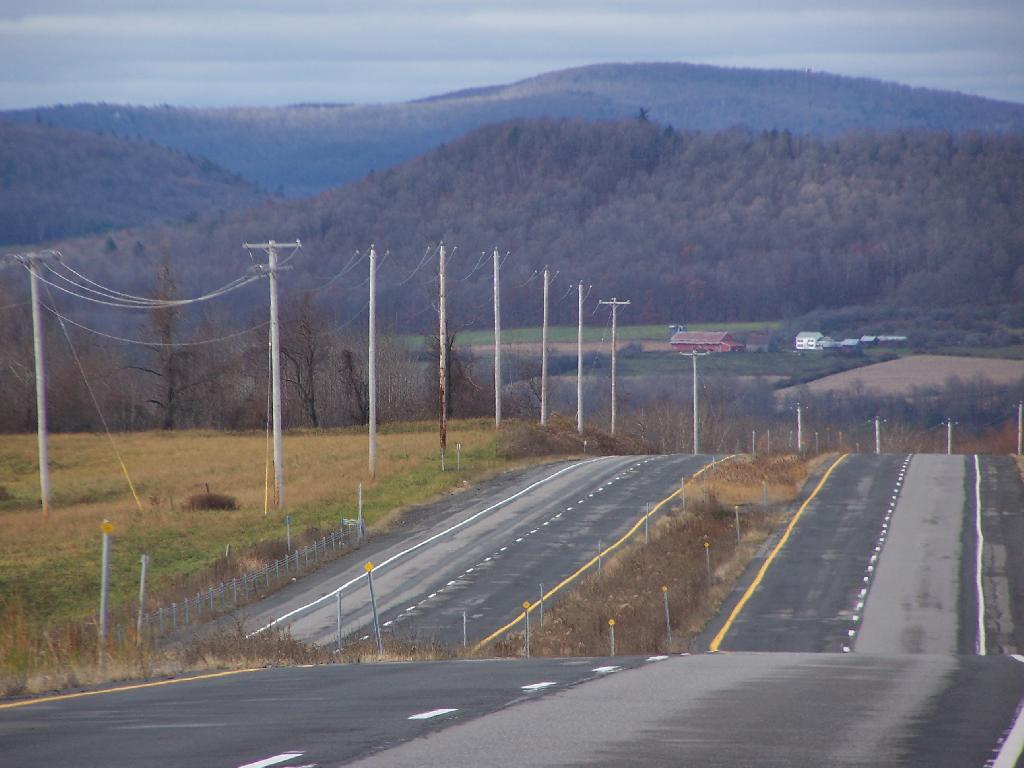
As a simple rule, there should be no highways built with more then four lanes, anywhere. One of the biggest mistakes made by traffic engineers is that more lanes are always more desirable, and that roads must be “super-sized” to meet any future demand for traffic growth.

I’ve driven on many roads wider then 4-lanes. There has never been a six-lane or eight lane road I have driven on that is a pleasurable experience, even at light traffic conditions. When roads expand beyond two lanes in each direction, they naturally become uncomfortable for drivers, as they force them focus on multiple in directions, and always keep an eye on cars coming at them in unexpected ways.

The Road

There is a case for building four lane arterials. Having two lanes in each direction makes for safe passing by automboiles. Drivers wishing to go a little faster then other drivers, simply move over into the passing lane and pass the other automobile. Cars heading in the opposite direction are segregated by means of a median. They are safer.

Roads need not be built more then four lanes wide. If traffic patterns suggest wider arterials are needed, then a rethinking of transportation policy in that area should be undertaken. Why are so many people regularly taking private cars? Could we build a transit line for people, or a railroad line for freight?

Fatter is not better when it comes to roads.

Christmas Comes and Goes Once Again

As a kid, I used to get more excited about Christmas. As I got older, I got less excited, mainly as I realized what an empty and kind repetive holiday it really was. Now it’s just another day, with some turkey and food at the family’s house. It’s great, but now it’s gone once again.

Sure there will be New Years, the celebration, the food, and watching the ball drop. But then the Christmas lights will go dark. The tree and all that Christmas trash will get hauled out to curb in city, or burned in the country. It will be all gone.

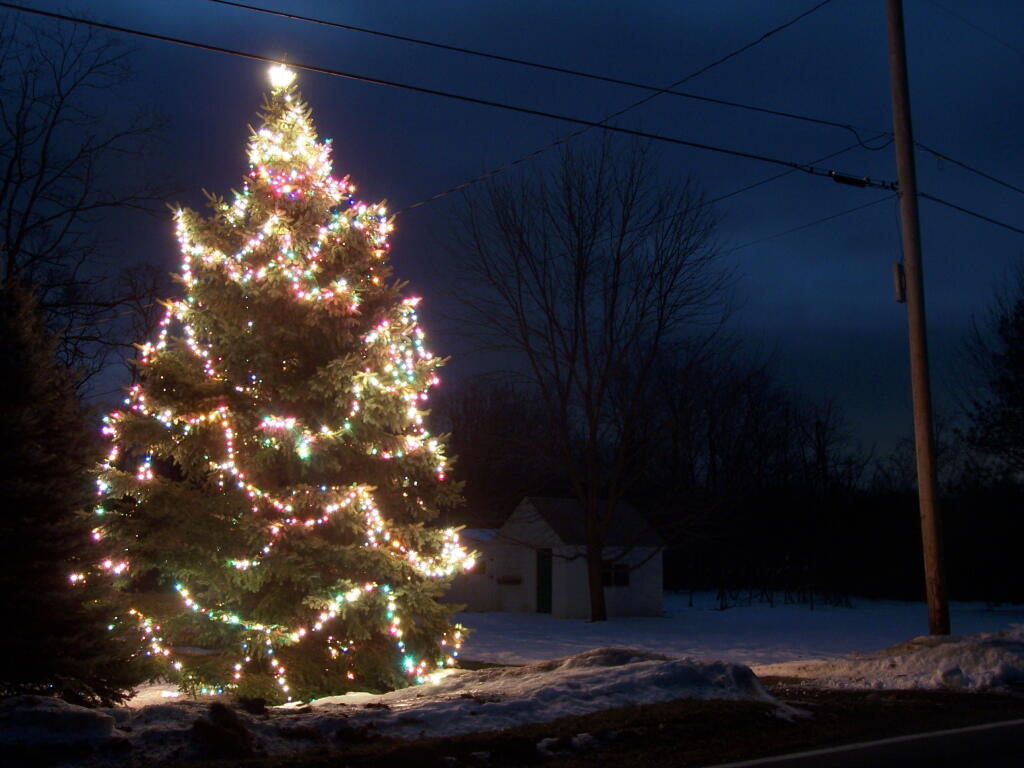
Christmas Tree I

The colorful lights that lit the outside of buildings will be dimmed and dismantled. The season’s joy will either go in the trash or into the attic to be hid away for another year. It will be all over but the cold of winter. We can keep the smiles on our faces for another week, but then we are facing the most brutal month of the year.

Albany doesn’t get a lot of snow. But it gets a lot of cold. January’s heating bills promise to be high. There will be ice and snow, miserable days standing out in the bus stop as we work our way into a new year. It’s going to be winter. There will be no more lights or holiday cheer. Christmas is over!

Past and Present Management Of Moose River Plains

Today’s fodder was is an excerpt from “Moose River Plains Wild Forest Revised Draft Unit Management Plan/Draft Generic Environmental Impact Statement ‐ July 2010”, Appendix III, a NYS Department of Conservation Document that is in the public domain. As the DEC will probably eventually remove this from the internet, and because it is only in PDF I have decided to share it in the entirity in this blog post.

I have added some pictures I’ve taken over the years at Moose River Plains. I hope you find this interesting and helpful. – Andy

Past and Present Management Of Moose River Plains.
As Written By NYSDEC, Revised Draft Unit Management Plan

The State acquired an original tract of 9,000 acres in the heart of what is now the MRPWF before 1900. In 1948 the Conservation Department issued a permit allowing Gould Paper Company to use an existing wagon road known as the Kenwell Road to haul timber across State lands and to maintain a gate at the end of the road near Limekiln Lake to prevent public access. The Department acquired 15,710 acres surrounding Limekiln Lake from Gould in 1960, then another Gould parcel encompassing Lost Ponds and containing approximately 1,803 acres in 1962. An individual owner sold the State a parcel of 356 acres including Beaver Lake in 1963. The majority of what is now the MRPWF and the northern part of the West Canada Lake Wilderness was added to the Forest Preserve in 1963 when Gould Paper Company sold the State a tract of 50,970 acres stretching from Horn Lake on the west to Manbury Mountain on the east. Major subsequent additions included 602 acres surrounding Wakely Dam and the north end of Cedar River Flow from Finch, Pruyn and Company in 1964 and two large parcels acquired from International Paper Company: the 1,120‐acre Cellar Mountain parcel in 1986 and a tract of 9,925 acres south of Wakely Mountain in 1988. The larger parcel was acquired subject to a 1987 easement conveyed by IP to Hamilton County for the maintenance of the four miles of Cedar River Road which crossed the parcel. Appendix 25 contains an acquisition map.

A small parcel was acquired in 1981 along Route 28. This acquisition included access to the shore of Fourth Lake. However, there is no potential to develop any water access at this location. Appendix 15 contains a deed and sketch map for this parcel.
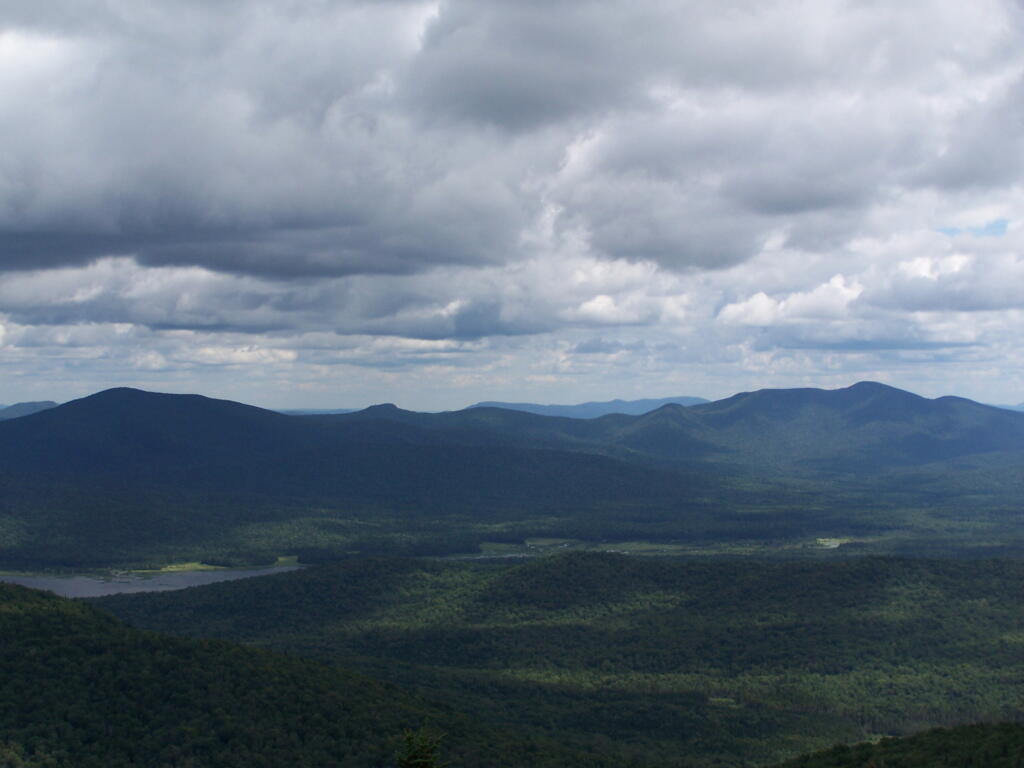
Moose River Plains Overview

After this major acquisition, the Department took an active approach to the management of the area then referred to as the Moose River Recreation Area, a name which reflected the intent behind the purchase. From the beginning, the Department pursued the development of an extensive road system to provide public access to the remote interior for hunting, trapping, fishing and camping. An early Department report indicated that there were about 178 miles of primary gravel roads and an equal extent of secondary and winter roads throughout the former Gould lands. However none of the roads was suitable for public motor vehicle use without significant improvement. Minutes to a meeting of Department staff on December 9, 1963 included an estimated cost of $25,000 for the annual maintenance of 50 miles of roads and bridges. Starting in 1964, Division of Fish and Wildlife staff used heavy equipment to improve roads initially identified for public use. When the area first was opened to the public on October 23, 1964, the road connecting the Limekiln and Cedar River entrances had just been cleared by bulldozer, but remained difficult to traverse. In addition to the LLCR Road, the Rock Dam Road, Otter Brook Road and Sly Pond Loop were open to public use by permit for a total of about 30 miles. Fifty‐six parking areas were established along the road system. At the entrance gates, cars were assigned parking areas and travel was allowed only to and from those areas. The public were four‐wheel drive vehicles or tire chains. Pickups with slip‐on campers were permitted from the start, but because the roads were not yet suitable, trailers were not permitted.
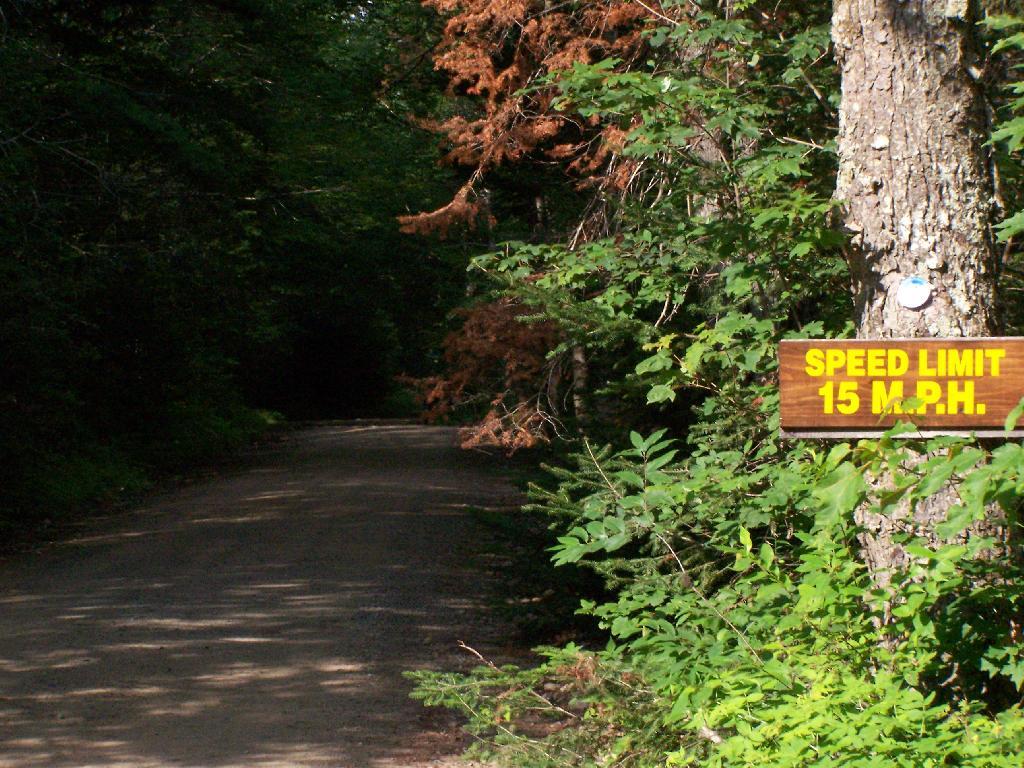
Speed Limit 15 MPH

In a road plan adopted in 1965, roads to be designated were divided into three categories. Twenty‐two miles would be first priority roads, open to all traffic; 30.5 miles would be second priority roads open only to fourwheel drive vehicles; and 7.5 miles would be administrative roads restricted to use by Department staff for crossing private property. In the first years after the area was opened to the public, access remained difficult because of the effects of weather on road conditions. In the summer of 1965, work needed to make the roads passable delayed opening until July 1. In order to minimize fire danger and facilitate the disposal of trash, the public was allowed to camp only in areas adjacent to the roads and for a maximum of 3 days. Trash receptacles eventually were provided at most campsites and Department staff collected trash twice a week through the 1970s. The trash was deposited at a dump site south of the LLCR Road east of Helldiver Pond.
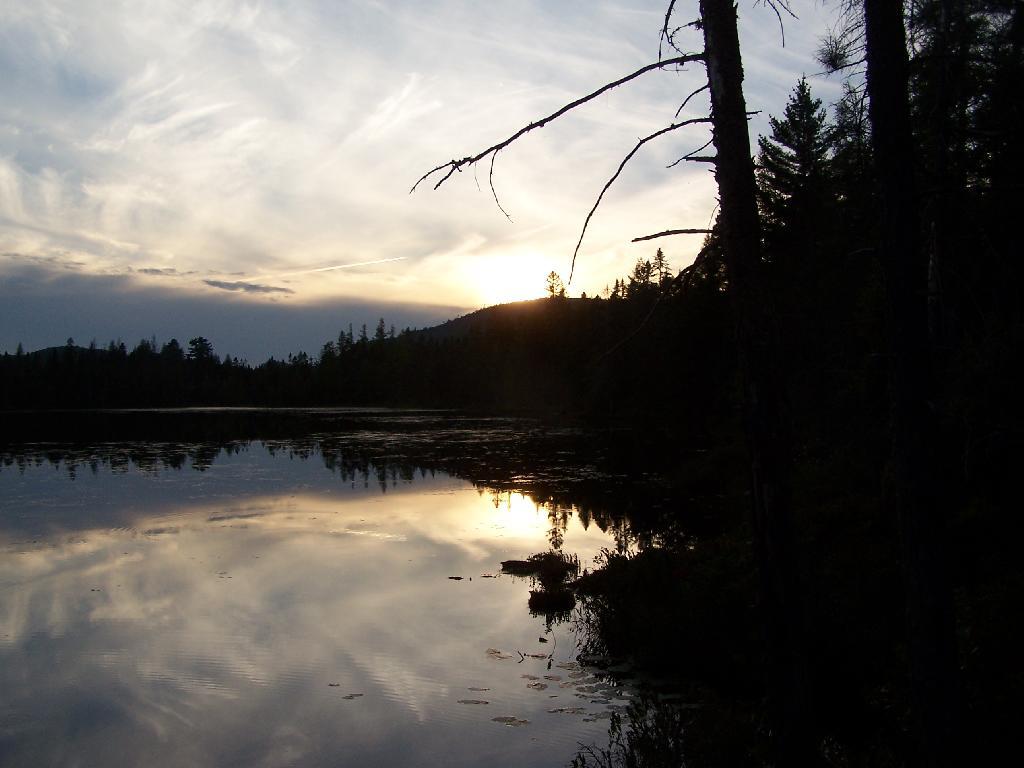
Helldiver Pond in Evening

The road crew worked steadily year by year to improve the roads with the intention of ultimately allowing them to be traveled safely by cars. After the extensive logging by Gould, especially after the 1950 Blowdown, much of the area was occupied by thick low vegetation, the tops of harvested and wind‐thrown trees. Foot travel was difficult. To allow hunters to more easily travel through more remote areas in search of game, Fish and Wildlife staff used a bulldozer to clear and extend logging roads and skid trails to serve as foot trails, starting in the late 1960s. Trails cleared in this way include routes to Mitchell Ponds, Bear Pond, Lost Ponds, Cellar Pond, Beaver Lake, Sly Pond and Squaw Lake, as well as those along Benedict Creek and Butter Brook. A number of routes cleared at that time are now within the West Canada Lake Wilderness, including the trails to Horn Lake and Falls Pond. Many of the cleared routes extended beyond the trails currently marked and maintained. A map prepared by Jack Harnish, a member of the crew that did the trail clearing work, is on file with the Department.
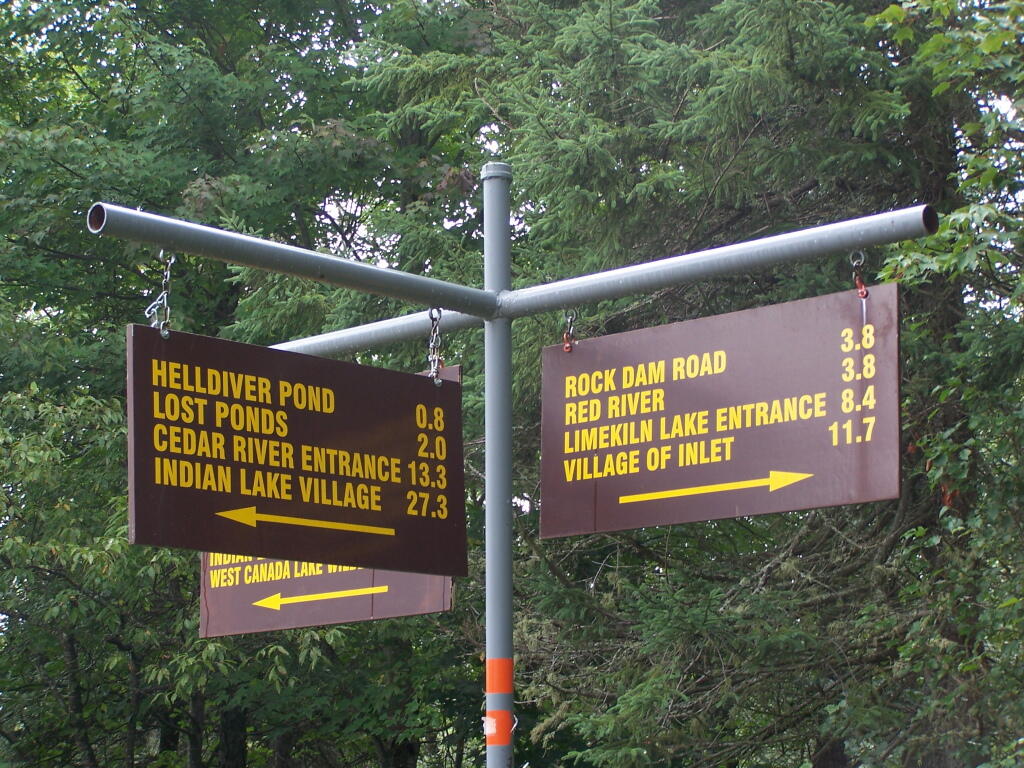
Direction Sign at The Big T Junction

The minutes of the December 9, 1963 Department staff meeting mentioned above included in the list of recommendations for the operation of the area that the Department should establish several small camping areas to include table, fireplace and latrine throughout the area adjacent to the roads where parties can park and camp. By 1965 the Department began constructing campsites and installing fireplaces, picnic tables and privies, which were built in a field just west of the Cedar River entrance. At each suitable location along the road system, a bulldozer was used to make a short access driveway and level an area where a car or pickup truck could park and camp. A number of campsites were created at former log landings. Many of the areas originally intended as roadside parking areas later were converted to campsites. Campsite construction was completed by the late 1960s.
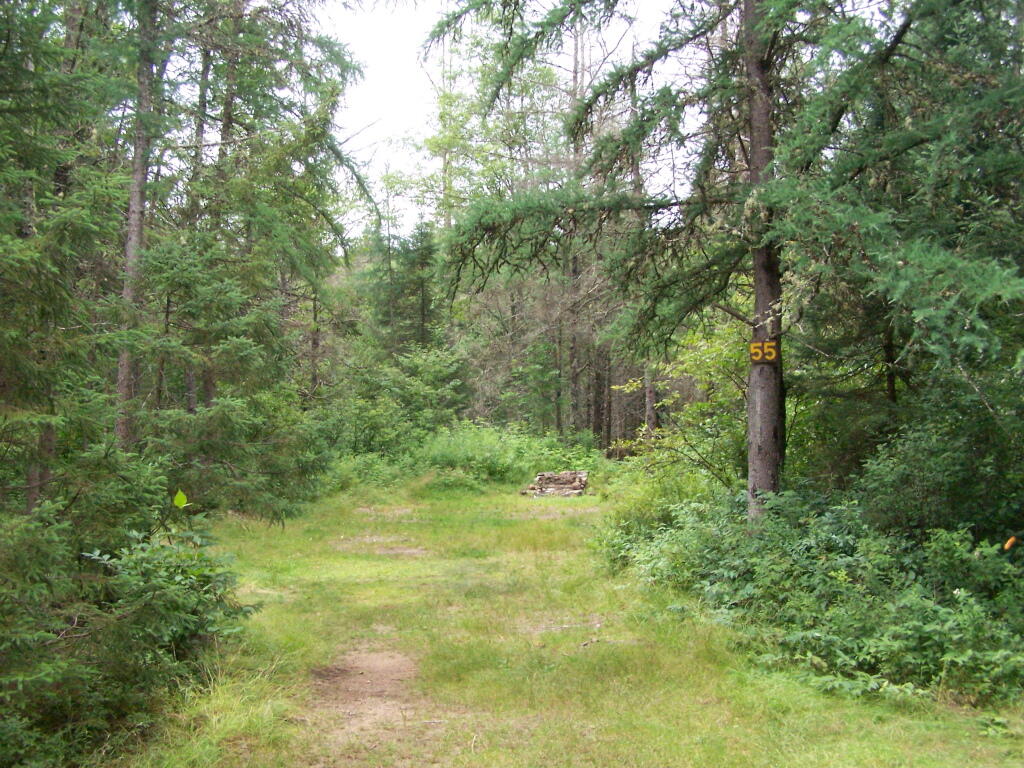
Campsite 55

Because of the importance of the Plains as a deer wintering area, the Departments game management staff began studying the area in 1931. Hunting and fishing advocates such as the Adirondack Conservation Council supported the acquisition of the Plains and the development of its roads, trails and campsites for hunting and fishing access. In 1965 and 1966 with federal Pittman‐Robertson Act funding, 30 log landings were graded for hunter parking access and 30,000 trees were planted in the Plains area as an experiment intended to provide winter deer shelter.
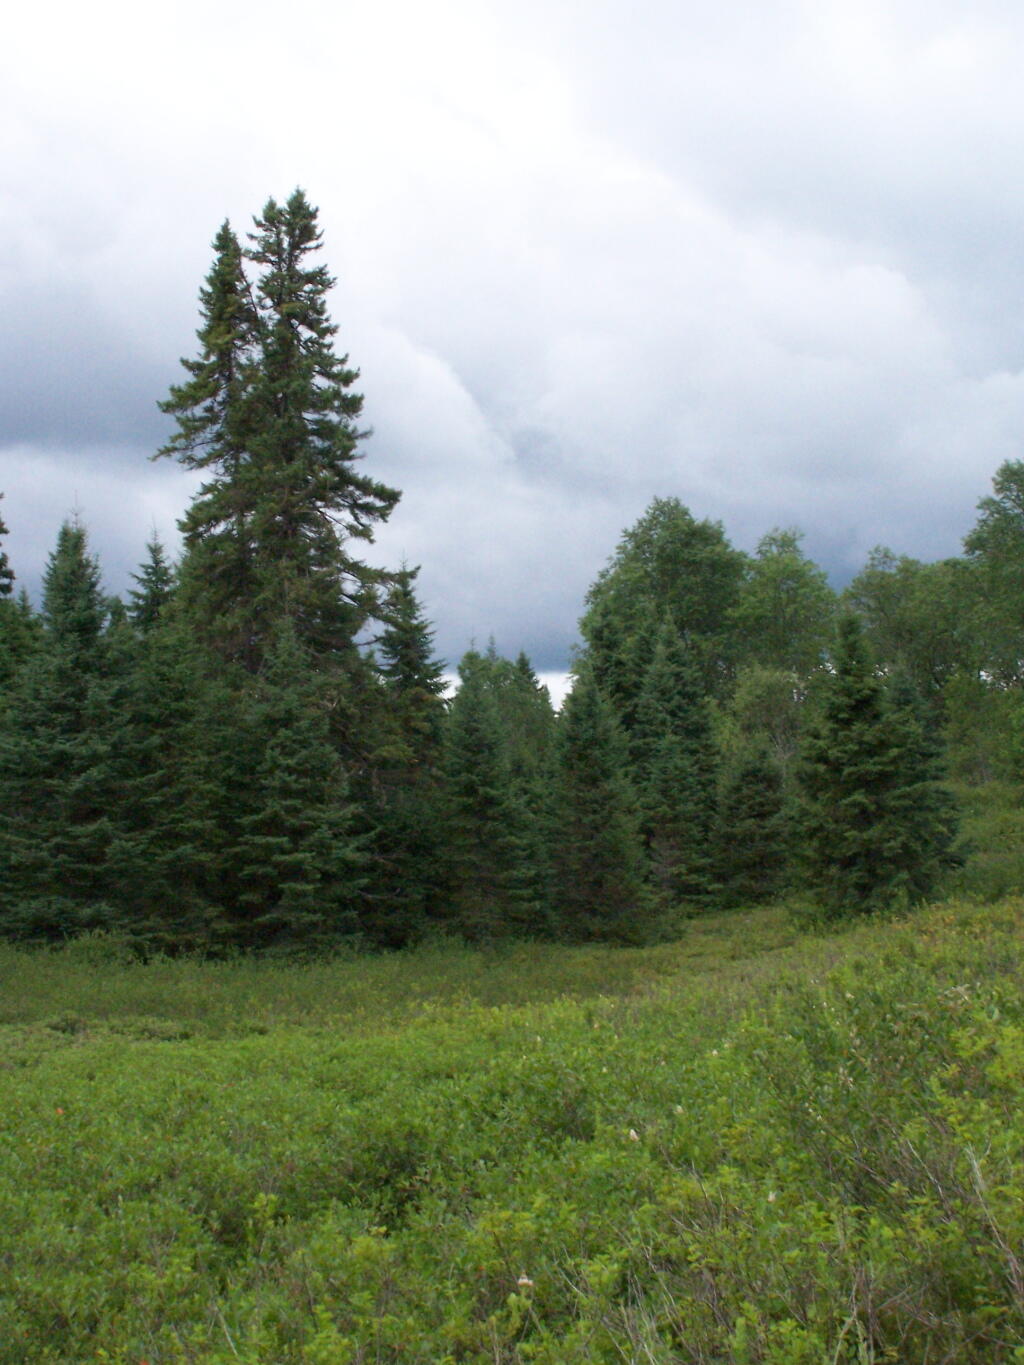
Tall Pines in the Plains

In 1965 housing was constructed for the Limekiln and Cedar River gatekeepers. The possibility of a use fee was discussed, but no fee was charged during the early years. During the 1976 season the Department charged a fee of $1.50 or $2.00 per car. A subsequent assessment determined that most of the revenue generated by the fee was offset by the costs of staffing and administration. The fee was discontinued the following year.
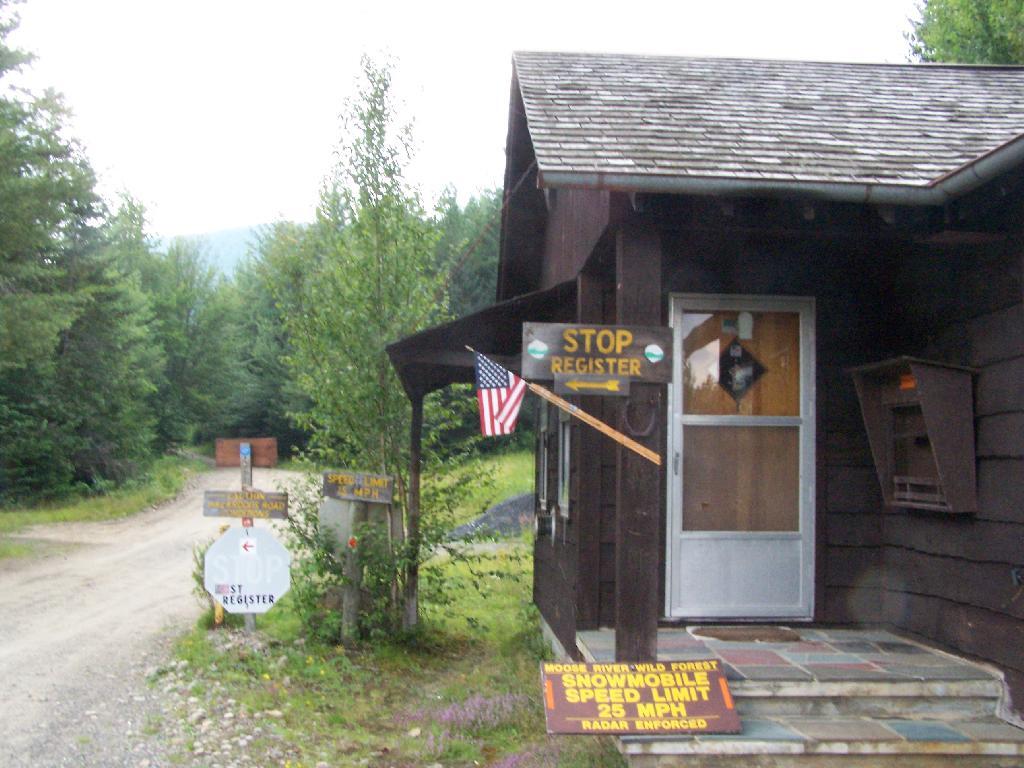
Entrance to Moose River Plains

Work to clear hunter access trails by bulldozer continued for a few years. However, after repeated incidents of public motor vehicle travel on these trails, 16 barriers were installed in 1970, and motor vehicles no longer were used to maintain the trails. Also in 1970, the original road plan was changed to close 22.5 miles of the original III. Management and Policy Moose River Plains Wild Forest Revised Draft Unit Management Plan/Draft Generic Environmental Impact Statement ‐ July 2010 67 30.5 miles of secondary roads to the public and retain them as administrative roads. The other 8 miles, consisting of the beginning of the Otter Brook truck trail and the road to the Indian River, were upgraded to primary roads and the gate at the Otter Brook bridge was removed.
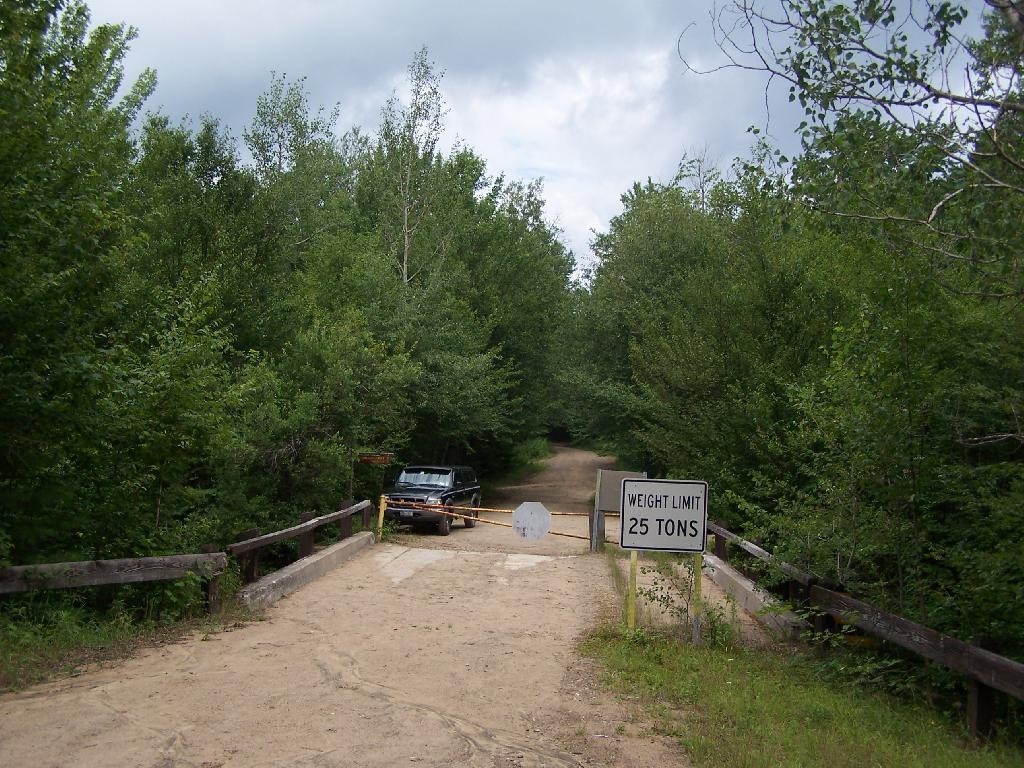
Otter Brook Bridge is Closed

As work progressed over the years and the condition of the road system improved, the Department relaxed restrictions on the types of vehicles the public could drive. In the late 1960s the Department decided to allow motorhomes up to 22 feet long to travel the roads through big game hunting season, as long as they had tire chains. It was thought that they were less likely to get stuck than vehicles towing camping trailers, which the Department continued to prohibit. However, pressure to allow trailers began early and continued to grow. After Department staff conducted an assessment of the roads and determined that they had been sufficiently improved, they decided to allow trailers beginning around 1980.

For several years after the Department first erected wood signs in the MRPWF, they were repeatedly damaged by black bears. To prevent further destruction, metal signs were installed in 1975.
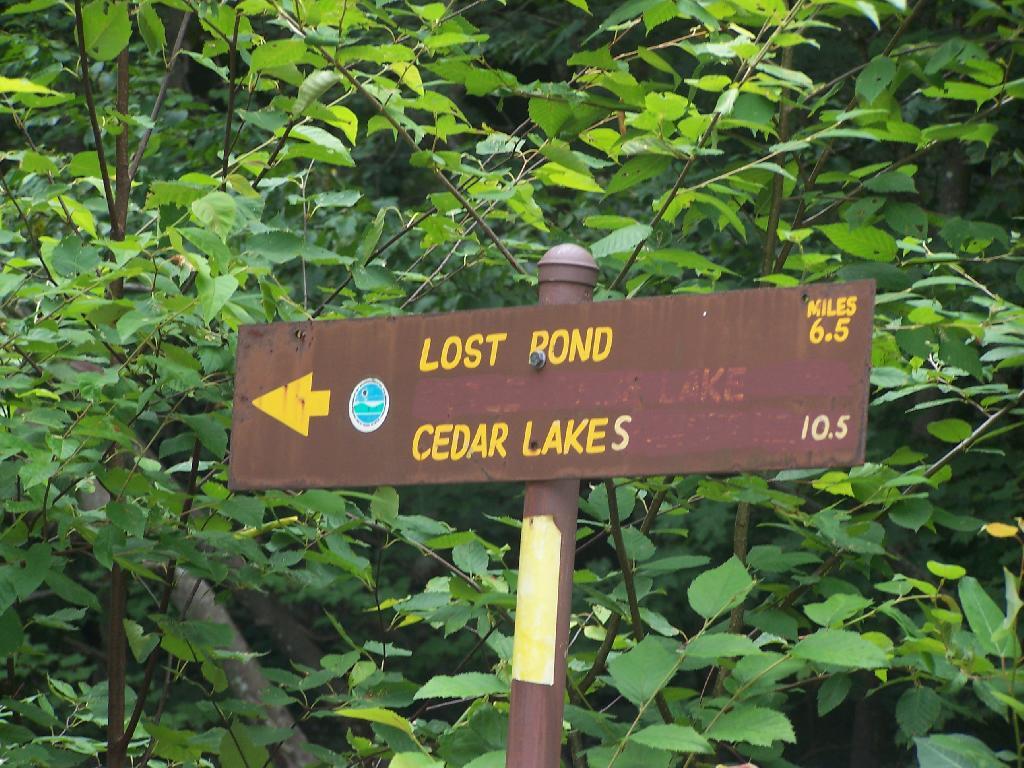
6.5 Miles to Lost Pond

A detailed Department map prepared in 1977 shows 222 campsite and parking area locations along the road system. The map provides an inventory of the structures at each site, showing the prevalence of fireplaces, picnic tables and privies at the time. Twenty sites were closed in 1980 after the reclassification of the southwestern portion of the area to wilderness, when the road to the Indian River was gated at Indian Lake. The campsites were not given numbers on the ground until the 1980s. A number of original sites that had fallen into disuse were bypassed when the numbers were assigned, so that in 2008 there are 170 numbered sites. In 2006 sites 7, 34, 66, 73, 90, 119a, 130 , and site 1 at Cedar River Flow were modified and designated as accessible sites.

In recent years, maintenance activities have focused on keeping the road system in passable condition, replacing inadequate culverts and trail maintenance. In 2001, four gravel pits were reclaimed and replanted.
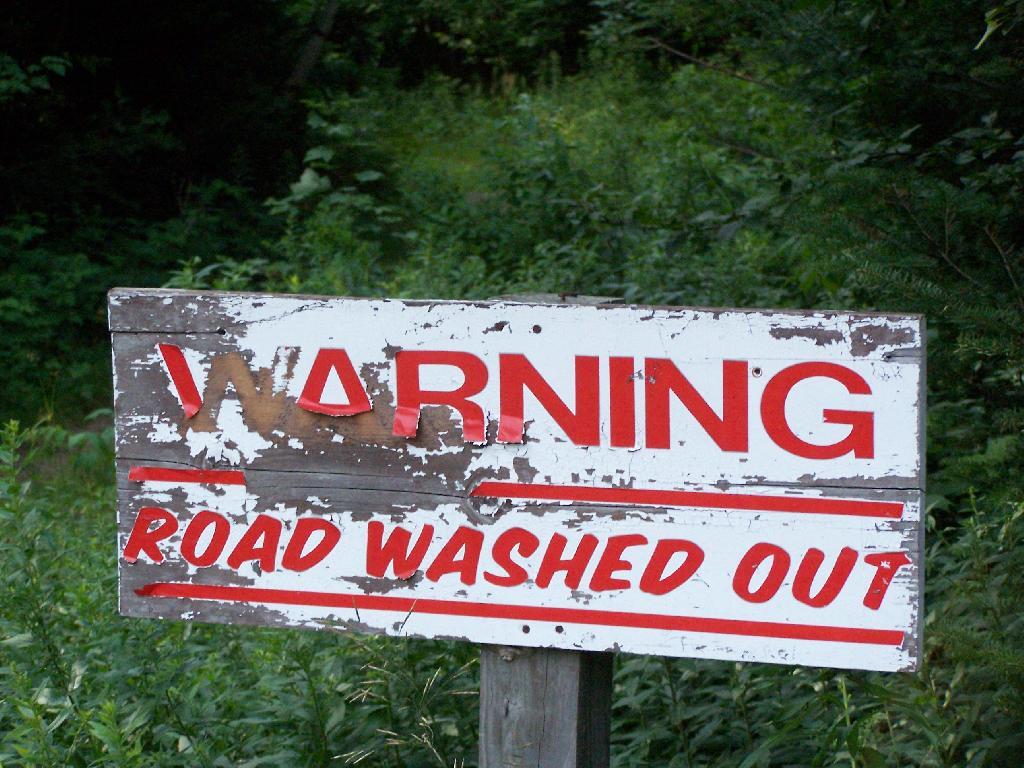
Warning! Road Washed Out

In 1996 an engineering evaluation was completed for the public motor vehicle roads in the unit. The report focused on 8 major and 12 minor culvert problem areas and made recommendations for replacing existing culverts with new structures of sufficient capacity to handle a design storm of 100‐year occurrence probability with a snowmelt allowance. Between 2000 and 2005, 11 of the 12 minor sites, with the exception of site 10B, were addressed and site 5A of the major sites is the only one complete. The report and an updated status can be found in Appendix 22.
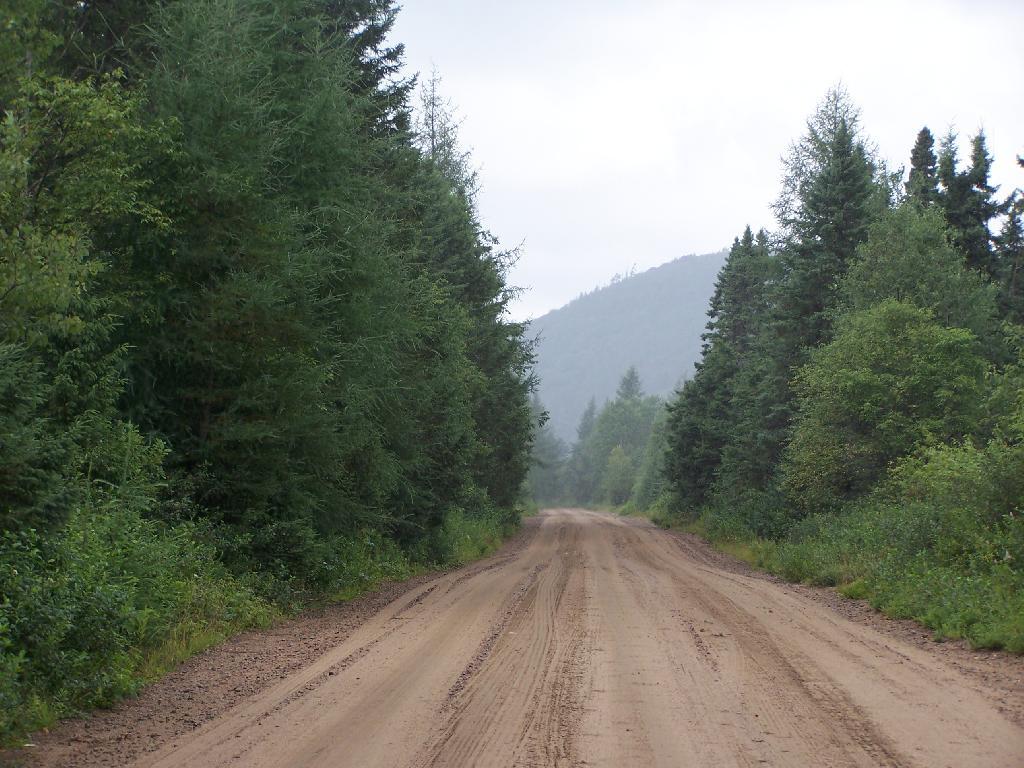
Straight Thru the Plains

In 1974, jurisdiction over approximately one acre of State land was transferred from the Hudson River‐Black River Regulating District to the Department for use as a canoe access site on Sixth Lake. In 1986, the Department transferred jurisdiction of 6.41 acres of State land along Sagamore Road to DOT. This parcel encompasses an old sand pit and was transferred so that DOT could relocate their maintenance facility from an area immediately adjacent to State Route 28 to a more screened location. DEC reserved the right to use gravel from this site, as long as it did not interfere with the DOT facility. Currently DOT does not use the site, but may use it at some time in the future.

Moose River Plains Overview

When the Moose River Recreation Area was first opened to the public, use levels were relatively high. During big game hunting season in 1964, 2,021 vehicles with 5,764 passengers signed in. Though the area originally was purchased and developed for use by hunters, trappers and anglers, the first 10‐day report filed after the 1965 opening on July 1 indicated that 75 percent of visitors were campers and sight‐seers. In 1966, 7,809 people signed in as anglers and 23,408 camper‐days were recorded during big game hunting season, about 6,000 of which were recorded for campsites beyond the Otter Brook bridge. Big game hunters were very successful in the early years, harvesting 373 deer and 15 bear in 1966 and a high of 404 deer in 1968. Deer harvest levels declined sharply after 1969, with 77 harvested in 1970 and 11 in 1971. Since the 1970s the number of deer taken by hunters has increased and in recent years harvest numbers have nearly returned to the levels recorded in the 1960s. The MRPWF remains popular with hunters, trappers and anglers.
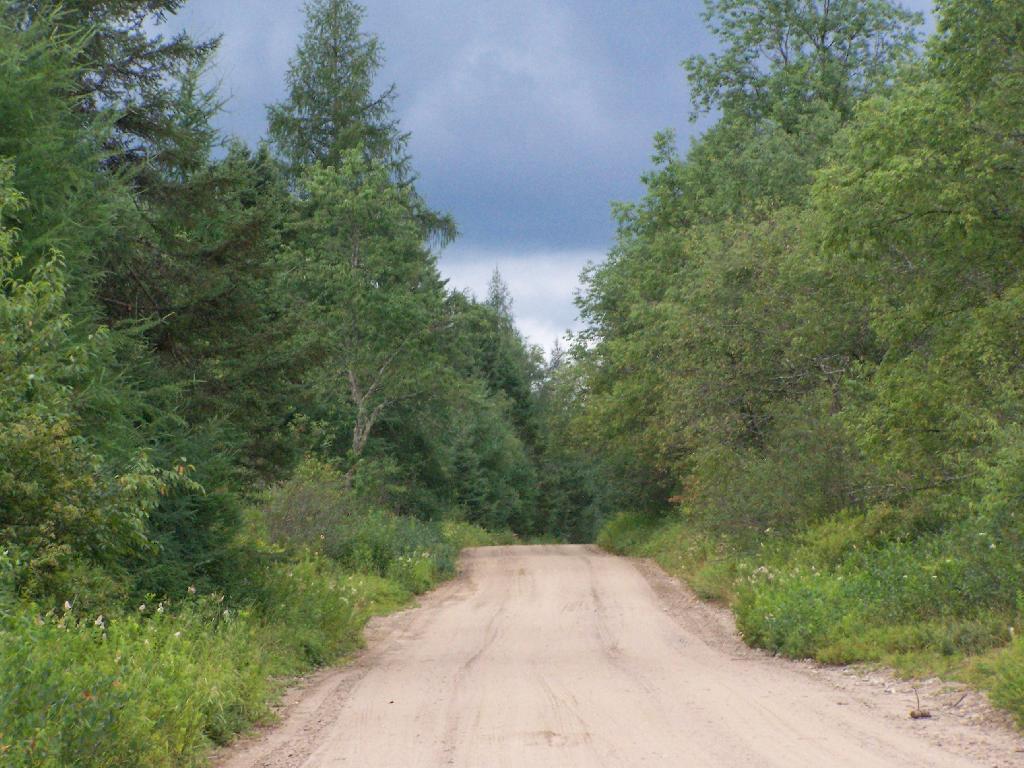
Thunderstorm Coming to the Plains

Early management included the adoption of a number of regulations in 1972. These regulations, which still apply to public use of the area, require visitors to register at the Cedar River and Limekiln entrances, require the use of tire chains after October 1 except on 4‐wheel drive vehicles, prohibit snowmobile operation during the big game hunting season and prohibit the use of motorcycles and motorized bicycles. Current conditions may warrant the elimination of the registration requirement and the prohibition against motorcycle use.
A Cornerstone of Smart Policy

Many people do not understand what the notion of being a progressive is about. It’s the notion that the more wealth, the more power, the larger the insitution, the faster the regulatory and taxation burden should grow. A progressive taxation system would follow a curve like this:

  • $1 Earned, 5% taxation on first dollar
  • $2 Earned, 10% taxation on second dollar
  • $3 Earned, 15% taxation on third dollar
  • $4 Earned, 20% taxation on fourth dollar
  • $5 Earned, 25% taxation on fifth dollar

In other words:

  • You make $1, you pay a total of 5 cents in taxes
  • You make $2, you pay a total of 15 cents in taxes
  • You make $3, you pay a total of 35 cents in taxes
  • You make $4, you pay a total of 80 cents in taxes
  • You make $5, you pay a total of 125 cents in taxes

Alternatively, a progressive scheme can be created/and or enhanced by “flat” tax cuts, such as giving a equal tax credit regardless of wealth. For example, let’s say you cut everybody’s tax bill by $500 per year. The rich person who pays $10,000 in taxes gets them reduced to $9,500, while the poor person who pays $750 in taxes, only pays $250 in taxes. The value to the poor person is far greater then the wealthier person.

There are three reasons why progressive taxation (and regulation) is an important concept for society.

  • We want to encourage growth by making it easier for people to get started in business with a much lower regulatory and taxation burden
  • The Law of Diminishing Marginal Utility states that every additional dollar or additional product that one owns, the value to the owner decreases.
  • We want to discourage businesses from growing too large, dominating the economy, and discouraging innovation.

Untitled

Society needs taxes to pay for the public services, programs, and infrastructure that are used in common or are neccessary to promote a just and fair society. Yet, when we tax society, we should always be working to create a tax and regulatory structure:

  • That encourages small businesses to grow.
  • That encourages creativity and new approaches to old problems.
  • That allow less affluent people to accumulate money and resources to help them invest in their own future and become more affluent.

Good tax policy encourages innovation and growth. That’s what progressive tax policy does, unlike other more regressive schemes of taxation that over-tax the poor, and discourage them from making the investments needed for growth and personal improvement.