
Nurturing a New Era of Edible Insects | Morning Ag Clips
GREENWICH, N.Y. — Insects are typically a nuisance most farmers try to eradicate from their farms, but in some areas, they are nurtured. We often do not think about farming insects, but it is a lucrative opportunity as the world continues to evolve on a more sustainable path. The new era of edible insect farming has begun opening up a world of possibilities and reshaping the way we look at today’s agriculture.
This idea of mini livestock farming, or farming microstock, is not new to the U.S. It is estimated there are somewhere between 21 to 50 insect farms currently in the U.S. It is hard to pin down just how many there are due to the high turnover of start-ups, but this is still a fairly large number especially when we compare it to other alternative livestock farming such as camel dairies that have only a handful of farms devoted strictly to them. With such a high turnover rate though, can we honestly expect the insect farming industry to take off in the U.S.?
MTA Region Population
Here is a look at the MTA Region and it’s population over the years.
| MTA Region Population, 1920-2020 | |||||||||||
| Region | 1920 | 1930 | 1940 | 1950 | 1960 | 1970 | 1980 | 1990 | 2000 | 2010 | 2020 |
|---|---|---|---|---|---|---|---|---|---|---|---|
| Long Island | 2.28% | 3.69% | 4.48% | 6.40% | 11.72% | 14.00% | 14.84% | 14.50% | 14.51% | 14.62% | 14.46% |
| New York City | 54.12% | 55.06% | 55.31% | 53.22% | 46.37% | 43.29% | 40.28% | 40.70% | 42.20% | 42.19% | 43.58% |
| Quarter Pounder | 2.58% | 2.46% | 2.61% | 2.69% | 3.15% | 4.01% | 4.79% | 5.09% | 5.29% | 5.58% | 5.61% |
| Upstate | 37.71% | 34.66% | 33.35% | 33.48% | 33.94% | 33.80% | 35.16% | 34.84% | 33.13% | 32.71% | 31.37% |
| Westchester | 3.32% | 4.14% | 4.26% | 4.22% | 4.82% | 4.90% | 4.94% | 4.86% | 4.87% | 4.90% | 4.97% |
| Andy Arthur, 3/6/23. Data Source:
IPUMS. 2022. http://doi.org/10.18128/D050.V17.0 |
|||||||||||
Here is the raw numbers for counties from IPUMS/NHGIS.
| County Population, 1920-2020 | |||||||||||
| County | 1920 | 1930 | 1940 | 1950 | 1960 | 1970 | 1980 | 1990 | 2000 | 2010 | 2020 |
|---|---|---|---|---|---|---|---|---|---|---|---|
| Albany | 186,106 | 211,953 | 221,315 | 239,386 | 272,926 | 286,742 | 285,909 | 292,594 | 294,565 | 304,204 | 314,848 |
| Allegany | 36,842 | 38,025 | 39,681 | 43,784 | 43,978 | 46,458 | 51,742 | 50,470 | 49,927 | 48,946 | 46,456 |
| Bronx | 732,016 | 1,265,258 | 1,394,711 | 1,451,277 | 1,424,815 | 1,471,701 | 1,168,972 | 1,203,789 | 1,332,650 | 1,385,108 | 1,472,654 |
| Broome | 113,610 | 147,022 | 165,749 | 184,698 | 212,661 | 221,815 | 213,648 | 212,160 | 200,536 | 200,600 | 198,683 |
| Cattaraugus | 71,323 | 72,398 | 72,652 | 77,901 | 80,187 | 81,666 | 85,697 | 84,234 | 83,955 | 80,317 | 77,042 |
| Cayuga | 65,221 | 64,751 | 65,508 | 70,136 | 73,942 | 77,439 | 79,894 | 82,313 | 81,963 | 80,026 | 76,248 |
| Chautauqua | 115,348 | 126,457 | 123,580 | 135,189 | 145,377 | 147,305 | 146,925 | 141,895 | 139,750 | 134,905 | 127,657 |
| Chemung | 65,872 | 74,680 | 73,718 | 86,827 | 98,706 | 101,537 | 97,656 | 95,195 | 91,070 | 88,830 | 84,148 |
| Chenango | 34,969 | 34,665 | 36,454 | 39,138 | 43,243 | 46,368 | 49,344 | 51,768 | 51,401 | 50,477 | 47,220 |
| Clinton | 43,898 | 46,687 | 54,006 | 53,622 | 72,722 | 72,934 | 80,750 | 85,969 | 79,894 | 82,128 | 79,843 |
| Columbia | 38,930 | 41,617 | 41,464 | 43,182 | 47,322 | 51,519 | 59,487 | 62,982 | 63,094 | 63,096 | 61,570 |
| Cortland | 29,625 | 31,709 | 33,668 | 37,158 | 41,113 | 45,894 | 48,820 | 48,963 | 48,599 | 49,336 | 46,809 |
| Delaware | 42,774 | 41,163 | 40,989 | 44,420 | 43,540 | 44,718 | 46,824 | 47,225 | 48,055 | 47,980 | 44,308 |
| Dutchess | 91,747 | 105,462 | 120,542 | 136,781 | 176,008 | 222,295 | 245,055 | 259,462 | 280,150 | 297,488 | 295,911 |
| Erie | 634,688 | 762,408 | 798,377 | 899,238 | 1,064,688 | 1,113,491 | 1,015,472 | 968,532 | 950,265 | 919,040 | 954,236 |
| Essex | 31,871 | 33,959 | 34,178 | 35,086 | 35,300 | 34,631 | 36,176 | 37,152 | 38,851 | 39,370 | 37,381 |
| Franklin | 43,541 | 45,694 | 44,286 | 44,830 | 44,742 | 43,931 | 44,929 | 46,540 | 51,134 | 51,599 | 47,555 |
| Fulton | 44,927 | 46,560 | 48,597 | 51,021 | 51,304 | 52,637 | 55,153 | 54,191 | 55,073 | 55,531 | 53,324 |
| Genesee | 37,976 | 44,468 | 44,481 | 47,584 | 53,994 | 58,722 | 59,400 | 60,060 | 60,370 | 60,079 | 58,388 |
| Greene | 25,796 | 25,808 | 27,926 | 28,745 | 31,372 | 33,136 | 40,861 | 44,739 | 48,195 | 49,221 | 47,931 |
| Hamilton | 3,970 | 3,929 | 4,188 | 4,105 | 4,267 | 4,714 | 5,034 | 5,279 | 5,379 | 4,836 | 5,107 |
| Herkimer | 64,962 | 64,006 | 59,527 | 61,407 | 66,370 | 67,633 | 66,714 | 65,797 | 64,427 | 64,519 | 60,139 |
| Jefferson | 82,250 | 83,574 | 84,003 | 85,521 | 87,835 | 88,508 | 88,151 | 110,943 | 111,738 | 116,229 | 116,721 |
| Kings | 2,018,356 | 2,560,401 | 2,698,285 | 2,738,175 | 2,627,319 | 2,602,012 | 2,230,936 | 2,300,664 | 2,465,326 | 2,504,700 | 2,736,074 |
| Lewis | 23,704 | 23,447 | 22,815 | 22,521 | 23,249 | 23,644 | 25,035 | 26,796 | 26,944 | 27,087 | 26,582 |
| Livingston | 36,830 | 37,560 | 38,510 | 40,257 | 44,053 | 54,041 | 57,006 | 62,372 | 64,328 | 65,393 | 61,834 |
| Madison | 39,535 | 39,790 | 39,598 | 46,214 | 54,635 | 62,864 | 65,150 | 69,120 | 69,441 | 73,442 | 68,016 |
| Monroe | 352,034 | 423,881 | 438,230 | 487,632 | 586,387 | 711,917 | 702,238 | 713,968 | 735,343 | 744,344 | 759,443 |
| Montgomery | 57,928 | 60,076 | 59,142 | 59,594 | 57,240 | 55,883 | 53,439 | 51,981 | 49,708 | 50,219 | 49,532 |
| Nassau | 126,120 | 303,053 | 406,748 | 672,765 | 1,300,171 | 1,428,080 | 1,321,582 | 1,287,348 | 1,334,544 | 1,339,532 | 1,395,774 |
| New York | 2,284,103 | 1,867,312 | 1,889,924 | 1,960,101 | 1,698,281 | 1,539,233 | 1,428,285 | 1,487,536 | 1,537,195 | 1,585,873 | 1,694,251 |
| Niagara | 118,705 | 149,329 | 160,110 | 189,992 | 242,269 | 235,720 | 227,354 | 220,756 | 219,846 | 216,469 | 212,666 |
| Oneida | 182,833 | 198,763 | 203,636 | 222,855 | 264,401 | 273,037 | 253,466 | 250,836 | 235,469 | 234,878 | 232,125 |
| Onondaga | 241,465 | 291,606 | 295,108 | 341,719 | 423,028 | 472,746 | 463,920 | 468,973 | 458,336 | 467,026 | 476,516 |
| Ontario | 52,652 | 54,276 | 55,307 | 60,172 | 68,070 | 78,849 | 88,909 | 95,101 | 100,224 | 107,931 | 112,458 |
| Orange | 119,844 | 130,383 | 140,113 | 152,255 | 183,734 | 221,657 | 259,603 | 307,647 | 341,367 | 372,813 | 401,310 |
| Orleans | 28,619 | 28,795 | 27,760 | 29,832 | 34,159 | 37,305 | 38,496 | 41,846 | 44,171 | 42,883 | 40,343 |
| Oswego | 71,045 | 69,645 | 71,275 | 77,181 | 86,118 | 100,897 | 113,901 | 121,771 | 122,377 | 122,109 | 117,525 |
| Otsego | 46,200 | 46,710 | 46,082 | 50,763 | 51,942 | 56,181 | 59,075 | 60,517 | 61,676 | 62,259 | 58,524 |
| Putnam | 10,802 | 13,744 | 16,555 | 20,307 | 31,722 | 56,696 | 77,193 | 83,941 | 95,745 | 99,710 | 97,668 |
| Queens | 469,042 | 1,079,129 | 1,297,634 | 1,550,849 | 1,809,578 | 1,986,473 | 1,891,325 | 1,951,598 | 2,229,379 | 2,230,722 | 2,405,464 |
| Rensselaer | 113,129 | 119,781 | 121,834 | 132,607 | 142,585 | 152,510 | 151,966 | 154,429 | 152,538 | 159,429 | 161,130 |
| Richmond | 116,531 | 158,346 | 174,441 | 191,555 | 221,991 | 295,443 | 352,121 | 378,977 | 443,728 | 468,730 | 495,747 |
| Rockland | 45,548 | 59,599 | 74,261 | 89,276 | 136,803 | 229,903 | 259,530 | 265,475 | 286,753 | 311,687 | 338,329 |
| Saratoga | 60,029 | 63,314 | 65,606 | 74,869 | 89,096 | 121,679 | 153,759 | 181,276 | 200,635 | 219,607 | 235,509 |
| Schenectady | 109,363 | 125,021 | 122,494 | 142,497 | 152,896 | 160,979 | 149,946 | 149,285 | 146,555 | 154,727 | 158,061 |
| Schoharie | 21,303 | 19,667 | 20,812 | 22,703 | 22,616 | 24,750 | 29,710 | 31,859 | 31,582 | 32,749 | 29,714 |
| Schuyler | 13,098 | 12,909 | 12,979 | 14,182 | 15,044 | 16,737 | 17,686 | 18,662 | 19,224 | 18,343 | 17,898 |
| Seneca | 24,735 | 24,983 | 25,732 | 29,253 | 31,984 | 35,083 | 33,733 | 33,683 | 33,342 | 35,251 | 33,814 |
| St. Lawrence | 88,121 | 90,960 | 91,098 | 98,897 | 111,239 | 111,991 | 114,254 | 111,974 | 111,931 | 111,944 | 108,505 |
| Steuben | 80,627 | 82,671 | 84,927 | 91,439 | 97,691 | 99,546 | 99,217 | 99,088 | 98,726 | 98,990 | 93,584 |
| Suffolk | 110,246 | 161,055 | 197,355 | 276,129 | 666,784 | 1,124,950 | 1,284,231 | 1,321,864 | 1,419,369 | 1,493,350 | 1,525,920 |
| Sullivan | 33,163 | 35,272 | 37,901 | 40,731 | 45,272 | 52,580 | 65,155 | 69,277 | 73,966 | 77,547 | 78,624 |
| Tioga | 24,212 | 25,480 | 27,072 | 30,166 | 37,802 | 46,513 | 49,812 | 52,337 | 51,784 | 51,125 | 48,455 |
| Tompkins | 35,285 | 41,490 | 42,340 | 59,122 | 66,164 | 76,879 | 87,085 | 94,097 | 96,501 | 101,564 | 105,740 |
| Ulster | 74,979 | 80,155 | 87,017 | 92,621 | 118,804 | 141,241 | 158,158 | 165,304 | 177,749 | 182,493 | 181,851 |
| Warren | 31,673 | 34,174 | 36,035 | 39,205 | 44,002 | 49,402 | 54,854 | 59,209 | 63,303 | 65,707 | 65,737 |
| Washington | 44,888 | 46,482 | 46,726 | 47,144 | 48,476 | 52,725 | 54,795 | 59,330 | 61,042 | 63,216 | 61,302 |
| Wayne | 48,827 | 49,995 | 52,747 | 57,323 | 67,989 | 79,404 | 84,581 | 89,123 | 93,765 | 93,772 | 91,283 |
| Westchester | 344,436 | 520,947 | 573,558 | 625,816 | 808,891 | 894,104 | 866,599 | 874,866 | 923,459 | 949,113 | 1,004,457 |
| Wyoming | 30,314 | 28,764 | 31,394 | 32,822 | 34,793 | 37,688 | 39,895 | 42,507 | 43,424 | 42,155 | 40,531 |
| Yates | 16,641 | 16,848 | 16,381 | 17,615 | 18,614 | 19,831 | 21,459 | 22,810 | 24,621 | 25,348 | 24,774 |
| Andy Arthur, 3/6/23. Data Source:
IPUMS. 2022. http://doi.org/10.18128/D050.V17.0 |
|||||||||||

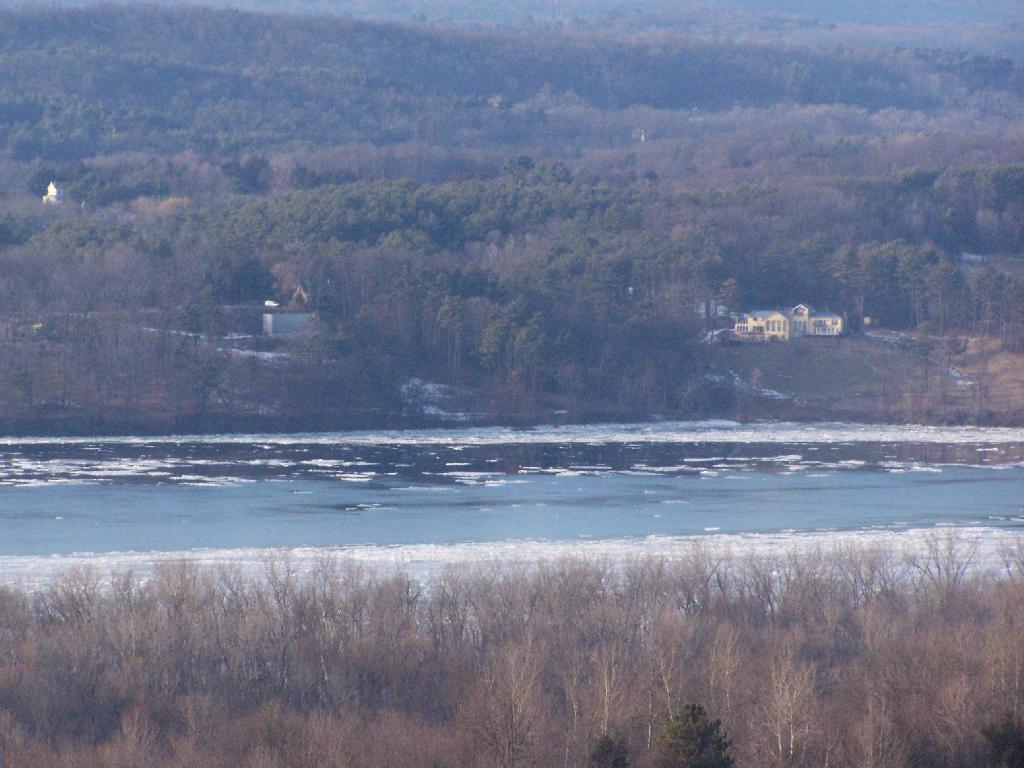
God Rays on the Pond


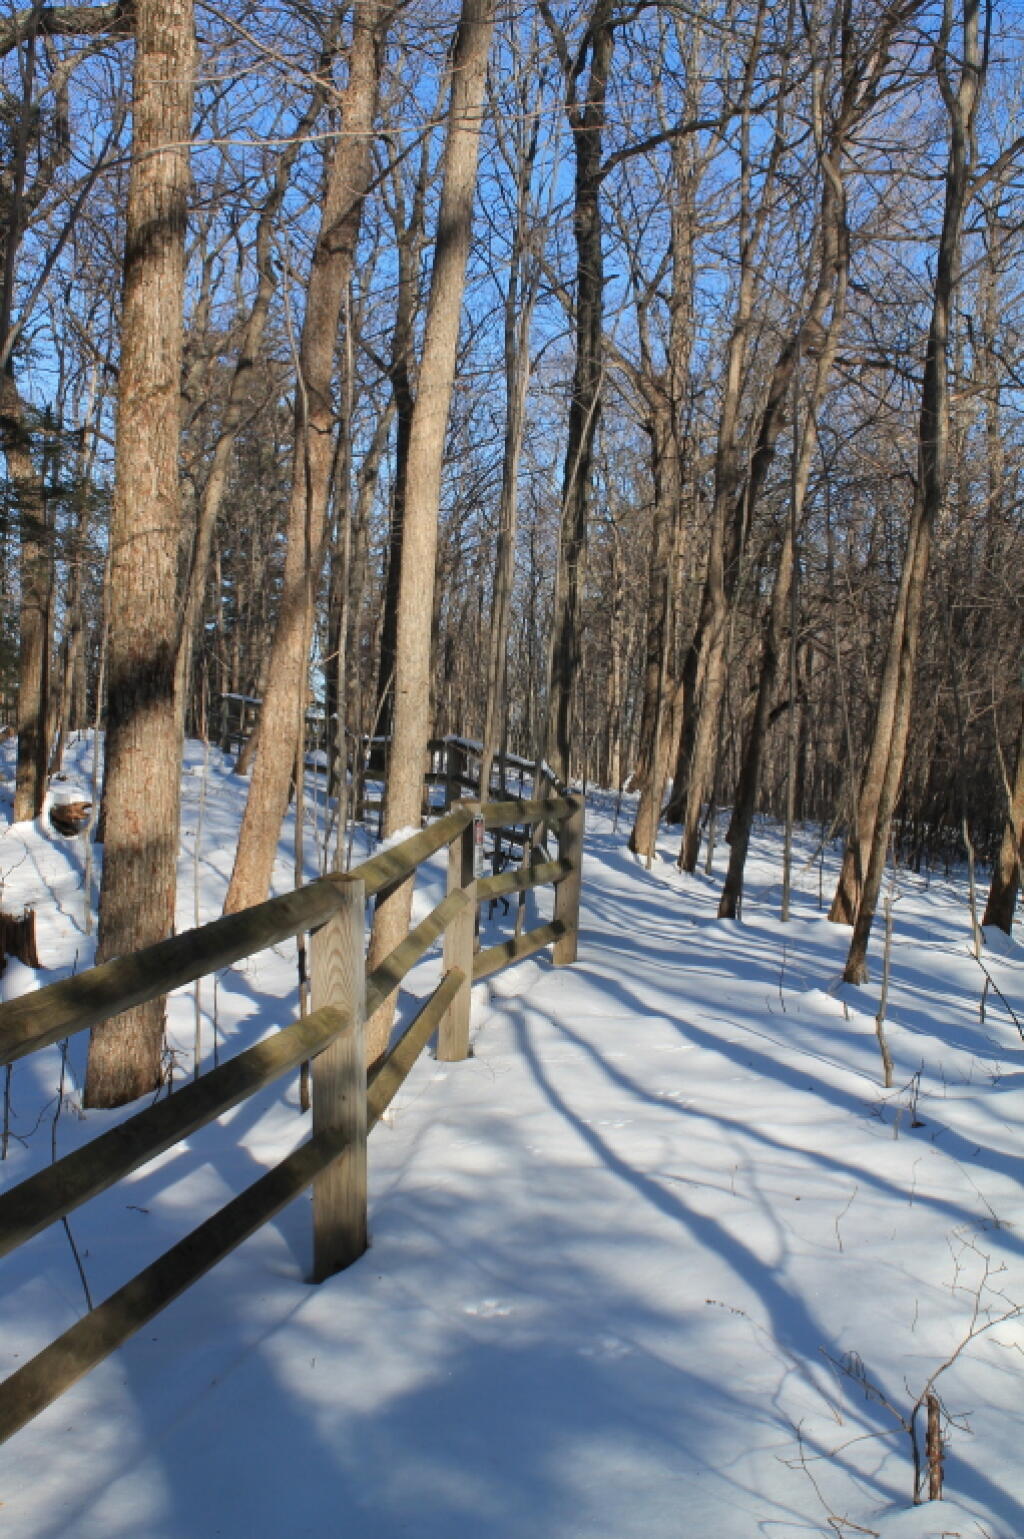
Fence Line


John Prine’s “Illegal Smile” – American Songwriter
He notes: the meaning of the song was “not about smokin’ dope. It was more about how, ever since I was a child, I had this view of the world where I can find myself smiling at stuff nobody else was smiling at. But it was such a good anthem for dope smokers that I didn’t want to stop every time I played it and make a disclaimer.”