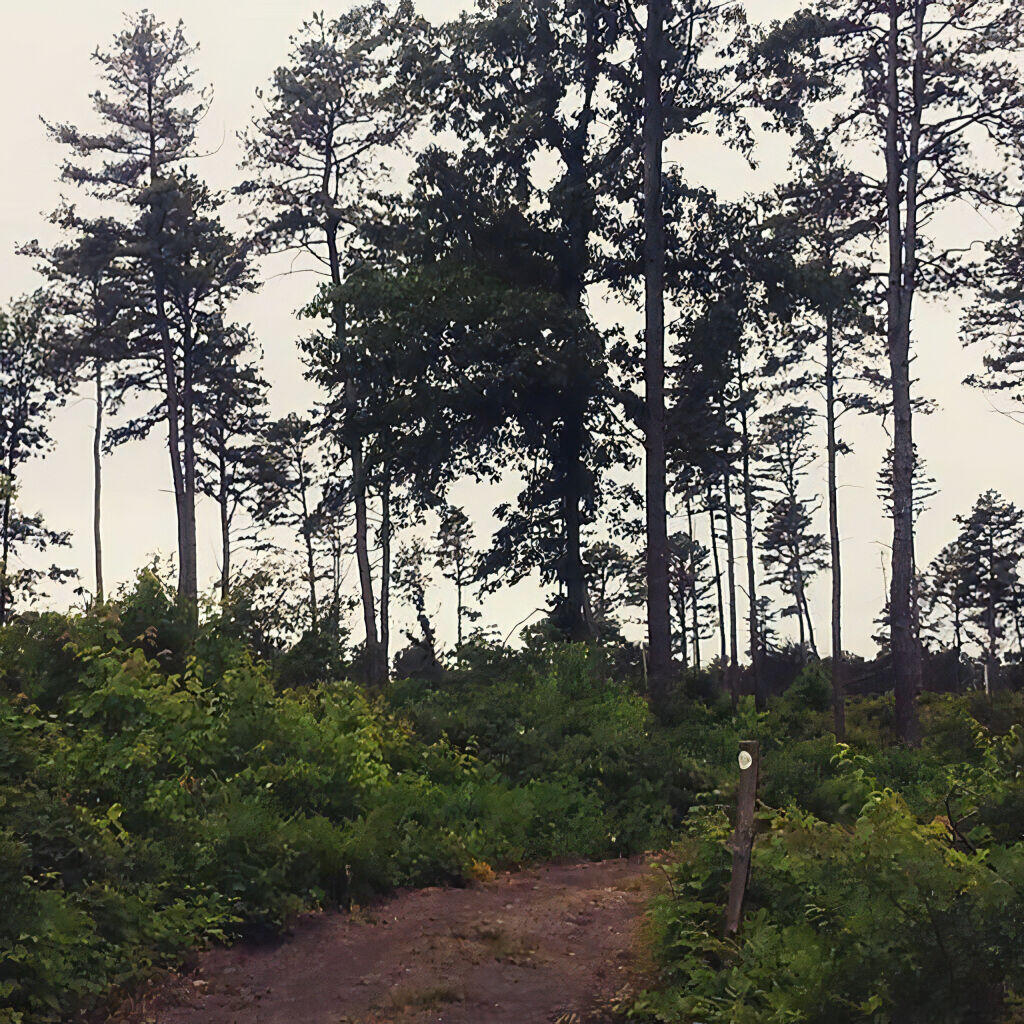
Wildfire smoke again I believe as the AQI meters are all showing a spike in pollution from PM 2.5 and the haze has a brownish hint. Some might be humidity as rain approaches tonight but it also clearly looks like smoke. I’ve noticed smoke hangs over the hills and terrain much different than ordinary moisture haze which is much more consistent.
I am quite interesting in mining both EPA and Purple Air data to see if I can make more detailed real time air quality maps for my blog and social media. It would be neat to use Kriging to make really pretty maps of current air quality, especially if air pollution becomes a real issue Upstate this summer with wildfires going forward. Maybe the heavy rain this wedk will put a damper in the fires but I’m not convinced.
I think the throw away maps feature is now working correctly on the blog – a mistake in the SQL code was accidentally trashing the wrong maps and photos but after a few days experimenting I think it may be fixed. Next is implementing R code for automatically uploading such temporary maps directly to the blog just by executing code. I could develop a full API with authentication to do this but it really is much easier to just use my blogs native uploader controlled through a simple headless browser session using rselenium.


