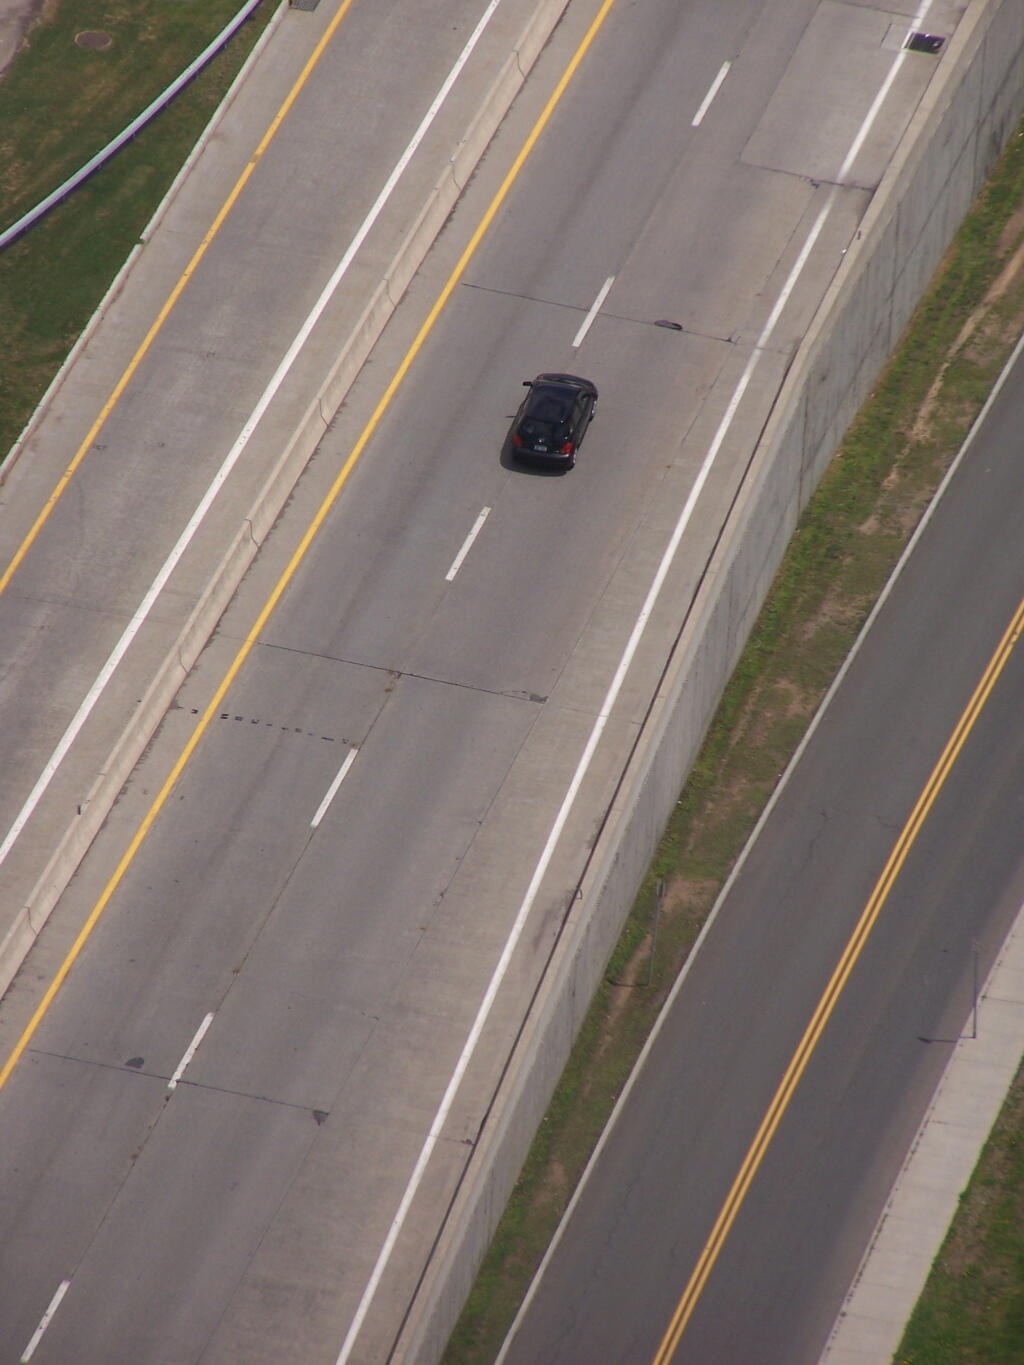
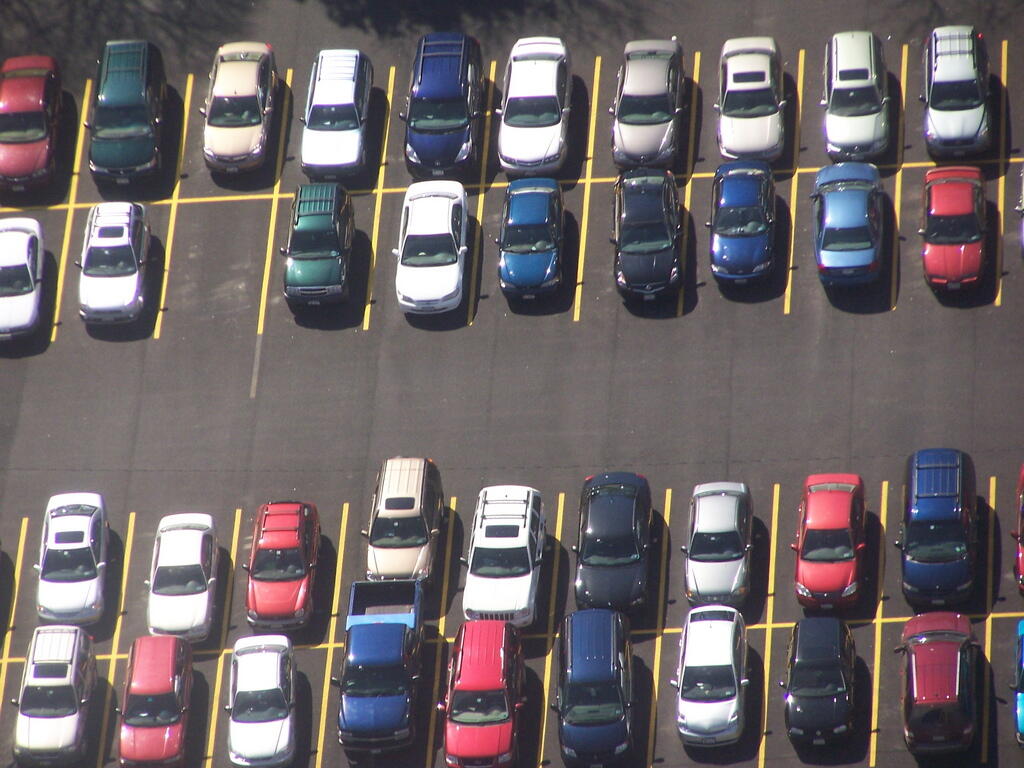
What is the first thing you see? Most likely it’s the highway system and it’s connected parking lots.
Near the superhighways is a dead-zone — not just dead grass from the copious amount of salt laid down, but also an economic dead zone, because nobody wants to live next to the rumble and pollution of an expressway. Cars make a lot of noise, that goes through walls and generally makes humans miserable. Cars spew toxic gases shorten people’s lives. When a driver is distracted or makes a mistake, they become deadly weapons that take life indiscriminately.
Automobiles kill cities. It’s that simple.
But they also kill the countryside too, by demanding cities grow larger and larger, sprawling out into the countryside to accommodate the cars need for parking and high-speed roads to move them from place to place smoothly. Suburbia isn’t about homeownership, is as it’s about having a place to put the automobile, where it can be safely parked off the street.
There are plenty of homes in cities. For generations before the automobile, homeowners-owned row houses in the city. The problem is dense urban areas lack places to park automobiles safely. So people choose to move out to the suburbs, where they can have a garage and a driveway to park their cars. In the suburbs, one only has to drive a short distance to a freeway then to another vast parking lot at the office campus.
Society needs to rethink it’s relationship with automobile.
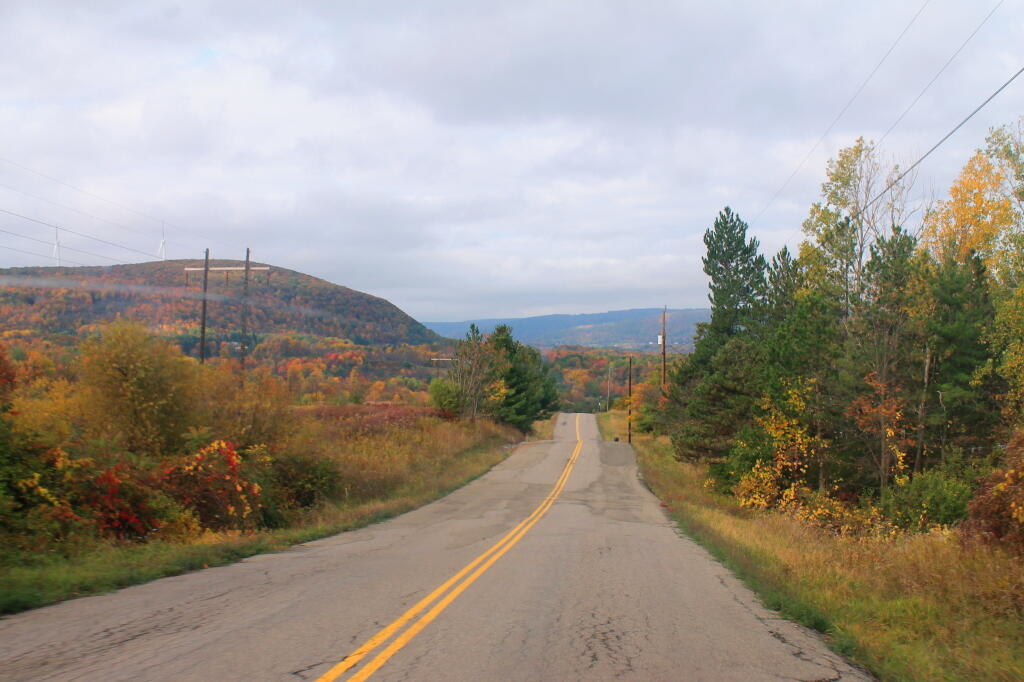
Cars are a lot of fun, used in moderation. Like an occasional drag on a cigarette or a cold beer after work, driving is a pleasurable activity on the open road, in a rural area. But cars don’t belong in cities. Having a lot of horsepower, and dropping the gas pedal can be a lot of fun.
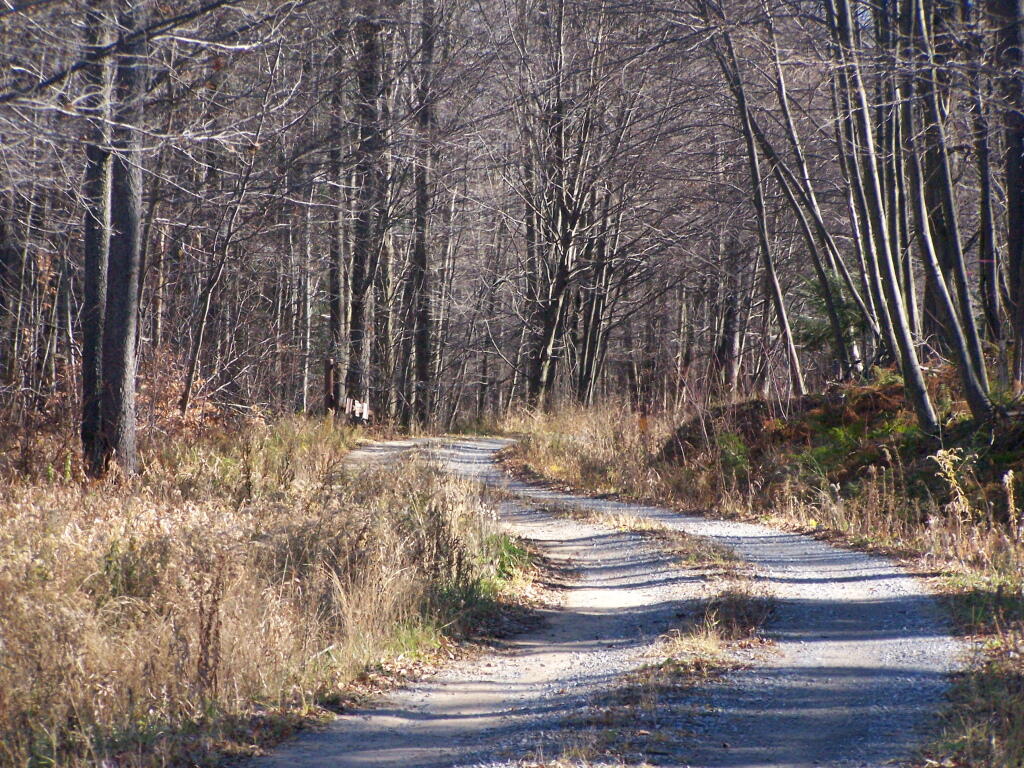
I think in the future, automobiles will be used primarily as something you use on Sunday after church, to go out on a picnic in the country, following lush tree-lined parkways. Parks will be located at nearly every exit of the parkway. People will use cars on vacations to go places too unpopular to be worthwhile to run a transit line. Maybe also driven by farmers and rural residents, at least to a park and ride lot on the outskirts of city, which you would take a transit vehicle the rest of the way.
I have to admit driving in New York is downright boring compared to West Virginia. The roads are so flat, so straight, and so wide.
But then again, New York’s mountains have wide valleys, and it’s rare that a road has to traverse a narrow canyon or do any kind of significant climbing. Few major highways climb over mountains in New York.
County Route 47 in Catskills near Winnisook Lake at 2,680 elevation is the highest elevation all season highway in New York. There aren’t a lot of high elevation roads in New York for sure. The highest Interstate in New York is Southern Tier Expressway in Almond at 2,110 elevation
This shows the percentage of automobiles registered by the ten most popular makes of automobile in New York State. Chevrolet is by far the most popular in the state, although foreigns are more popular downstate.
Make
CHEVR
FORD
TOYOT
HONDA
JEEP
NISSA
SUBAR
DODGE
GMC
HYUND
County
ALBANY
11.3
11.1
10.1
12.7
4.3
5.6
5.3
2.7
2.0
3.1
ALLEGANY
20.4
17.8
5.5
3.4
5.5
3.4
3.0
7.6
5.4
1.4
BRONX
5.0
7.1
17.0
17.9
4.3
8.4
2.3
2.4
1.2
3.9
BROOME
14.1
10.7
15.1
8.7
3.8
5.8
4.3
3.6
3.1
4.6
CATTARAUGUS
20.4
16.5
6.4
3.6
6.3
3.0
3.3
6.1
5.5
1.7
CAYUGA
21.6
13.1
7.6
6.9
5.4
4.9
4.6
4.3
3.7
1.9
CHAUTAUQUA
17.8
17.0
7.6
6.0
5.9
3.6
4.9
5.6
3.4
2.6
CHEMUNG
15.3
13.1
8.9
6.8
4.6
9.5
4.0
5.1
4.2
3.8
CHENANGO
18.2
16.7
7.6
5.3
5.3
4.0
6.2
5.3
4.5
2.6
CLINTON
13.7
14.9
9.1
8.3
4.6
4.2
5.1
3.8
4.6
4.7
COLUMBIA
12.1
12.3
14.0
7.9
4.4
3.7
8.0
3.3
3.7
2.2
CORTLAND
19.3
13.8
6.5
5.5
5.2
6.5
6.5
4.9
3.3
2.7
DELAWARE
15.9
13.0
8.5
6.8
5.4
4.4
7.0
5.2
4.6
2.6
DUTCHESS
9.4
9.4
10.2
13.9
4.8
5.4
7.7
2.8
2.3
4.0
ERIE
17.4
14.5
9.1
6.4
6.1
4.2
4.1
3.3
3.1
3.1
ESSEX
15.5
15.9
9.3
6.5
5.8
3.0
6.2
4.0
4.3
2.2
FRANKLIN
17.2
16.5
7.5
5.3
5.0
2.6
4.8
5.1
5.8
2.6
FULTON
18.1
14.3
8.5
6.4
5.9
6.5
3.0
5.1
2.8
2.1
GENESEE
24.5
13.5
8.9
4.2
5.3
2.7
2.6
4.9
4.4
1.7
GREENE
14.0
13.6
7.4
7.1
4.9
3.9
8.8
3.7
4.8
2.7
HAMILTON
15.6
13.7
10.9
6.4
5.4
3.2
5.3
3.7
4.5
1.9
HERKIMER
16.9
15.0
7.6
7.0
5.4
4.0
4.5
4.4
3.8
2.7
JEFFERSON
14.2
16.5
8.4
7.2
5.8
3.6
3.9
5.1
3.2
2.5
KINGS
4.1
6.5
16.3
14.2
3.6
9.1
3.0
1.8
1.1
3.6
LEWIS
16.4
20.9
5.8
8.6
5.1
2.2
2.9
4.8
4.9
1.5
LIVINGSTON
21.0
15.7
7.2
6.2
5.6
3.1
3.7
5.5
3.7
2.0
MADISON
17.9
13.6
9.3
5.3
5.7
3.1
5.3
4.6
3.9
2.2
MONROE
16.6
10.2
10.5
10.3
4.3
5.7
4.7
2.8
3.1
3.2
MONTGOMERY
17.4
14.4
6.9
8.9
5.9
5.6
3.2
4.8
3.1
2.5
NASSAU
6.2
7.6
11.4
12.3
6.3
7.7
3.3
2.1
1.8
4.2
NEW YORK
3.9
7.4
11.9
11.3
4.3
4.6
4.1
1.6
1.0
2.3
NIAGARA
23.7
13.7
7.0
5.2
5.8
3.4
2.2
4.0
4.3
2.4
ONEIDA
13.5
13.3
10.1
8.4
5.2
4.7
4.8
3.6
3.8
2.9
ONONDAGA
14.9
10.1
10.3
8.0
5.9
4.8
6.0
3.6
2.5
3.2
ONTARIO
16.2
14.1
9.7
7.7
4.7
4.0
5.5
3.4
3.7
3.2
ORANGE
8.5
10.8
12.1
12.3
5.3
6.2
5.2
3.2
2.0
4.7
ORLEANS
27.5
15.5
5.3
4.6
4.7
2.4
2.4
5.3
5.2
1.7
OSWEGO
21.4
13.9
5.8
4.3
6.5
4.3
3.6
5.2
3.2
2.0
OTSEGO
13.9
14.6
9.6
8.9
4.9
5.2
7.2
4.9
3.7
2.5
OUT-OF-STATE
15.7
17.8
8.7
2.0
3.8
10.2
2.3
3.1
2.1
4.0
PUTNAM
8.4
8.6
10.1
13.9
5.9
4.2
9.3
2.5
2.5
3.9
QUEENS
4.8
7.3
16.6
15.0
4.1
9.8
2.7
1.9
1.2
3.7
RENSSELAER
12.9
12.5
9.2
12.0
4.9
5.1
6.0
3.0
2.9
2.9
RICHMOND
5.5
8.1
11.5
12.0
5.7
9.5
2.6
2.2
1.8
5.8
ROCKLAND
5.0
8.8
16.3
15.9
4.5
6.3
5.5
1.7
1.3
4.2
SARATOGA
10.2
11.0
11.1
13.8
5.0
4.9
5.4
2.6
2.8
3.0
SCHENECTADY
10.5
10.4
9.7
14.8
4.6
6.2
4.8
2.9
2.7
3.5
SCHOHARIE
16.8
13.8
7.1
8.1
5.6
3.8
5.7
4.8
4.2
2.4
SCHUYLER
14.8
15.8
8.1
5.5
5.6
5.6
6.0
6.3
3.6
2.3
SENECA
18.4
17.9
7.4
5.4
4.9
5.2
3.3
5.2
3.1
2.8
ST LAWRENCE
20.5
15.4
8.1
4.8
5.6
2.2
3.9
5.9
4.6
1.5
STEUBEN
17.0
15.4
6.7
4.7
6.1
5.5
4.2
6.6
4.3
2.5
SUFFOLK
8.9
10.3
10.8
11.2
6.9
7.0
3.2
2.9
2.0
4.7
SULLIVAN
11.7
12.6
9.9
7.8
5.9
5.0
5.2
4.6
3.0
4.1
TIOGA
15.3
14.3
10.7
7.6
4.6
5.8
4.8
5.2
4.2
3.1
TOMPKINS
11.5
9.8
14.0
12.1
3.7
5.2
9.1
3.2
2.1
2.8
ULSTER
8.9
10.0
11.1
10.4
5.3
6.2
7.9
3.8
3.1
3.8
WARREN
12.5
12.4
9.8
10.9
5.4
4.0
6.2
3.2
3.2
4.7
WASHINGTON
15.3
14.9
8.3
8.8
5.3
4.0
5.3
4.6
3.6
3.7
WAYNE
21.2
15.1
6.6
6.2
5.0
4.1
3.8
4.5
4.1
2.3
WESTCHESTER
6.0
7.2
11.1
14.7
5.7
5.0
6.5
1.6
1.6
2.9
WYOMING
22.8
17.4
6.2
3.5
6.3
2.4
2.9
5.4
4.1
1.5
YATES
19.3
16.3
7.7
5.1
5.3
3.4
4.7
5.3
4.7
2.3
import pandas as pd
import seaborn as sns

url='/media/hd2/auto/autoreg.csv.zip'
df=pd.read_csv(url)

sf=df[((df['Record Type']=='VEH'))].groupby(['County','Make']).count()['VIN'].unstack().T
sf=(sf/sf.sum()*100).fillna(0).T
tb=sf[ sf.sum().sort_values(ascending=False).index[:10]]
tb

cm =sns.color_palette("Spectral_r", as_cmap=True)
html=tb.style.background_gradient(cmap=cm,axis=1).render()

with open('/tmp/auto.html', 'w') as f:
    f.write(html)