Interactive Google Map consisting of federal, state, local, and non-governmental public lands and parks within the following counties in DEC Region 3 South: Dutchess, Orange, Sullivan and Ulster counties. Up to 6 additional counties (for a total of ten) can be added to the map. Data can be downloaded as KML and GPX Tracks and Waypoints for use in Google Earth or handheld GPS units.
Geographic Information Services (GIS) – Maps – Cartography
I am an amateur cartographer who designs maps and does a wide variety geospatial analysis using free and open-source geographic information software (GIS) and public sources of data to design quality maps, graphs, charts and datasets. I am looking for new and interesting projects to improve my skills, make connections and expand my portfolio.
Are you looking for my personal blog with it’s hiking, camping and outdoor recreation maps, along with a variety of charts, photos, and stories? Please visit andyarthur.org.
Mapping Avaliable
Tax/Property Mapping
High Resolution Aerial Photography
Recreational Maps – Hunting, Camping, Hiking
Georeference addresses using State Address Mapping service, plot them on a map
Wetlands, Topographic Contours, Land Cover
Compare historical aerial photos or maps to current photography
Web mapping using leaflet (HTML/Javascript file to embed on a website or use at home)
For most projects, there is no fee. I am looking for experience, references, mentors and connections in the geospatial community.
If you have a large project, let’s talk about it. I might be willing to do it for free, if it’s something really interesting or important like fighting suburban sprawl and pollution. I don’t a business or taxes set up, so I can’t really charge at this point.
How to get started?
Please send me an email describing the mapping or data project in as much detail as possible.
US Census – 2019 American Community Survey, 2020 US Census
NYS Tax and Assessment Rolls (2020)
NYSDOT Traffic Counts and Road Data
Historical Aerial Photography (primarily 1952, but earlier and later exist)
ArcGIS REST/Services and WMS Services from state and local agencies
LiDAR Elevation Profiles
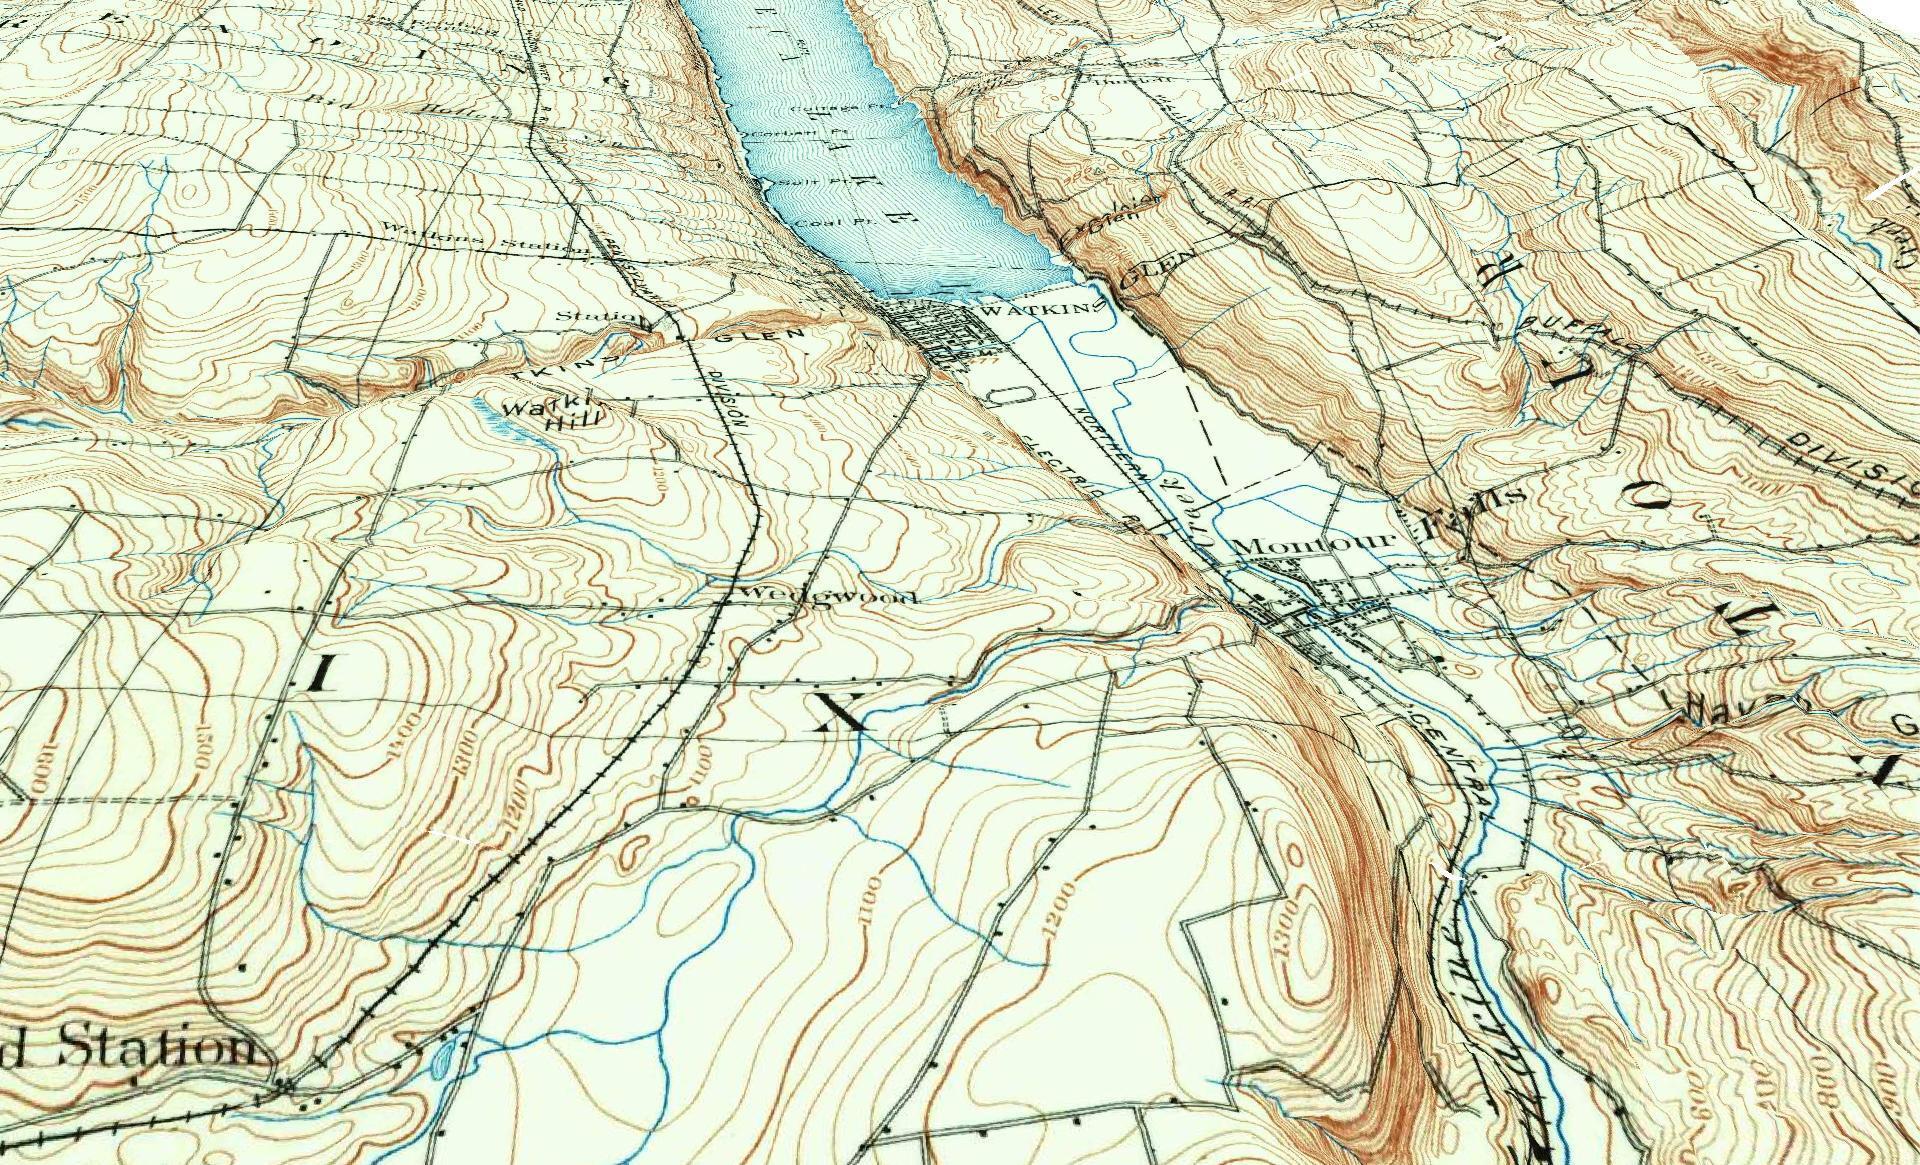
USGS Topographic Maps, historic and modern – with overlays if requested
Data Repositories like CUGIR, DataNY.gov and NYSGIS
Recreation data from NYSDEC
Software Used
Quantum GIS (QGIS) including 3D Mapping
Geodata Abstraction Library (GDAL, ogr2ogr)
Python, including the data-science libraries PANDAS and GeoPANDAS
LeafletJS Web Mapping Services
Geographies Avaliable
Primary Capital Region and also much of New York State, also some for Pennsylvania, Vermont, West Virginia
State, county, municipal, school districts – Most data sets
Parks, highways, buffer (distance to) – Most data sets
Election districts – Roughly 75% of NYS counties
Census Tract or Blockgroup – 2019 American Community Survey
Tabulation Block – 2020 US Census
Are printed maps avaliable at this time?
Not currently. I can send you a file based on your specifications to print at your local print shop.
How long do mapping projects take?
Depends on complexity of the project. Many projects only take minutes, however if a project requires georeferencing, data cleaning, or custom shapes or layouts, it might take significantly longer. More revisions lead to better quality output.
Do you make maps professionally?
No! This is just a hobby. But I’m interested in expanding my skills. I do a lot of mapping for my blog and in support of community organizations like Save the Pine Bush.
Are my maps of good quality?
Thats for you to decide. I don’t have formal education in map making, and I don’t have professional tools. But do take a look at the work I’ve done below.
Examples of Maps
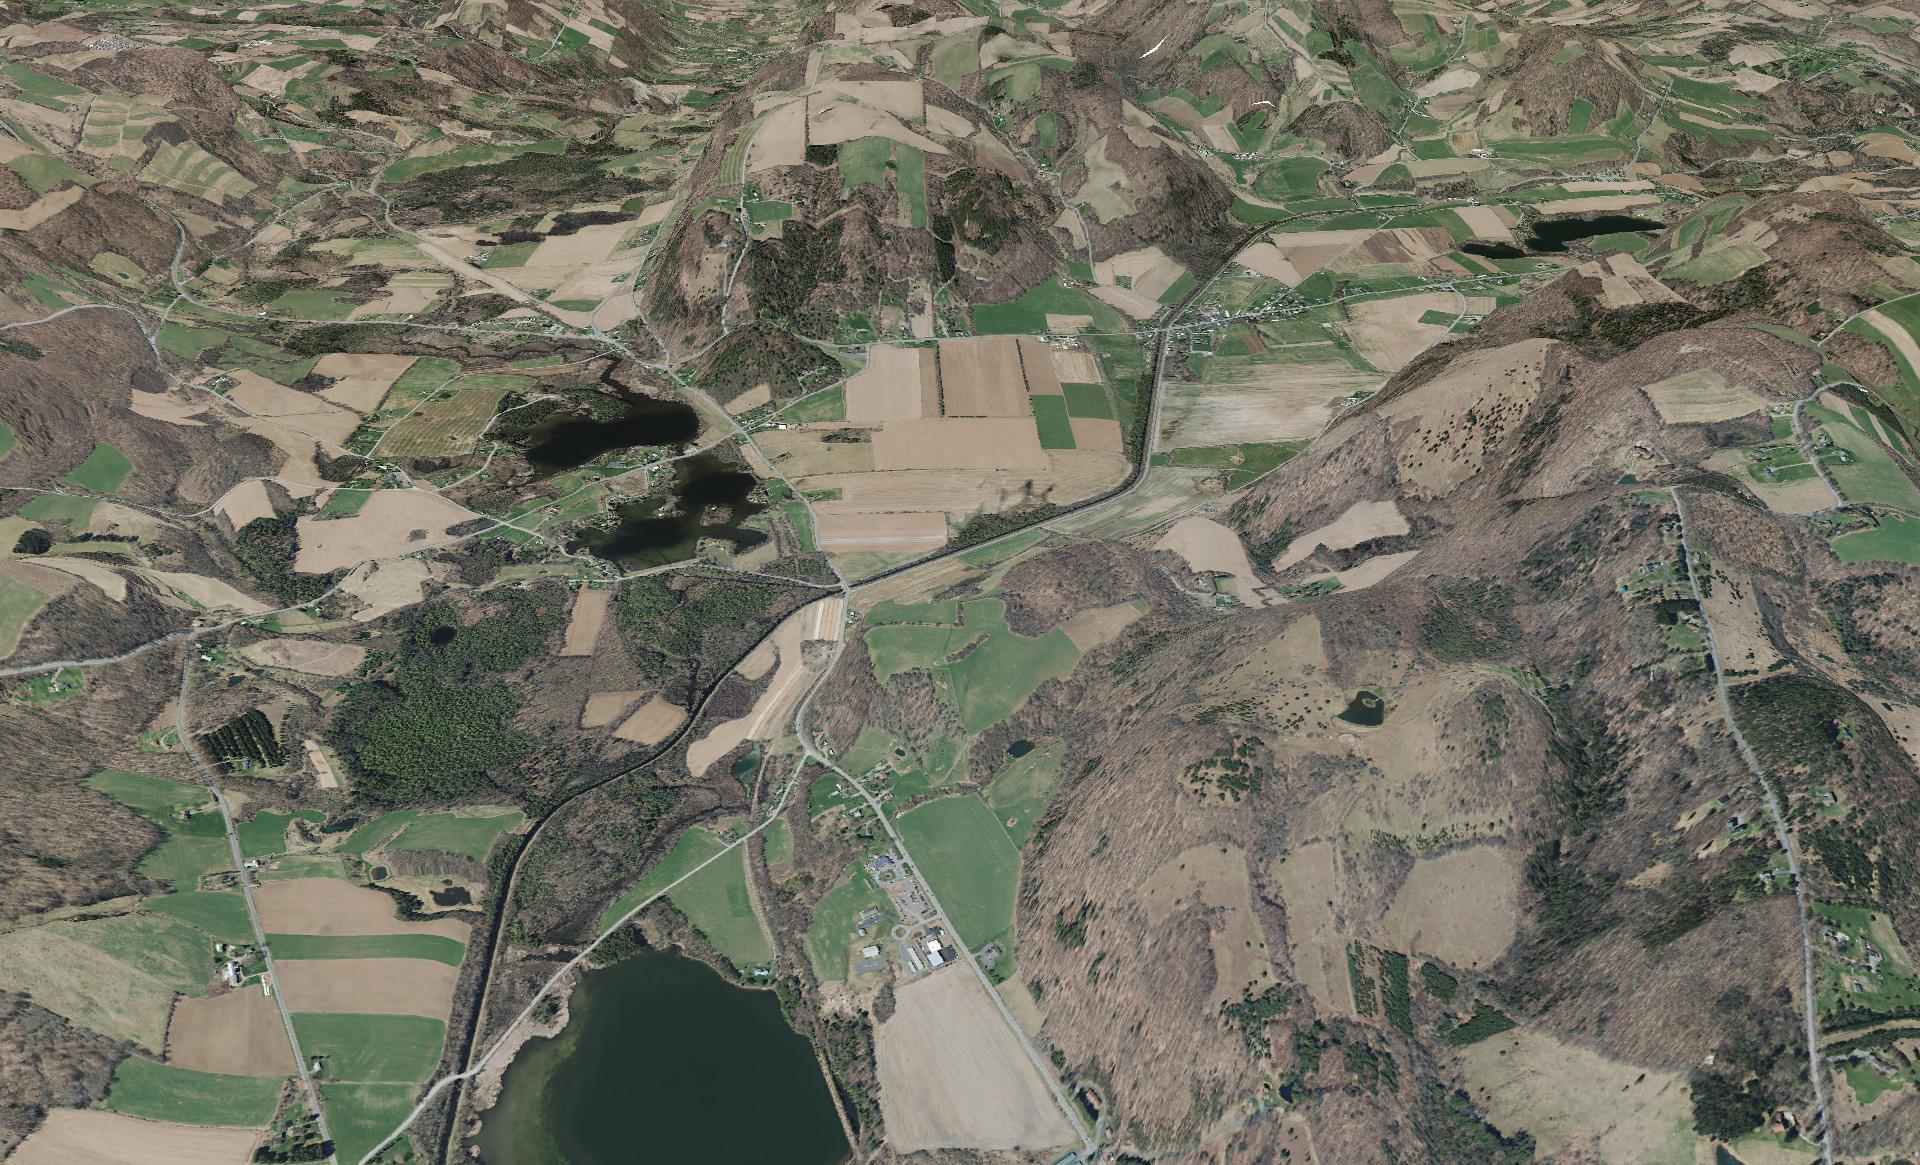
This shows a 3D rendering of the Buckville Canal north of Hamilton
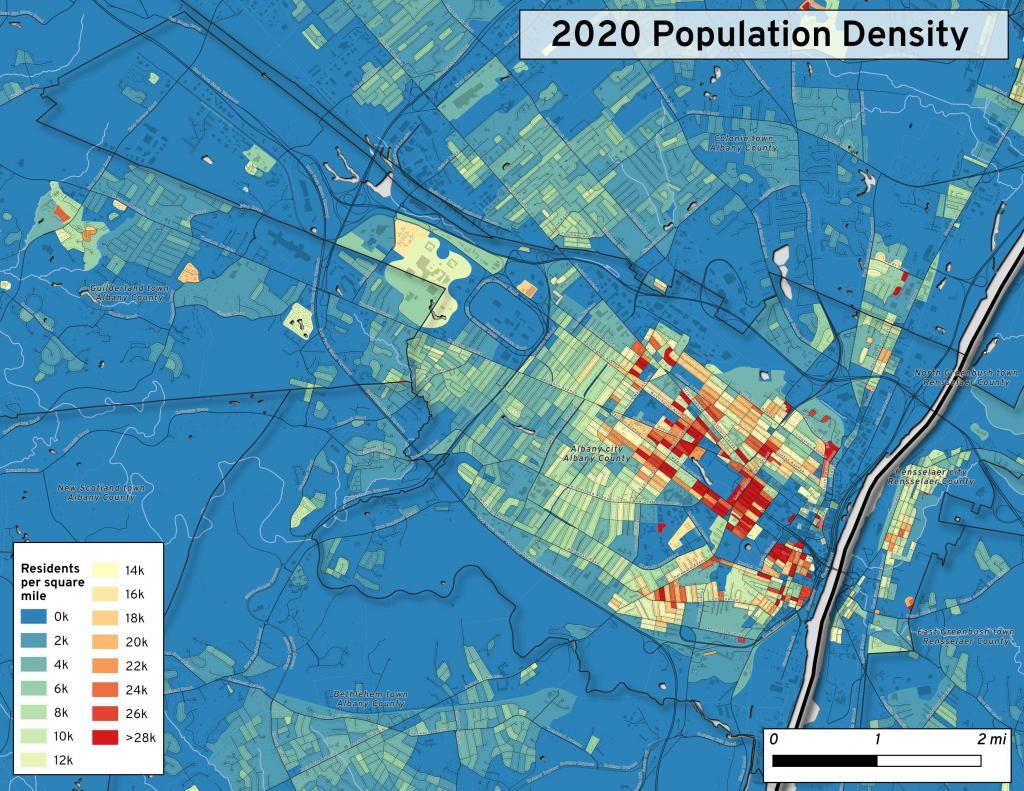
This map shows the use of 2020 PL 94-171 data to calculate population density in City of Albany.
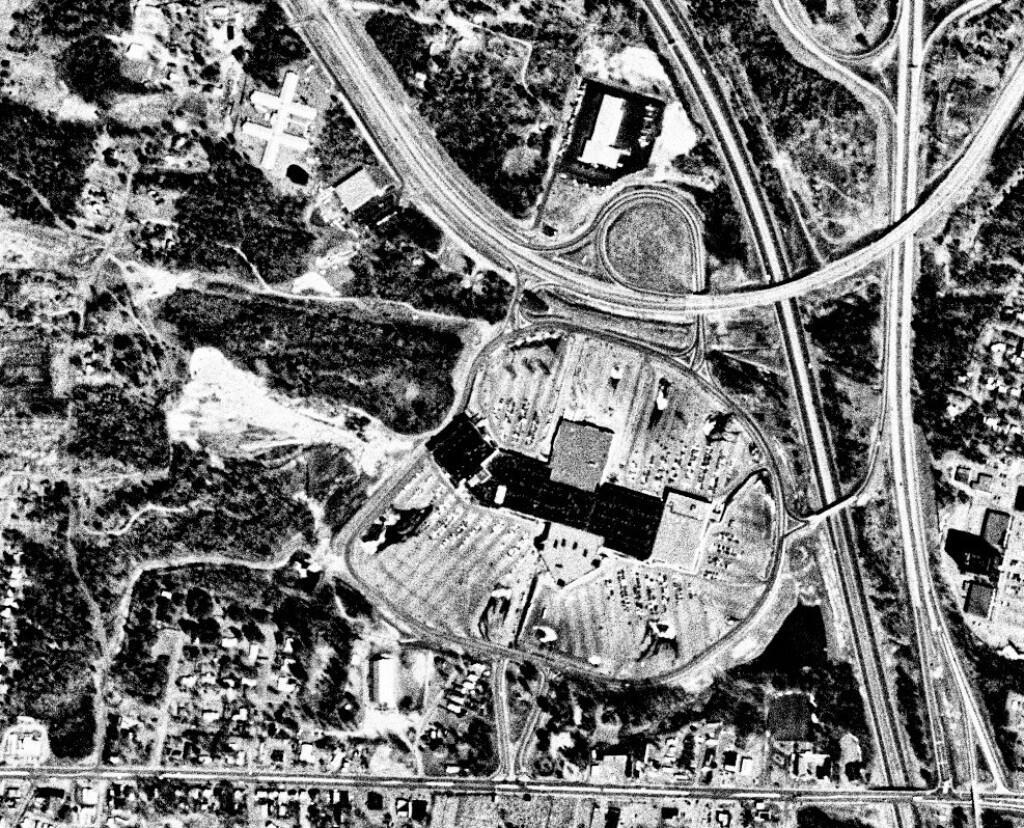
This 1985 aerial photo shows Crossgates Mall prior to it’s expansion.
This GIF image shows the change in unemployment during Coronavirus panademic.
This image shows hiking trails near Brooktrout, Falls Pond and Deep Lake.
Peebles Island, a Comparison 1952
3D Interactive of campsites at Moose River Plains.
import pandas as pd
import geopandas as gpd
# path to overlay shapefile
overlayshp = r'/tmp/dis_to_albany.gpkg'
# summary level -- 750 is tabulation block, 150 is blockgroup
# large areas over about 50 miles much faster to use bg
summaryLevel = 150
#summaryLevel = 750
# path to block or blockgroup file
if summaryLevel == 150:
blockshp = r'/home/andy/Documents/GIS.Data/census.tiger/36_New_York/tl_2020_36_bg20.shp.gpkg'
else:
blockshp = r'/home/andy/Documents/GIS.Data/census.tiger/36_New_York/tl_2020_36_tabblock20.shp.gpkg'
# path to PL 94-171 redistricting geoheader file
pl94171File = '/home/andy/Desktop/nygeo2020.pl'
# field to categorize on (such as Ward -- required!)
catField = 'Name'
# geo header contains 2020 census population in column 90
# per PL 94-171 documentation, low memory chunking disabled
# as it causes issues with the geoid column being mixed types
df=pd.read_csv(pl94171File,delimiter='|',header=None, low_memory=False )
# column 2 is summary level
population=df[(df.iloc[:,2] == summaryLevel)][[9,90]]
# load overlay
overlay = gpd.read_file(overlayshp).to_crs(epsg='3857')
# shapefile of nys 2020 blocks, IMPORTANT (!) mask by output file for speed
blocks = gpd.read_file(blockshp,mask=overlay).to_crs(epsg='3857')
# geoid for linking to shapefile is column 9
joinedBlocks=blocks.set_index('GEOID20').join(population.set_index(9))
# store the size of unbroken blocks
# in case overlay lines break blocks into two
joinedBlocks['area']=joinedBlocks.area
# run union
unionBlocks=gpd.overlay(overlay, joinedBlocks, how='union')
# drop blocks outside of overlay
unionBlocks=unionBlocks.dropna(subset=[catField])
# create population projection when a block crosses
# an overlay line -- avoid double counting -- this isn't perfect
# as we loose a 0.15 percent due to floating point errors
unionBlocks['sublock']=unionBlocks[90]*(unionBlocks.area/unionBlocks['area'])
# sum blocks in category
unionBlocks=pd.DataFrame(unionBlocks.groupby(catField).sum()['sublock'])
# rename columns
unionBlocks=unionBlocks.rename({'sublock': '2020 Census Population'},axis=1)
# calculate cumulative sum as you go out each ring
unionBlocks['millions']=unionBlocks.cumsum(axis=0)['2020 Census Population']/1000000
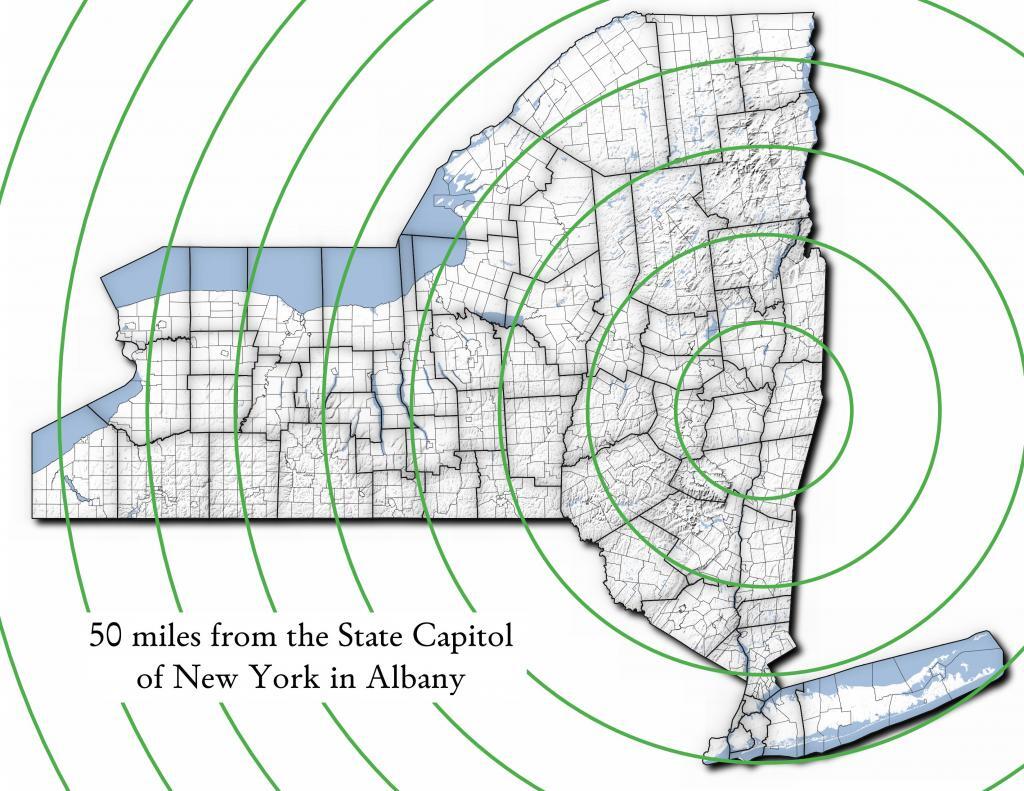
# each ring is 50 miles
unionBlocks['miles']=unionBlocks.index*50
# output
unionBlocks
Land use in town of Berne (from 2016 National Land Cover Dataset)
Most highly assessed properties in Albany County …
In New York State, you have to register in a political party to be eligible to vote in primaries. You can’t vote in a Democratic primary, for example, if you are not a registered Democrat. The same is true with Republicans and all minor parties.
That said, in most parts of New York State, 15-25% of all voters choose to not register in a party. They may choose not to enroll in a party, as they don’t want to publicly identify with one side or another, or they do not feel comfortable with either party’s platform.
So where do the the voters who choose not to register in a party, aka blanks live? To answer that question, we take a look at Google Maps, using LATFOR voter registration data. Due to the limitations of Google Maps, we only included data at the municipal level, but it gives you a definate feel for enrollment patterns in different parts of state.
Next week we will take a look at actual “swing” voters on a state-wide basis at the MCD level. Swing voters are different from “blank” voters, as they are voters who choose to vote cross-lines, such a voting for a Democrat for President, then choosing to vote for a Republican for State Senate, and a Democrat for State Assembly. “Blank” voters might be enrolled in a party, but they may always consistently vote for Democrats and Republicans.
Reviewing these maps, you will note that the Hudson Valley and Suffolk County have the highest percentage of blank voters in the electorate. Suburban areas also tend to have greater number of blank voters, compared to urban centers and rural areas.
So how has the number of blank voters changed in the state from 2006 through 2010? It varies widely based on region of state, but in general partisan enrollment is up in the state, except in some rural portions of the state that used to be more heavily Republican.
2006-2010 Municipalities with Decreases in Blank Enrollment.
Here is an overview map of active (“producing”) gas wells in Chautuauqua County. I would have made a map up of the whole state, however Google Maps is currently limited in the number of points it can have plotted, so I did a join against the county lines of Chautuauqua County, by far the largest oil and gas producer in NY State.
Google Maps, zoomed into the Town of Ellery, showing producing gas wells, allows one to see how they are all over. Play around, zoom into individual well pads to see what a working one looks like up close.
Here is an overview of all producing natural gas wells in the state, with each tiny dot on this state-wide map representing a producing gas well. There are over 6,600 dots plotted on this map.
The Winona Recreation Area, aka the Winona and Jefferson State Forests has a series of informal campsites throughout it’s miles and truck trails, that are also used by ATVs and snowmobiles based on the time of the year. Known for the large amount of snow the area gets, it’s one of the most vast state parcels in the Tug Hill Plateau.
In the past I’ve camped on an undesignated site with a firepit on Bargby Road. There are other sites around, but I don’t know the area that well, and the sites ar not listed online. You might consider contacting the local Forest Ranger about getting a permit and some other ideas.
Be careful driving around here, as many of the truck trails are very rough and muddy, and you will be sharing them with ATVs in the summer season. They are real fun if you want to get some mud on your pickup truck. It’s by far one of the best places to find rough and muddy state truck trails in NY State, and tons of snow in the winter. I camped there in April 2004 (no snow), but it was cold. — Andy
“Over the past years, many different groups have enjoyed the use of these trails, but this has made for some difficulty in how to designate which trails would be used and for what purpose. The Western Edge Recreational Association was developed around 1995 to bring together all the users: skiers, snowmobilers, dog sledders, horse owners, hunters, bikers, and orienteering people.”
“With the melding of ideas, resources and manpower, Winona State Forest has become one of New York State’s best venues for recreation, and at the same time, provides valuable timber resources.”
“In 2005, DEC began developing a unit management plan (UMP) for Winona State Forest. A UMP must be completed before significant new recreational facilities, such as trails, camping sites, and parking areas can be constructed. The plans involve an extensive analysis of the natural features of an area and the ability of the land to accommodate public use. The DEC has primary responsibility for developing management plans for the State-owned lands. Draft plans are widely distributed for public comment and review prior to being finalized by DEC.”
“The Winona Forest Recreation Association (WFRA) maintains approximately 70 miles of trails in the Winona Forest and Jefferson County Forest Preserve. Both are located in the Tug Hill region of New York State. WFRA, which began as the Tug Hill Ski Club, has reorganized as the Winona Forest Recreation Association in order to include all user groups of the forest. WFRA membership consists of skiers, snowmobilers, atv riders, equestrians, mushers,snowshoers, bikers, hikers and many other outdoor sports enthusiasts. We’re not just an ordinary club!
“Winona Forest is one of the snowiest places east of the Rockies with an average snow fall of 250 inches per year! In winter, the prevailing westerly winds move cold winter air over the warm water of Lake Ontario producing massive lake effect snow falls on the Winona Forest in the Tug Hill area.”
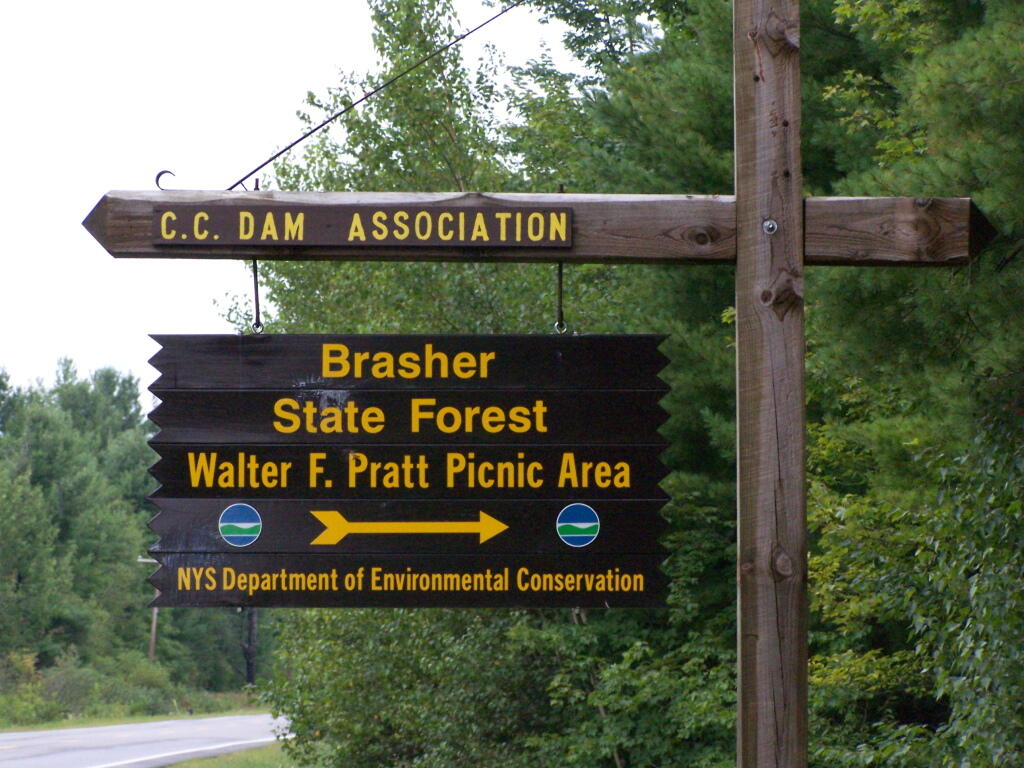
About 5 miles north of North Lawerence, on Saint Lawerence County Route 55 there is a sign for the Brasher State Forest and Walter Pratt Picnic (and Primitive Camping) Area, maintained CC Dam Association.
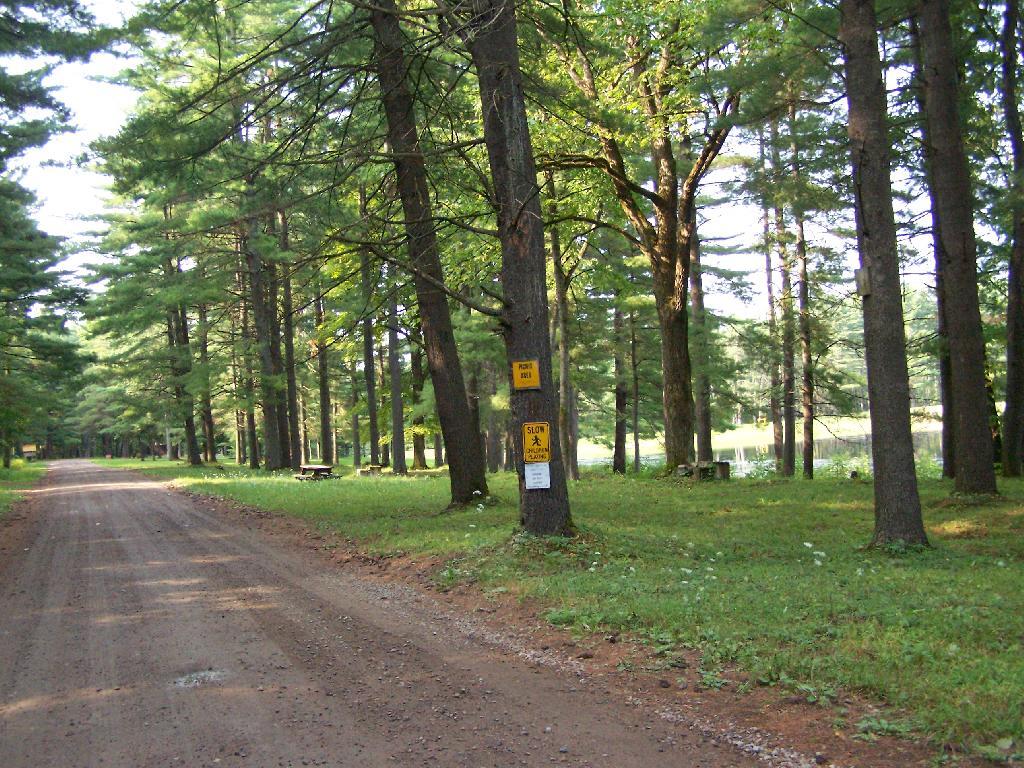
As you enter the camping area, there is a sign for the picnic area along the lake, and camping on the other side of the road. Originally they allowed camping on both sides of the road, but concerns about run-off and other pollution from campers relocated the sites to the other side of the road.
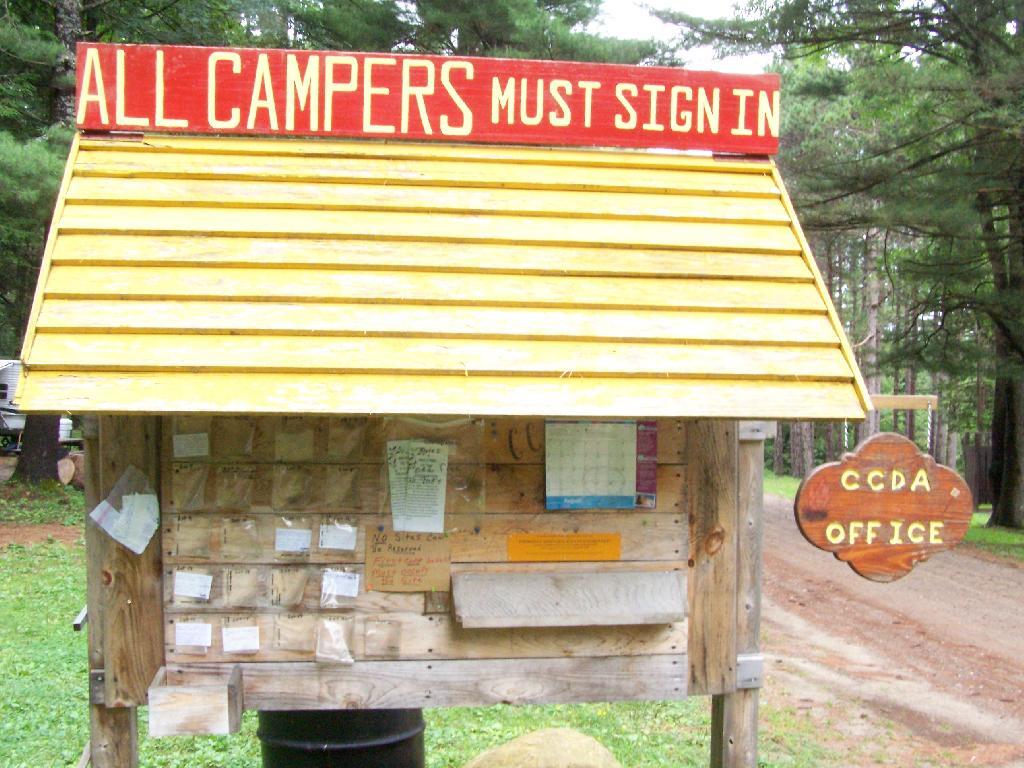
If you want to camp, all you have to do is sign-in on a card, and stick it in the retrospective window. This so they can contact you during an emergency. You can stay for up to 3 nigths, or longer if you get up to a 2-week renewable permit from the DEC.
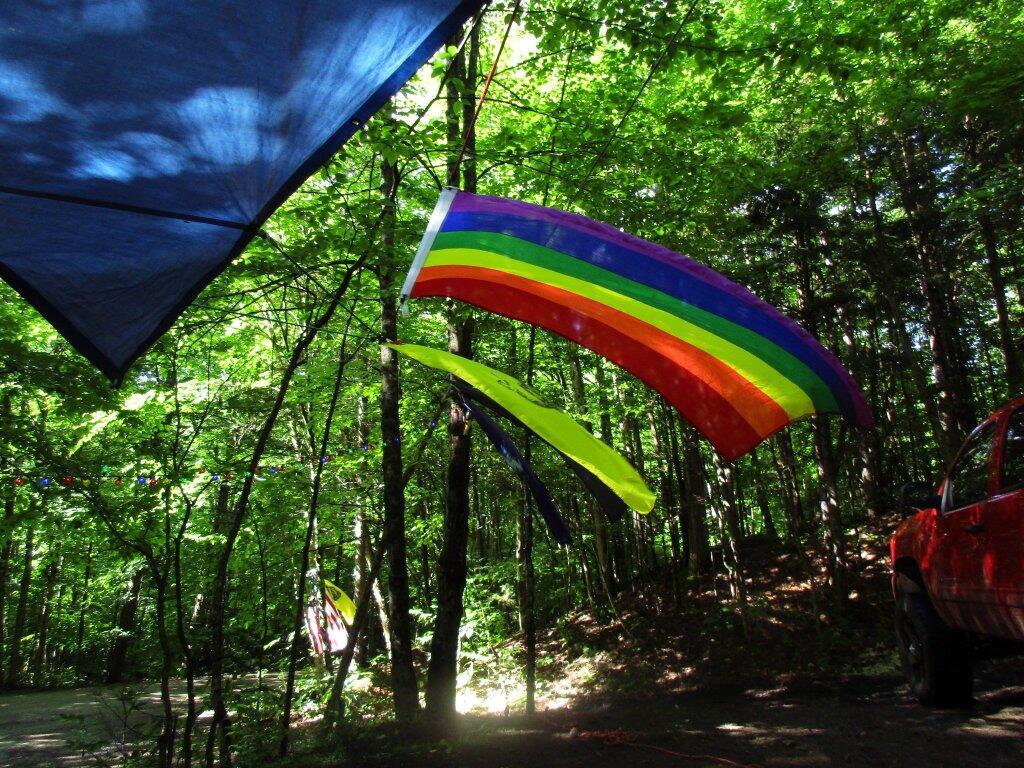
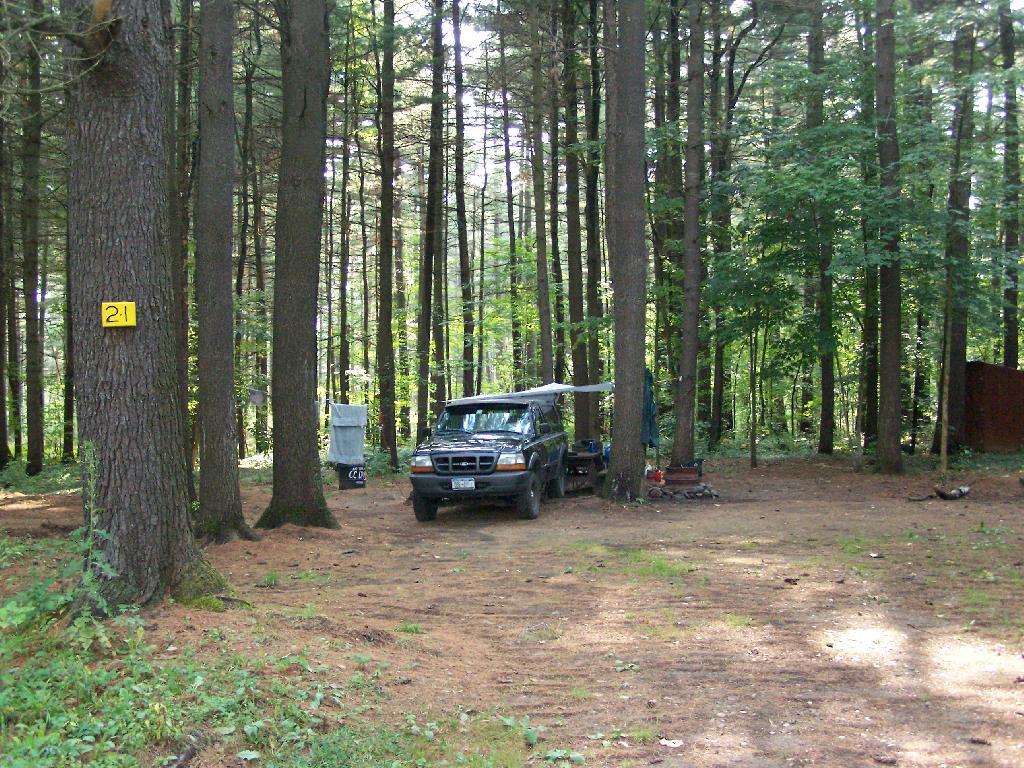
The campsites are quite nice. Not all of them are as separated as this one, but I wanted one that was a little farther away for some peace and quiet. Also I figured I could listen to music as loud as I wanted to here.
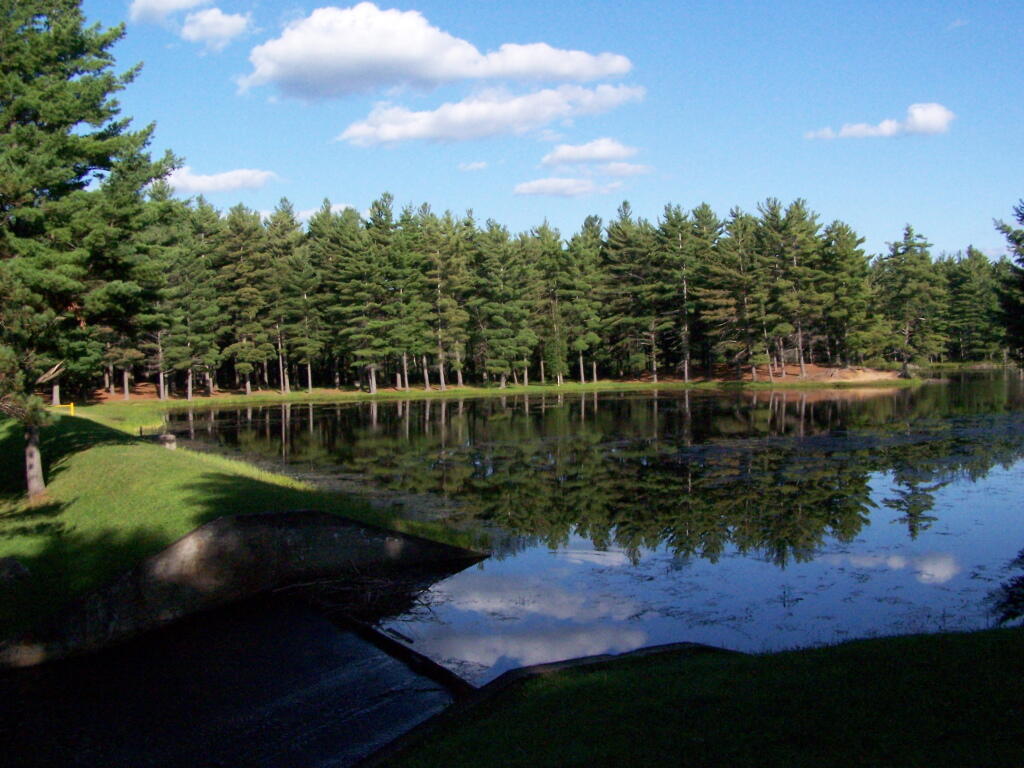
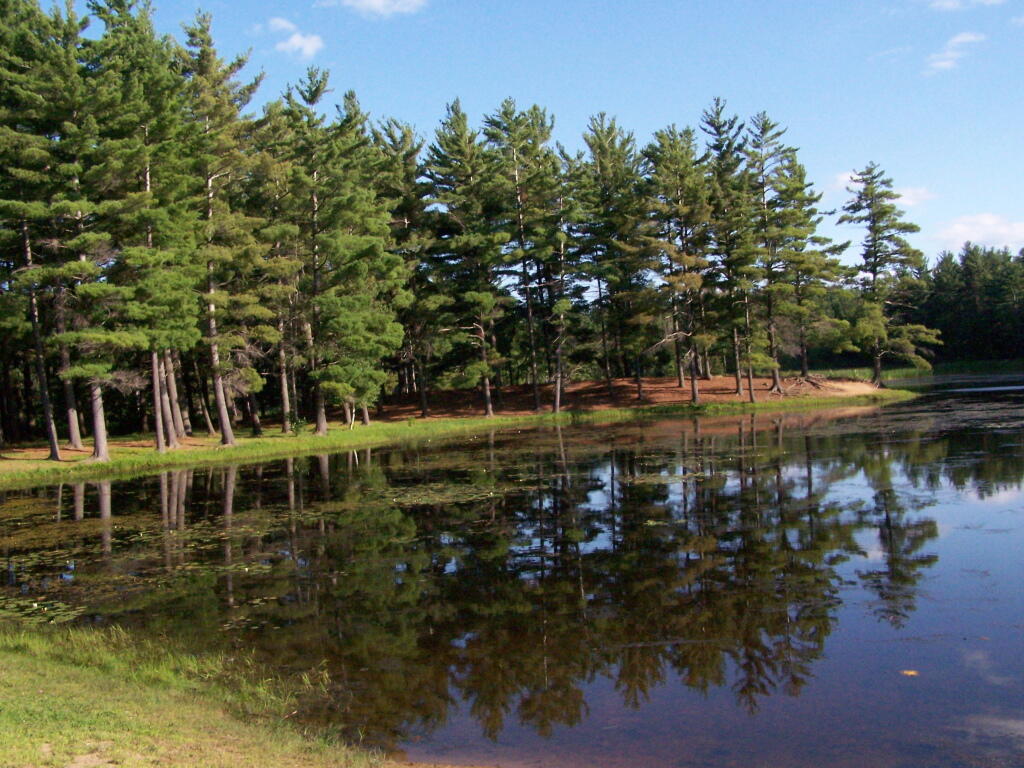
One of the major features of the area is a beautiful dammed up section of the Red Brook, that creates an artificial lake. The Civilian Conservation Corps Dam, built in the 1930s, is where CC Dam Association name comes from.
There is a swimming beach where people can swim at their own risk. As you can see, it’s some pretty nice swimming, although the lake is a little muckier then it appears in the pictures, and is a natural reddish color from the minerals in the sand of the Saint Lawrence County.
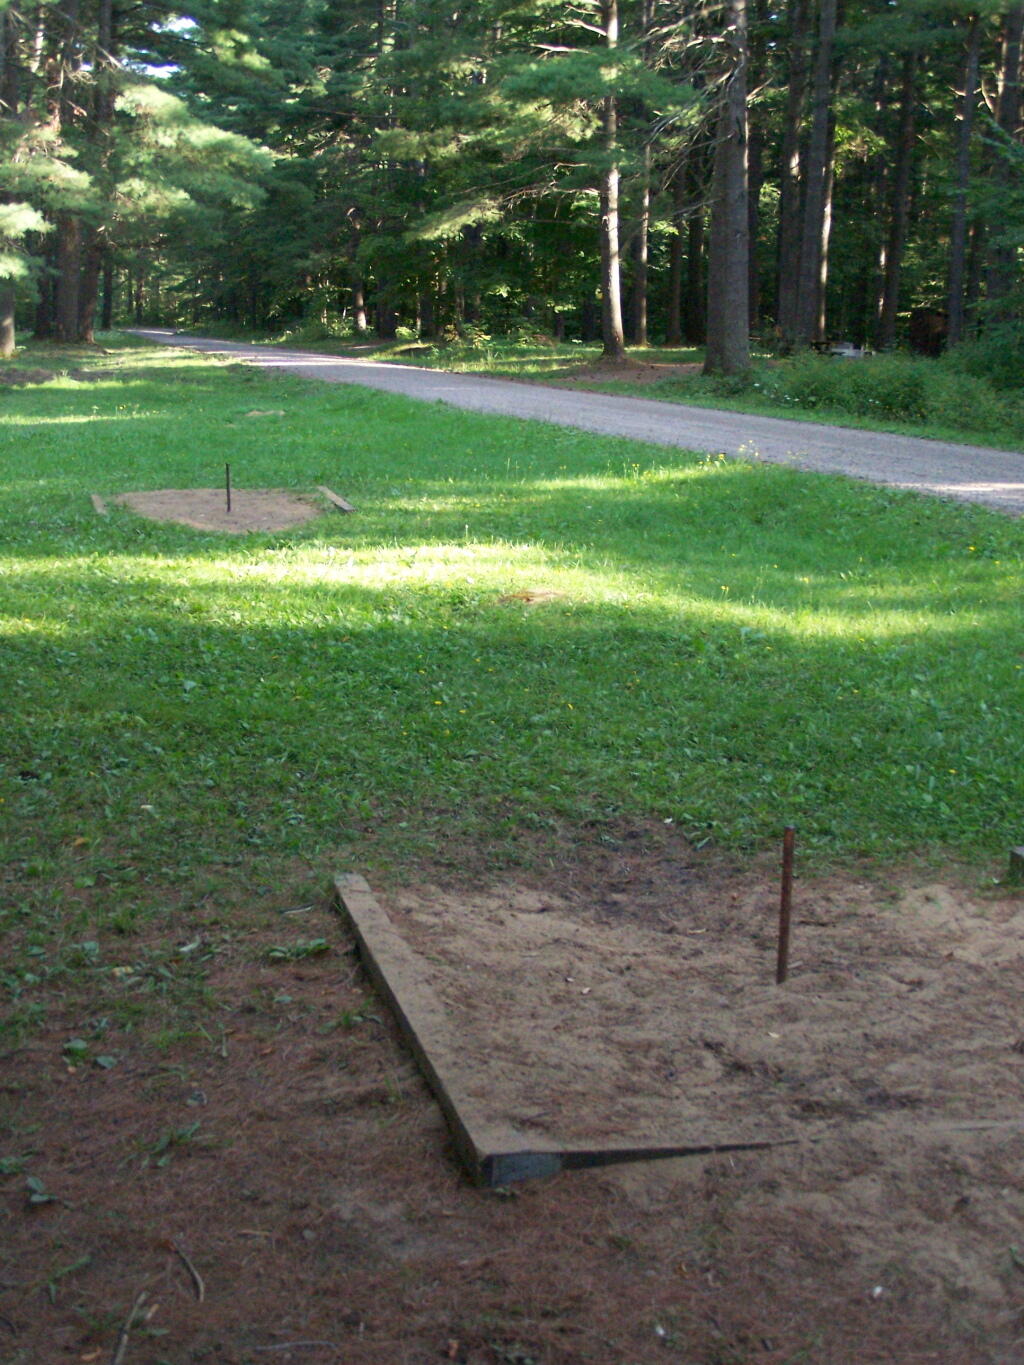
They have a horseshoe pit.
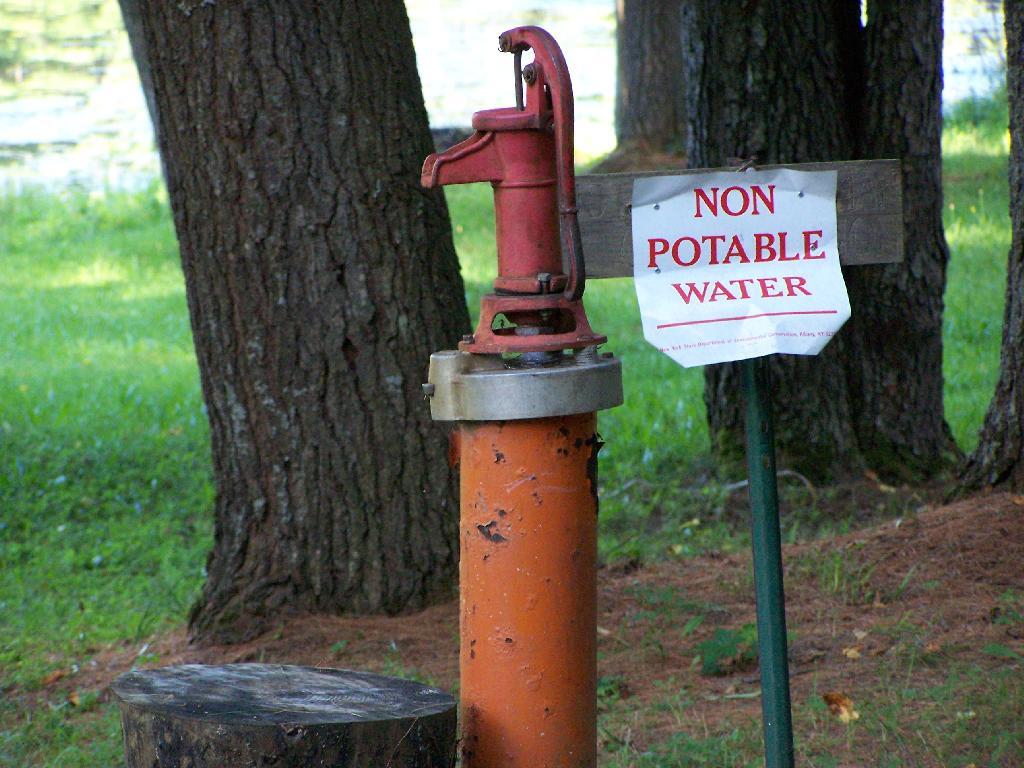
They have a hand pump for one to get drinking water. It’s marked non-potable, probably because it draws from the same shallow aquifer of the lake. You can easily boil it on a stove to make it safe to drink.
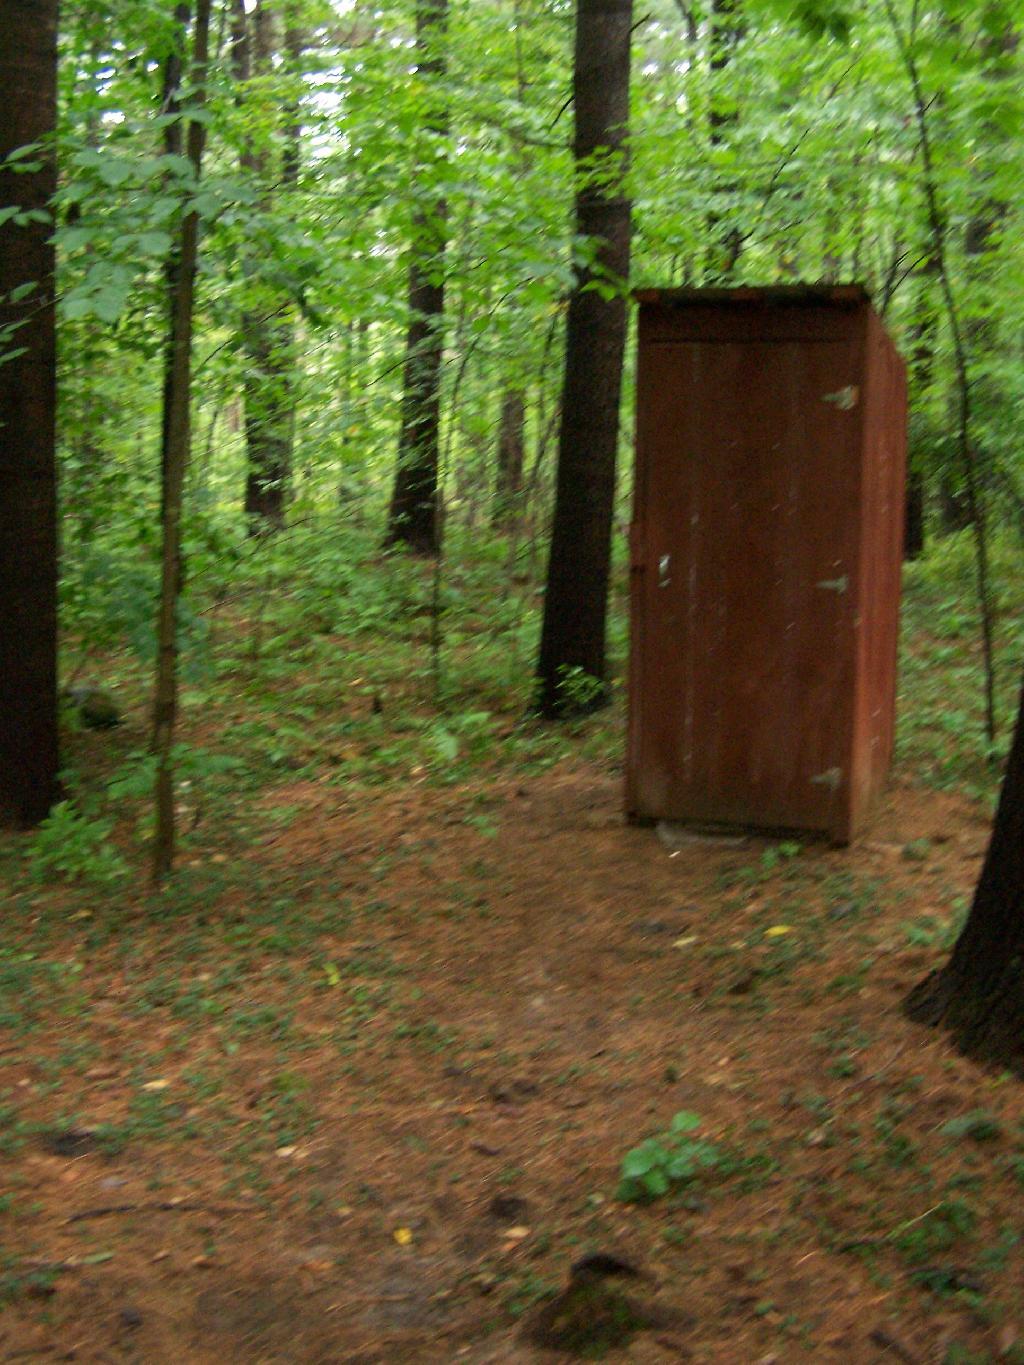
The outhouses are in quite nice shape and very clean as you can see from these inside and outside pictures.
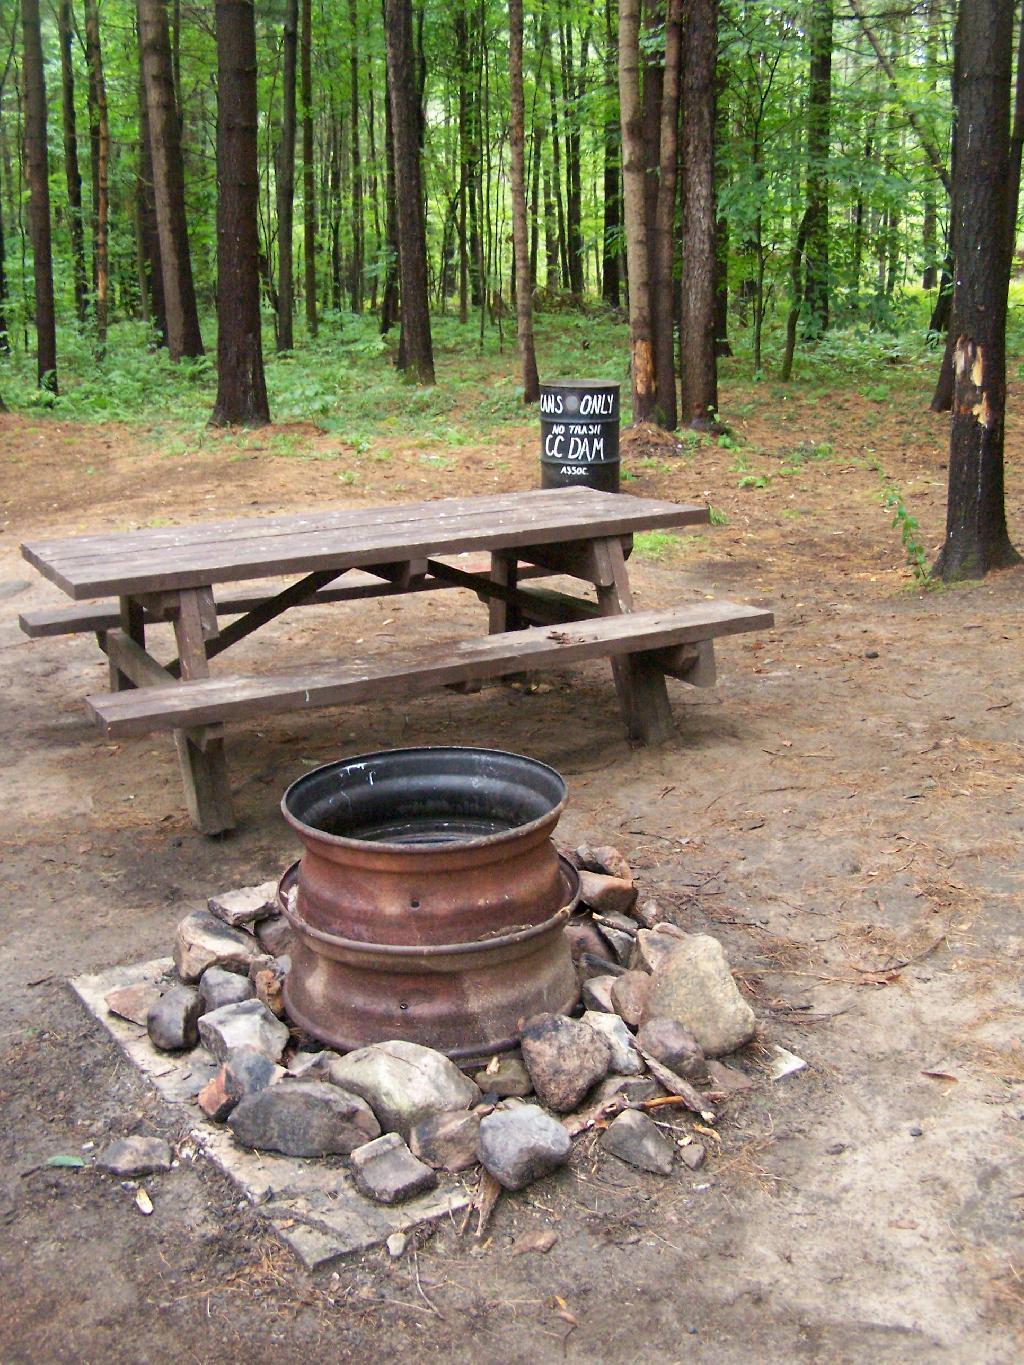
The sites are just wonderful. Here is Campsite 21 after I had put away all my gear before heading out. The fire pit rings vary, but for a free place, are pretty darn awesome.
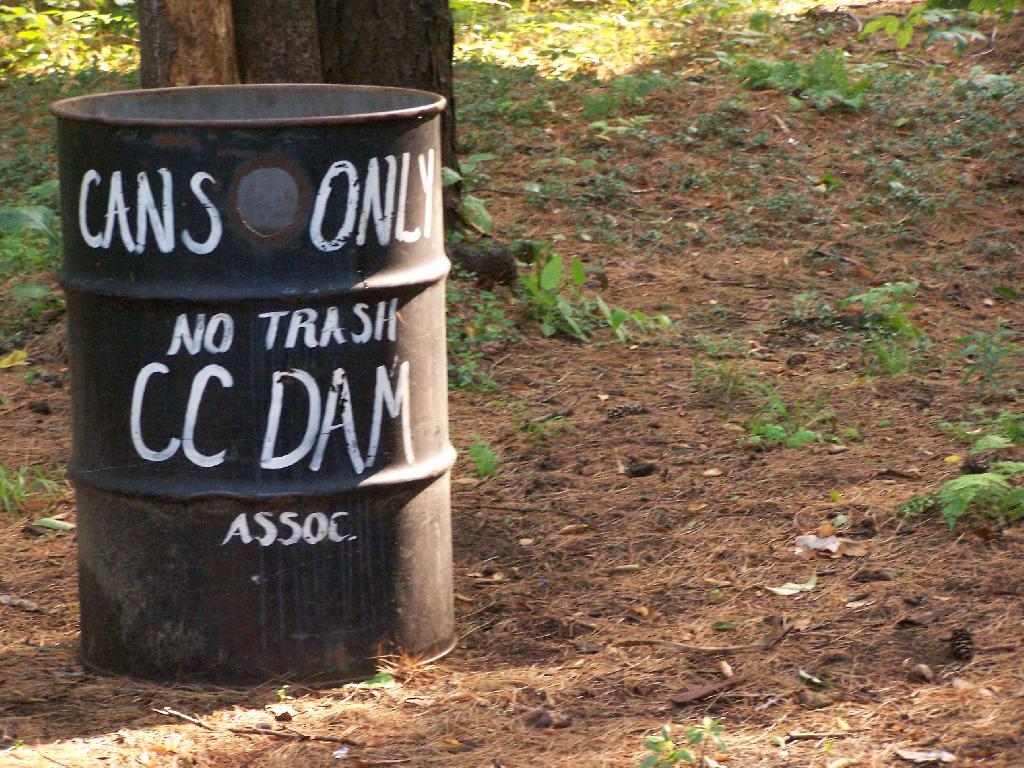
The CC Dam Association is made up of volunteers from the Tri-Town Region of Saint Lawerence County, the nick-name for the Brasher Falls/Brasher/North Lawerence hamlets that dot the country south of Malone.
They collect old beer cans and accept donations via the mail for fundraising. Since camping is free, and the place is so well up-kept, I’m sure they apprechiate the help. Not to mention, collecting beer cans probably reduces litter, because people can’t really burn them, and some can be lazy about packing out their trash.
There are a number of other marked campsites on other truck trails in Brasher State Forest, including down by the Tri-Town Horse Trail area near Brasher Falls. In addition, there are dozens of miles of truck trail to drive legally in a pickup, ride with a horse or mountain bike, or illegally on a quad.
Here is a map of Brasher Falls State Forest and it’s relationship to Massena. You can zoom in for more details. NYS DEC Land Mapper has a run down of the trails.
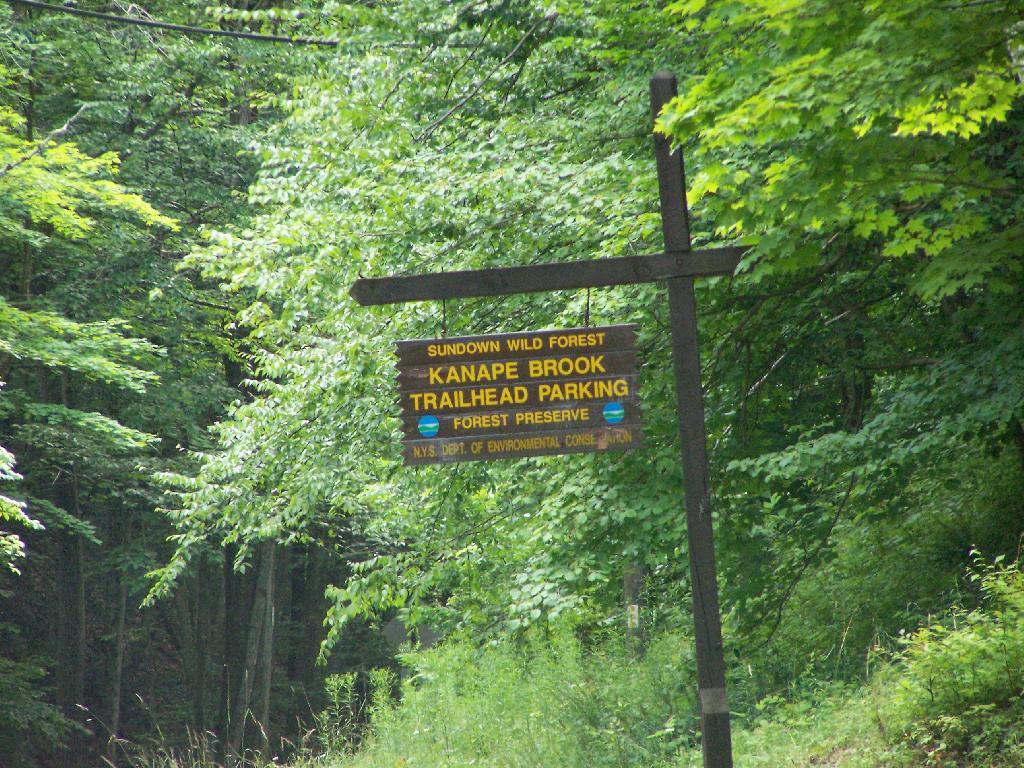
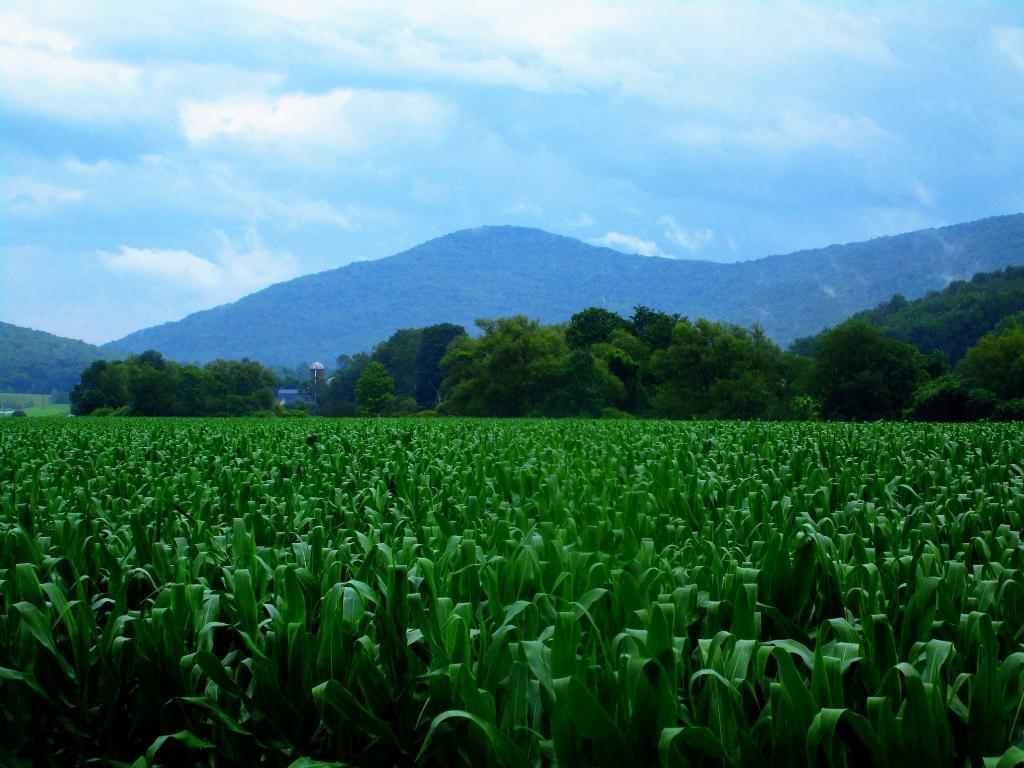
Ashokan High Point is a mountain overlooking West Shokan and the Ashokan Reservoir, however due to trees the views to the east are limited. It is reached from a parking lot off of Ulster County Route 42, a windy low-speed road that lacks guardrail protection.
I visited this after doing Red Hill Fire Tower in another section of the Sundown Wild Forest, some 15 miles to the west (30 miles via road).
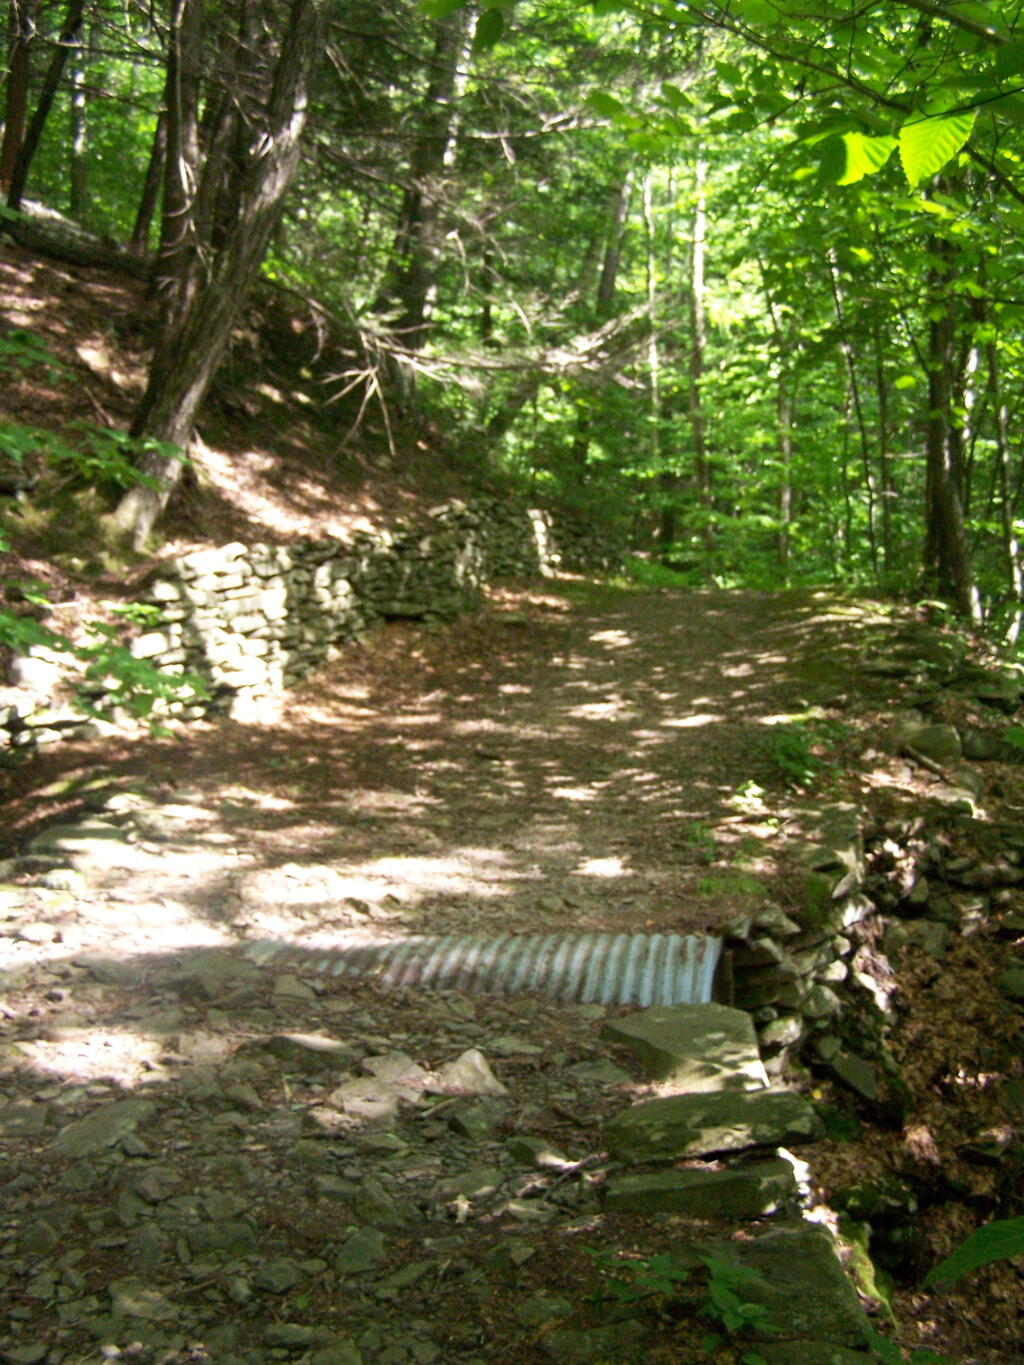
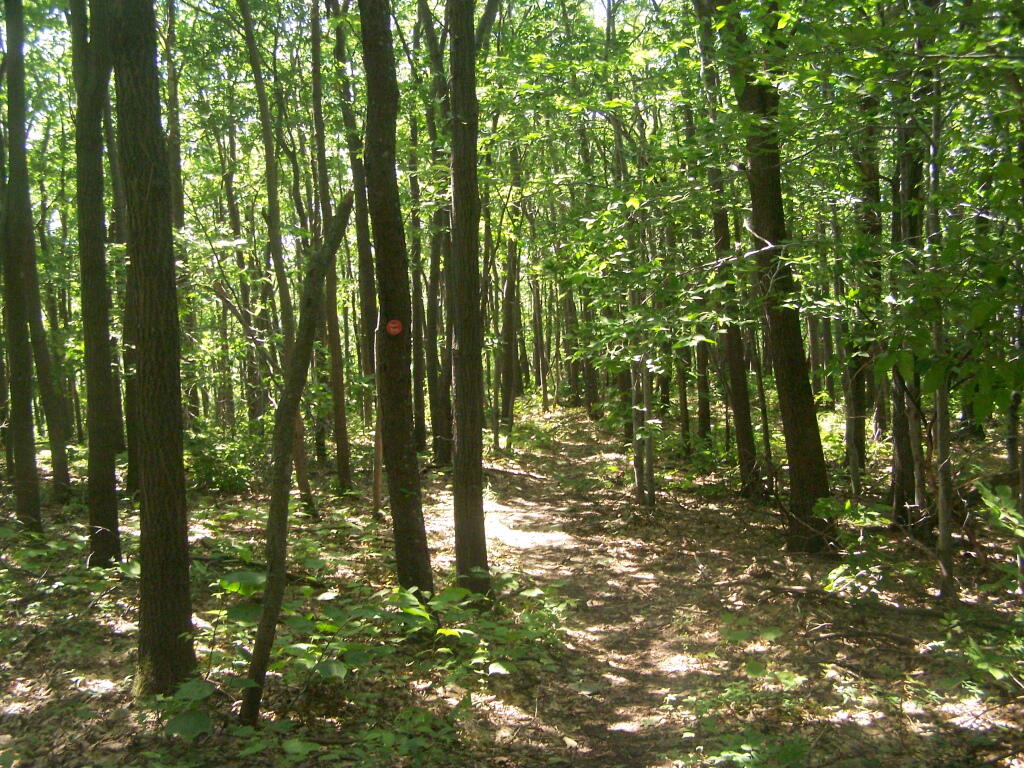
The first two miles up the trail is up an old woods road, that is relatively flat and a pleasurable walk along the Kanape Brook and in a deep clove between Ashokan High Point and Mombaccus Mountain.
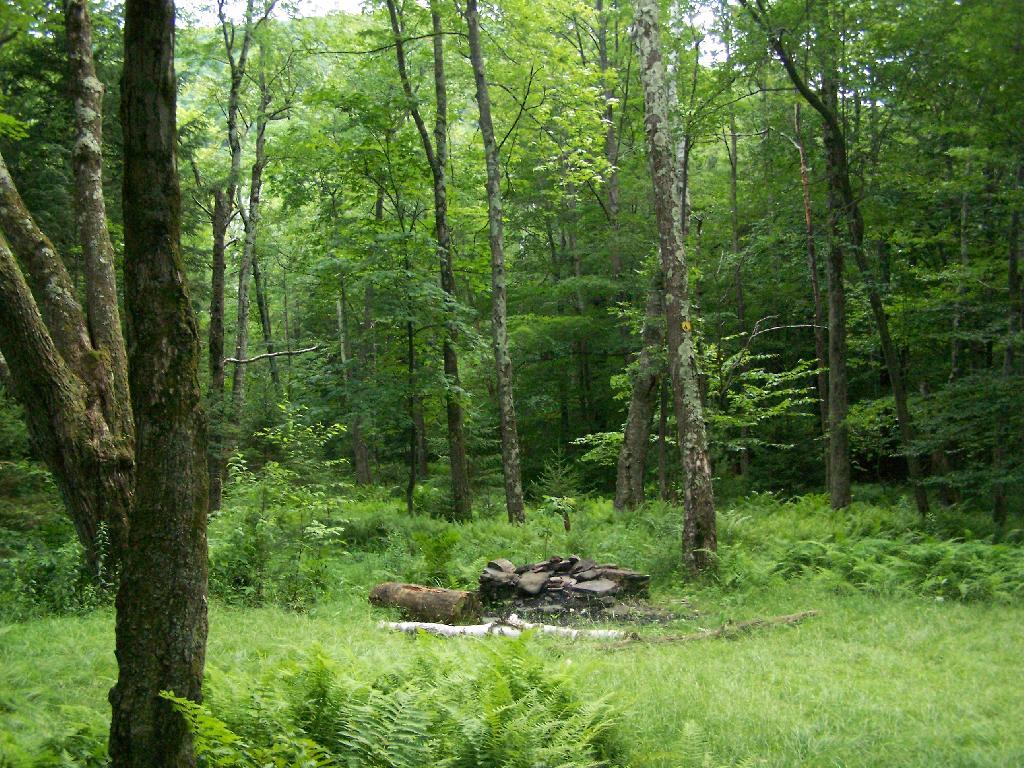
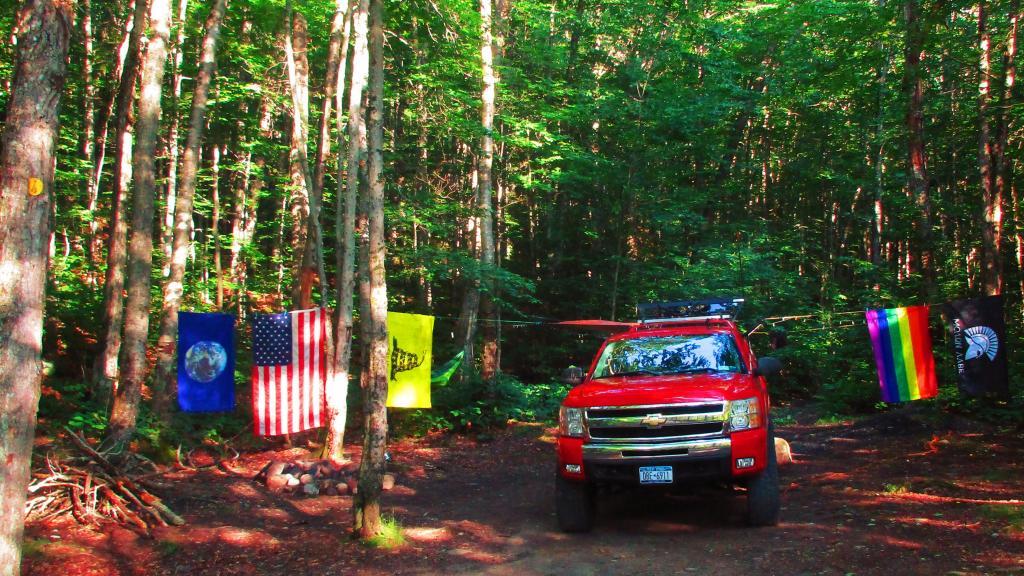
After you walk about a mile or maybe 45 minutes, you arrive at this nice little campsite right near the brook and the trail. It’s in a field, but has limited light for big portions of the day because the clove is so deep.
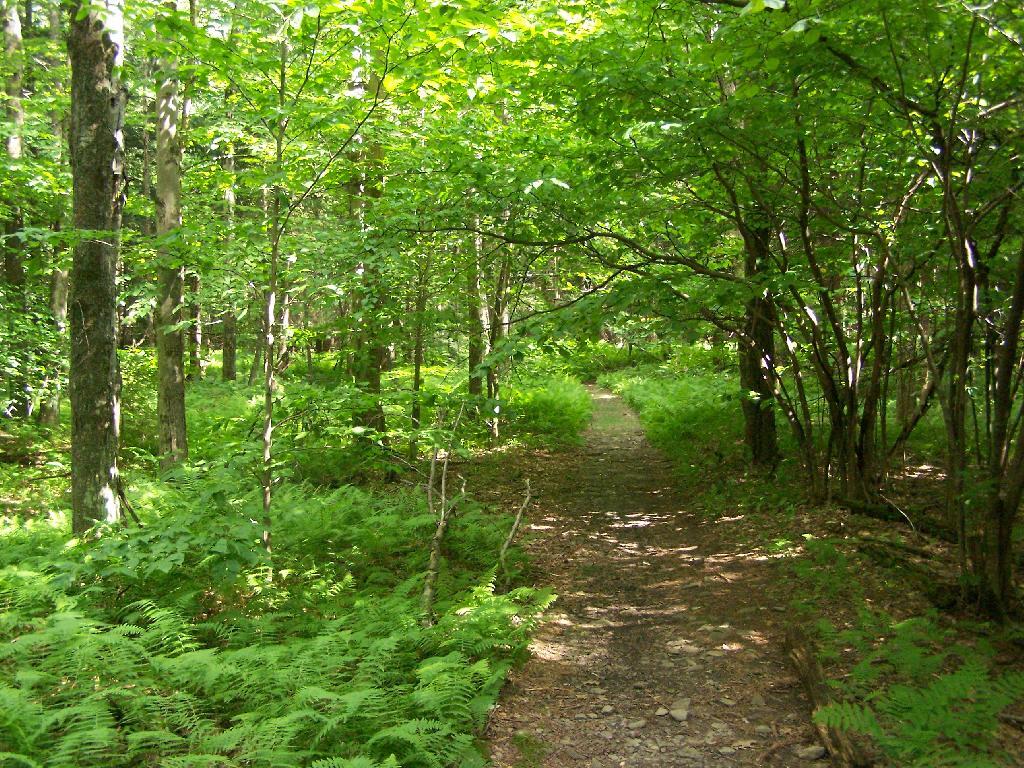
The trail seems a bit long at times, but this is the kind of delightful walking you experience. Markers are sparse along this section of trail, but if your following the old woods road it’s easier to follow.
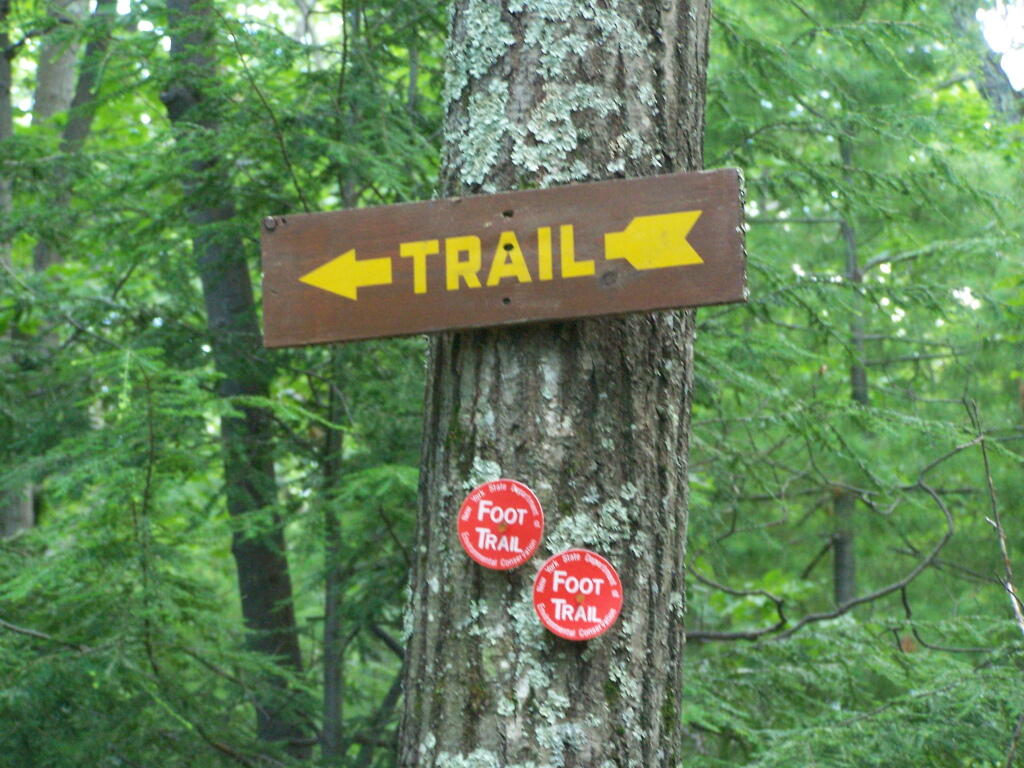
You then reach the sharp turn off the old woods road, to where the trail splits to the upper loop. As you can see, the turn is well marked.From here on out, you gain about 1,000 feet over the next one mile. It’s quite a bit steeper, but nothing is hands and knees hiking.
As you start to do some serious climbing, you get partial views to the west.
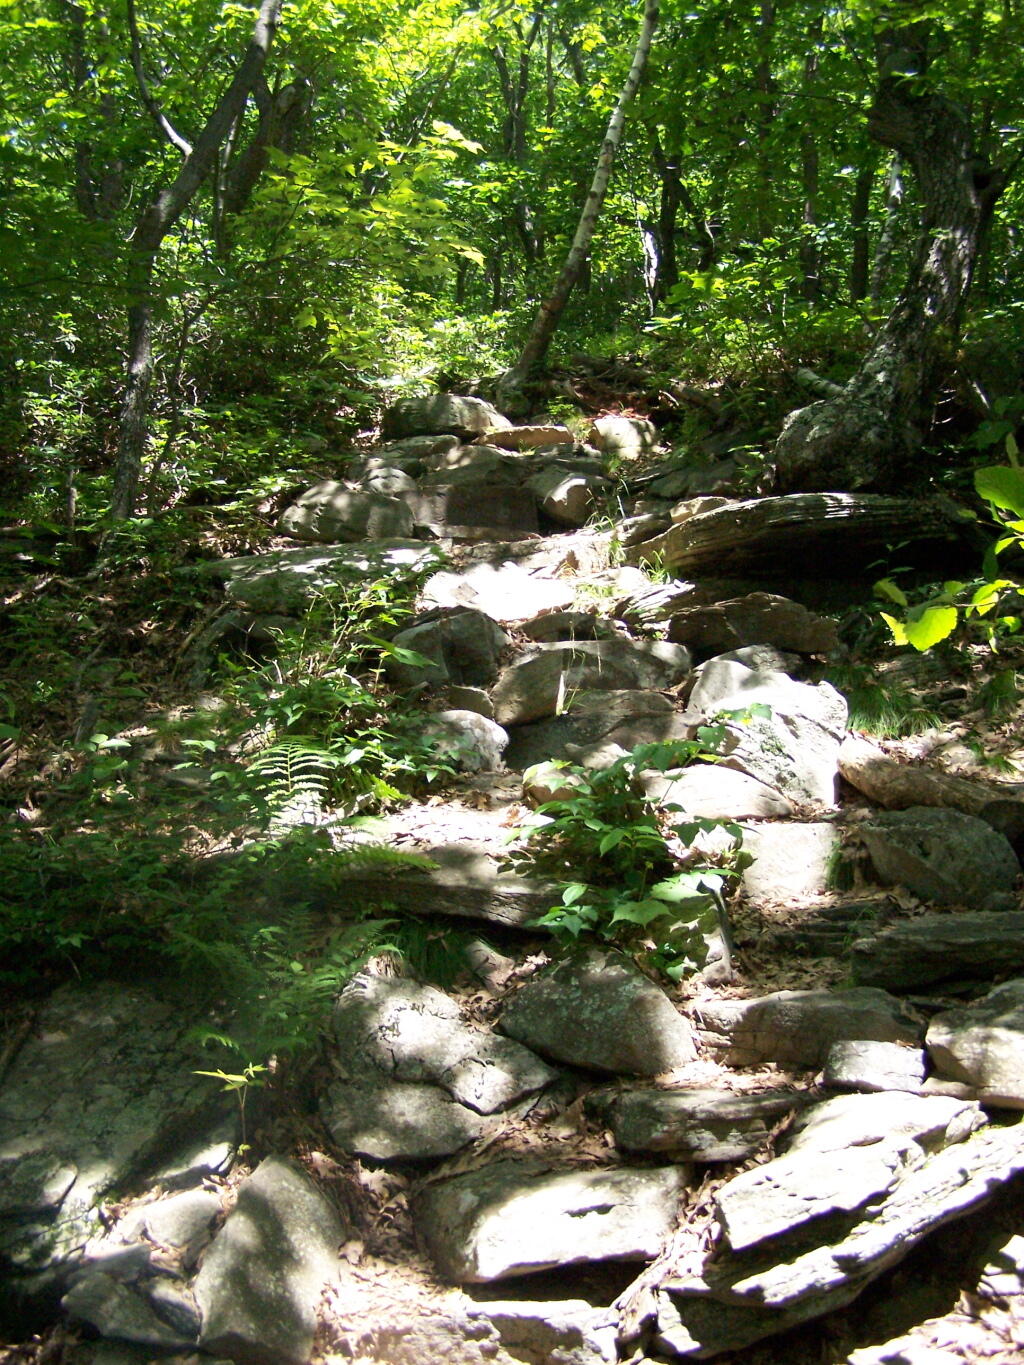
And the trail gets steeper for the next 1/2 mile. They have put in several rock steps to make the climb a little bit easier. Nothing that couldn’t be made by a child or a pet though, and no scary views/ladders.
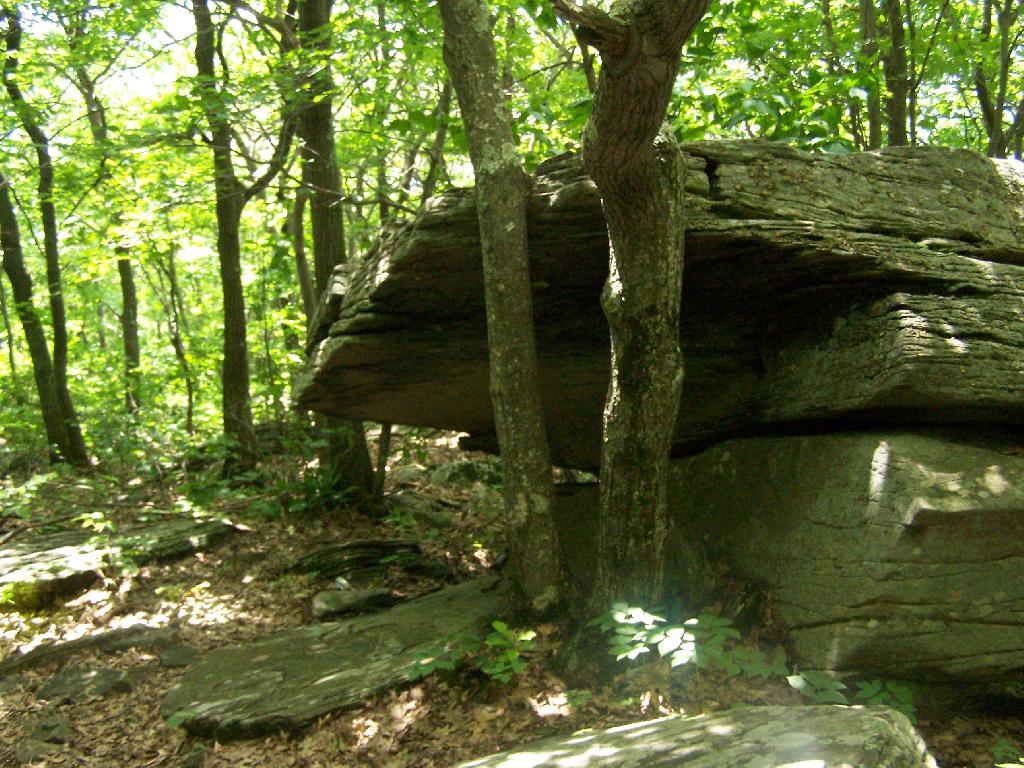
Once you are within a 1/4th mile to the top, you stop doing much climbing. If your caught in a storm, this rock offers some protection.
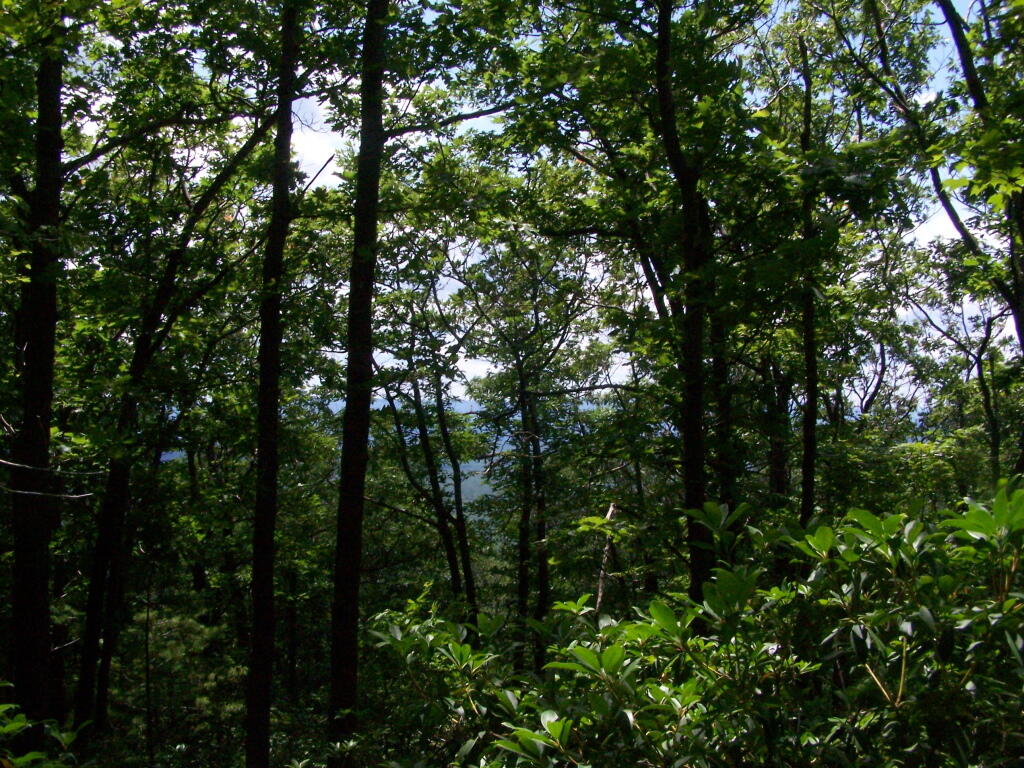
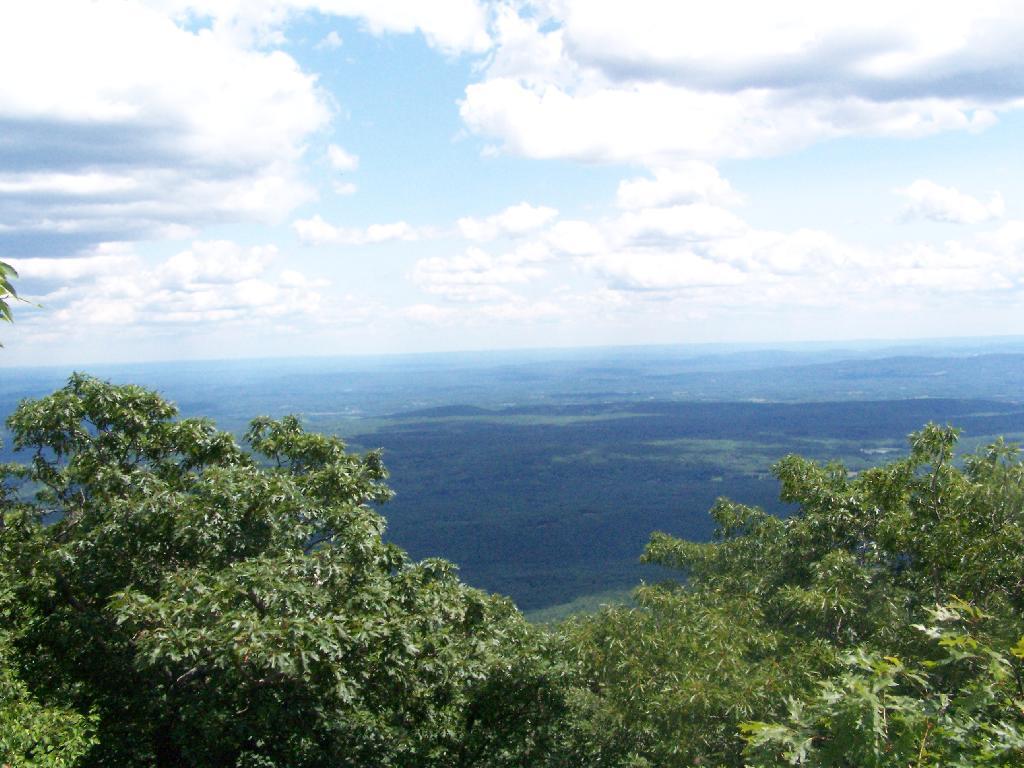
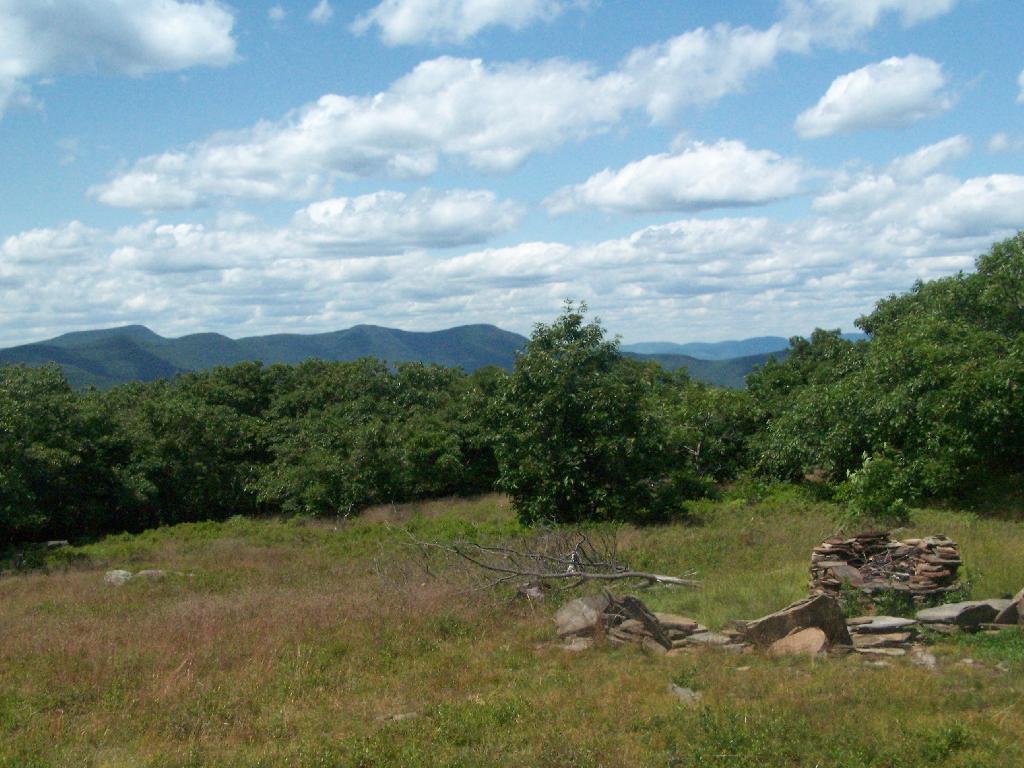
You’ve basically reached the top when you get this nice westerly view of Moccabus Mountain through the trees. You can stop over here, or continue to the top for better southernly views.
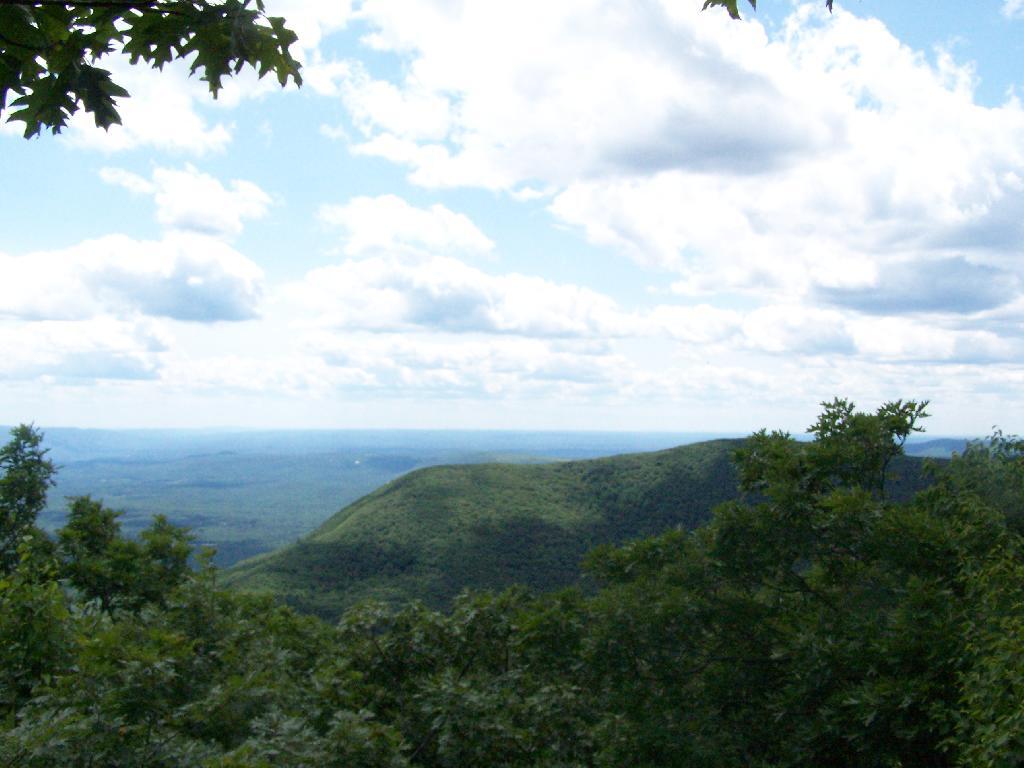
From the top, you have limited views looking south towards the Shawangunks, surrounded by trees. There supposedly is an unmarked trail you can take down to the “ledge” for 180 views. Without a good map, I decided not to proceed down to the ledge.
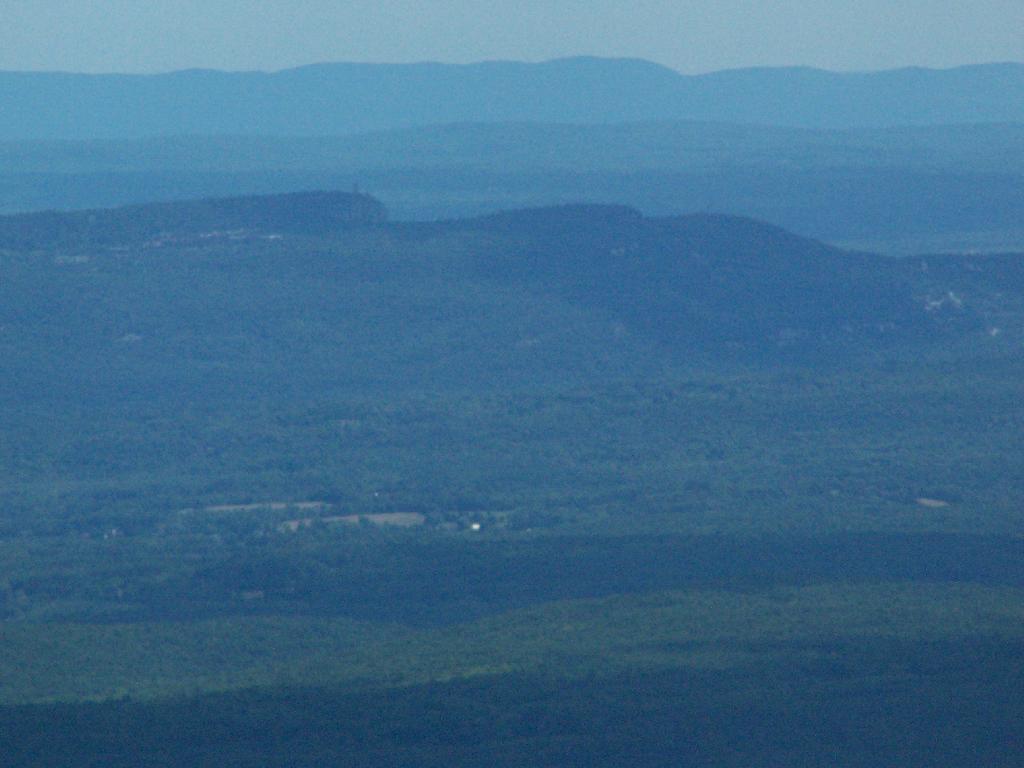
The Shawangunks, shrowed in haze. They are small compared to the Catskills but an interesting profile in the sky.
Along the top there is a trail that runs through a 1/2 mile of Blueberry fields. I was foruntate to be there when they where in season.
On the other side of the mountain, there is an informal campsite with fantastic views of the High Peaks Region of the Catskills.
The trail down the backside of the mountain is without views, and is less steep but much longer, and winds up and down a few ridges. Nothing really worth visiting — go back the way you came.
You return back to where the loop splits, and return back the trail you took up. It’s a 7.5 mile hike total, but a relatively easy one that you can do in a few hours in an afternoon, and not be totally exhausted.