Land Use, 2016 vs 2011 in New York State
I have been experimenting with the National Land Cover Dataset to get a better idea of how much land is developed in New York and changes in land use patterns in New York. Over the past five years, there has been a notable up-tick in mixed forest, replacing shrub and scrub from abandoned farmland. Woody wetlands are alos increasing – this might be some of shrub and scrub that has grown up from abandoned farms.
| 2016 Sq Mi | 2016 Acres | % of NY state | 2011 Sq Mi | 2011 Acres | % of NY state | Chg Sq Mi | Chg Acres | % Change | |||
| Barren Land | 137 | 87,670 | 0.3% | 121 | 77,706 | 0.2% | 16 | 9,965 | 0.0% | ||
| Developed, High Intensity | 337 | 215,865 | 0.6% | 333 | 213,123 | 0.6% | 4 | 2,741 | 0.0% | ||
| Herbaceuous | 355 | 227,180 | 0.6% | 440 | 281,667 | 0.8% | -85 | -54,486 | -0.2% | ||
| Emergent Herbaceuous Wetlands | 416 | 266,550 | 0.8% | 483 | 309,090 | 0.9% | -66 | -42,540 | -0.1% | ||
| Shrub/Scrub | 417 | 266,874 | 0.8% | 1,506 | 964,081 | 2.8% | -1,089 | -697,207 | -2.0% | ||
| Developed, Medium Intensity | 710 | 454,218 | 1.3% | 689 | 440,979 | 1.3% | 21 | 13,239 | 0.0% | ||
| Developed, Low Intensity | 1,226 | 784,919 | 2.2% | 1,168 | 747,255 | 2.1% | 59 | 37,664 | 0.1% | ||
| Developed, Open Space | 2,601 | 1,664,794 | 4.8% | 2,357 | 1,508,726 | 4.3% | 244 | 156,068 | 0.4% | ||
| Woody Wetlands | 3,670 | 2,348,698 | 6.7% | 3,015 | 1,929,762 | 5.5% | 655 | 418,936 | 1.2% | ||
| Cultivated Crops | 3,879 | 2,482,645 | 7.1% | 3,977 | 2,545,311 | 7.3% | -98 | -62,667 | -0.2% | ||
| Evergreen Forest | 3,986 | 2,550,989 | 7.3% | 4,498 | 2,878,713 | 8.2% | -512 | -327,724 | -0.9% | ||
| Mixed Forest | 5,293 | 3,387,748 | 9.7% | 3,576 | 2,288,606 | 6.5% | 1,717 | 1,099,142 | 3.1% | ||
| Hay/Pasture | 6,343 | 4,059,320 | 11.6% | 6,676 | 4,272,694 | 12.2% | -333 | -213,374 | -0.6% | ||
| Open Water | 7,445 | 4,765,120 | 13.6% | 7,509 | 4,805,808 | 13.7% | -64 | -40,689 | -0.1% | ||
| Deciduous Forest | 17,827 | 11,409,298 | 32.6% | 18,297 | 11,709,980 | 33.5% | -470 | -300,682 | -0.9% | ||
| New York State | 54,644 | 34,971,887 | 100.0% | 54,646 | 34,971,887 | 100.0% | -3 | -1,613 |
I find it’s usually easy to find the answer these days if you know what the proper question is.
I find it’s usually easy to find the answer these days if you know what the proper question is.
Do Crosswalk And ‘Close Door’ Buttons Really Do Anything.
Onondoga County Homeownership
Saturday
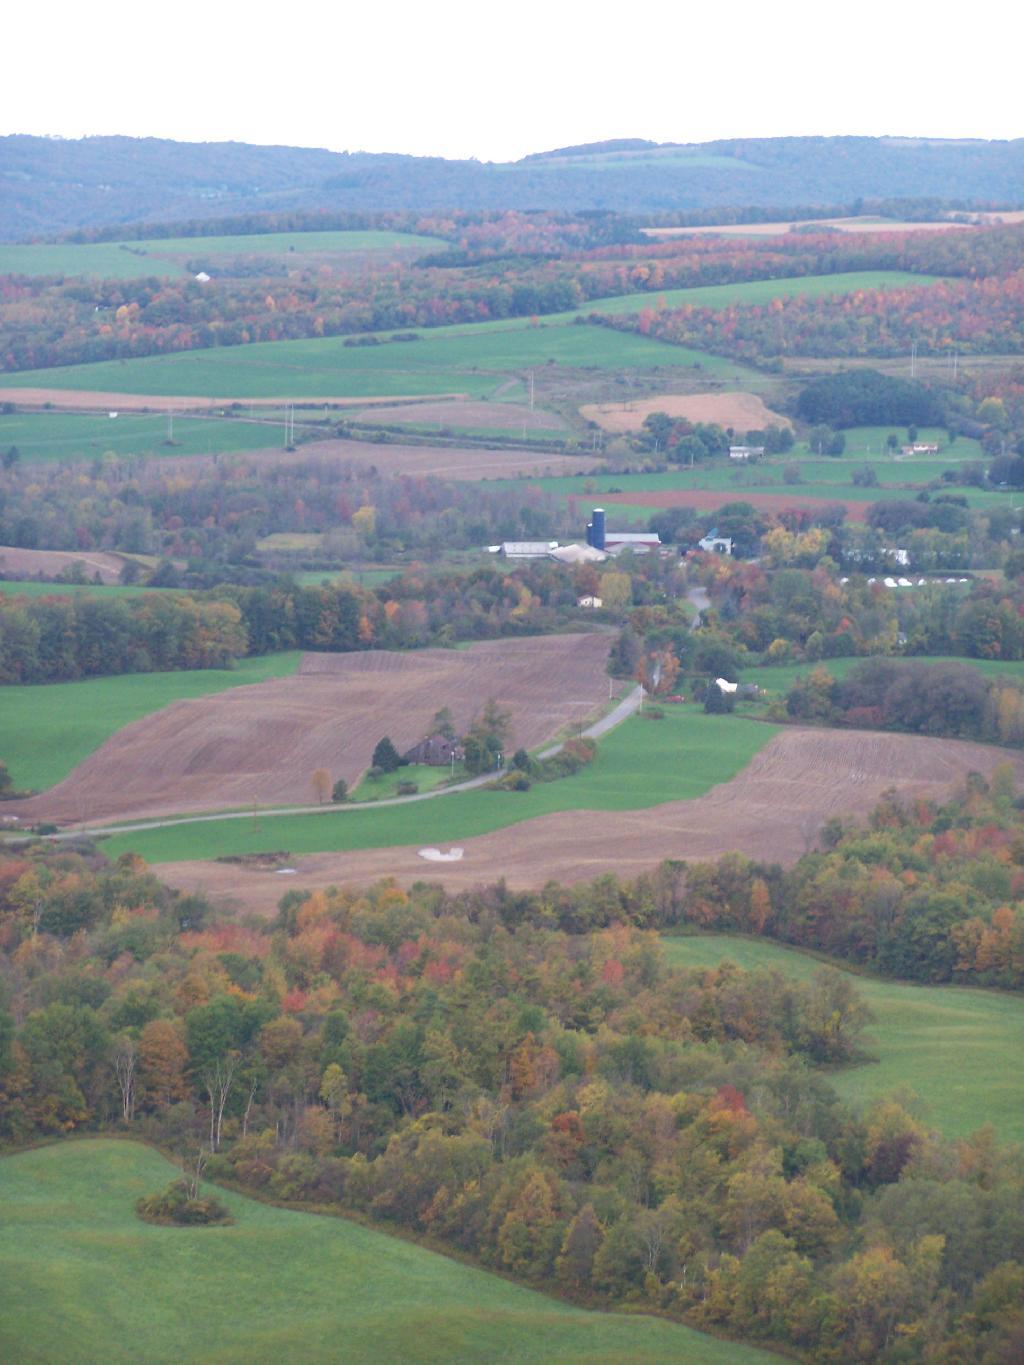
Towards Meeker Hill
Looking at the landscape approaching this hill to the North.
Taken on Saturday October 2, 2010 at Labrador Hollow Unique Area.

