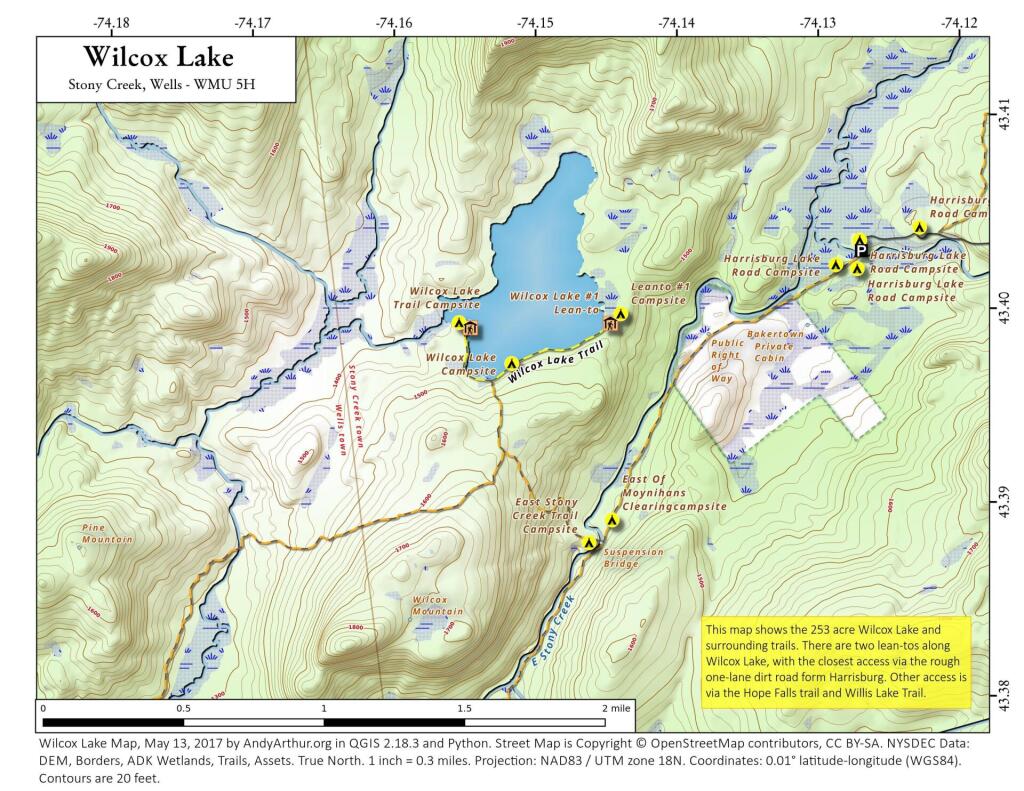
Photo of Andy Arthur

Andy Arthur

Ultimately maybe I could have headed out of town this weekend, πŸ•οΈ but that's behind me and I found ways to be busy and have fun riding down to Henry Hudson and Hollyhock Preserve this weekend. And doing lots of reading. I'm hoping for better weather next weekend, but maybe it's time to get out of town regardless.

Change in Plant Hardiness Zones, 2012 to 2023 in New York State

Change in Plant Hardiness Zones, 2012 to 2023 in New York State

I did some raster math to compare the 2012 plant hardiness zones to the 2023 plant hardiness zones. Most of the state was bumped up one zone, though many of the higher elevation areas remained in the same zones.
 
Interestingly enough, the Western Catskills actually fell back one or two colder Plant Hardiness Zones with the latest maps while the most of the state advanced to a warmer plant hardiness zones. The Western Catskills had a handful of particularly cold mornings in recent years, though maybe it's also an artifact of how PRISM krigings the temperature data.

I am also not convinced the area around Chautauqua Lake jumping from 5B to 6B or the Southern part of the Tug going from 5A to 6A. It's possible, but I am thinking it's a kriging artifact.
 
The 2012 Plant Hardiness Zones were really old data, 1975-2006, even at the time they were released. The 2023 Plant Hardiness Zones are 1990-2020, which is much more up to date. This is very problematic as the late 1970s were an exceptionally cold winters in New York's history. Old Forge hit negative 52, on February 18, 1979 which throws everything off.
 
Minor edits to this map on 11/7. Basically rather then comparing them using raster math, I did the contours separately for each year and then joined them against and did the math on the vector. Rethinking it, the later method is more accurate then with raster method, at least in comparison of other maps. That said, either way the result is very similar, we are talking about splitting fractions of a degree, which make the categories slightly different. Like anything, it's a matter of how you ask the question and the methods used.

NYS Population in Each Plant Hardiness Zone

Nearly 2 / 3rds of New York lives in Zone 7, with only 7% living in Zone 5a or colder.

Zone Min Population Percent of State
3b βˆ’35 2,211 0.01%
4a βˆ’30 110,324 0.55%
4b βˆ’25 302,565 1.50%
5a βˆ’20 989,435 4.90%
5b βˆ’15 2,455,523 12.16%
6a βˆ’10 2,675,357 13.25%
6b βˆ’5 1,015,609 5.03%
7a 0 3,940,523 19.51%
7b 5 8,704,603 43.10%
Andy Arthur, 8/11/23.

Zone data derived from the PRISM Climate Group, Oregon State University and USDA, with the state’s population from 2020 US Census.

This actually makes a lot of sense because most of New York’s population is in New York City or Long Island, and much of rest is Westchester, Rockland, Buffalo and Syracuse.

Olean

Ortho Olean

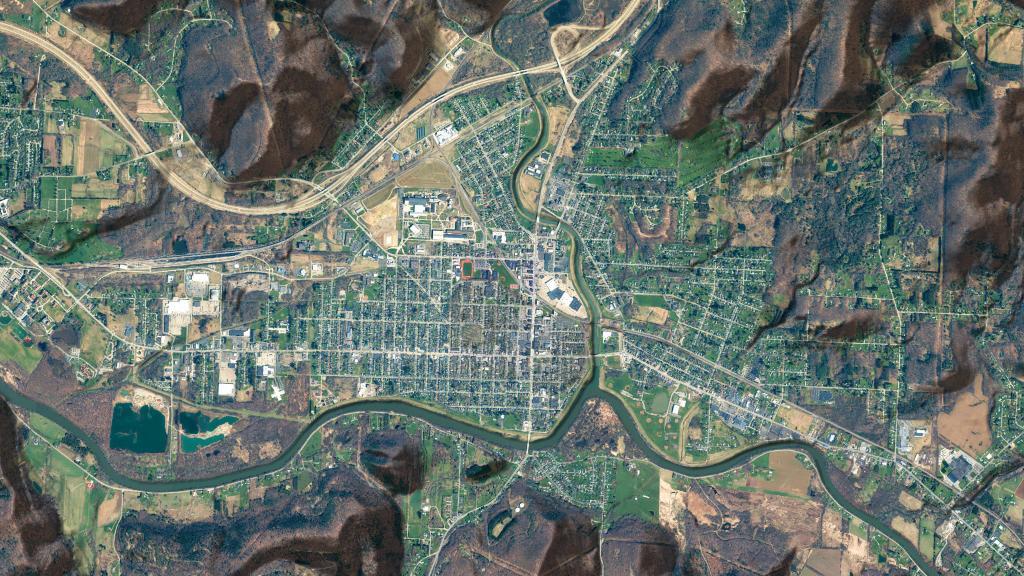
Olean is the largest city in Cattaraugus County and serves as its financial, business, transportation and entertainment center. It is one of the principal cities of the Southern Tier region of New York. It's population is 13,711 and is bordered by the Allegheny River to the south and Interstate 86, the Southern Tier Expressway to the north. The Olean Creek joins the Allegheny River in the city, and the hills surrounding the city are historical centers for oil production, although most of the wells are just stripper wells nowadays, producing a few barrels a day.