A common question is what county is something located in. This map, using the power of the Google Maps Geocoder can help you locate a street address or building name, then see under it a county map. You can click at the layer below it to figure out what county the point is located in. County Map data comes from the US Census TIGER Map project.
Been building a collection of geopackages from counties containing current election districts
Most counties nowadays post their election districts nowadays on their interactive mappers which are backed by ArcGIS REST/services. So you can either Google the REST/services or watch them in the network debugger in the browser to get the URL and then connect to them in QGIS to download the file. Some counties – Allegany and Rensselaer along with New York City and Westchester post shapefiles on their website.
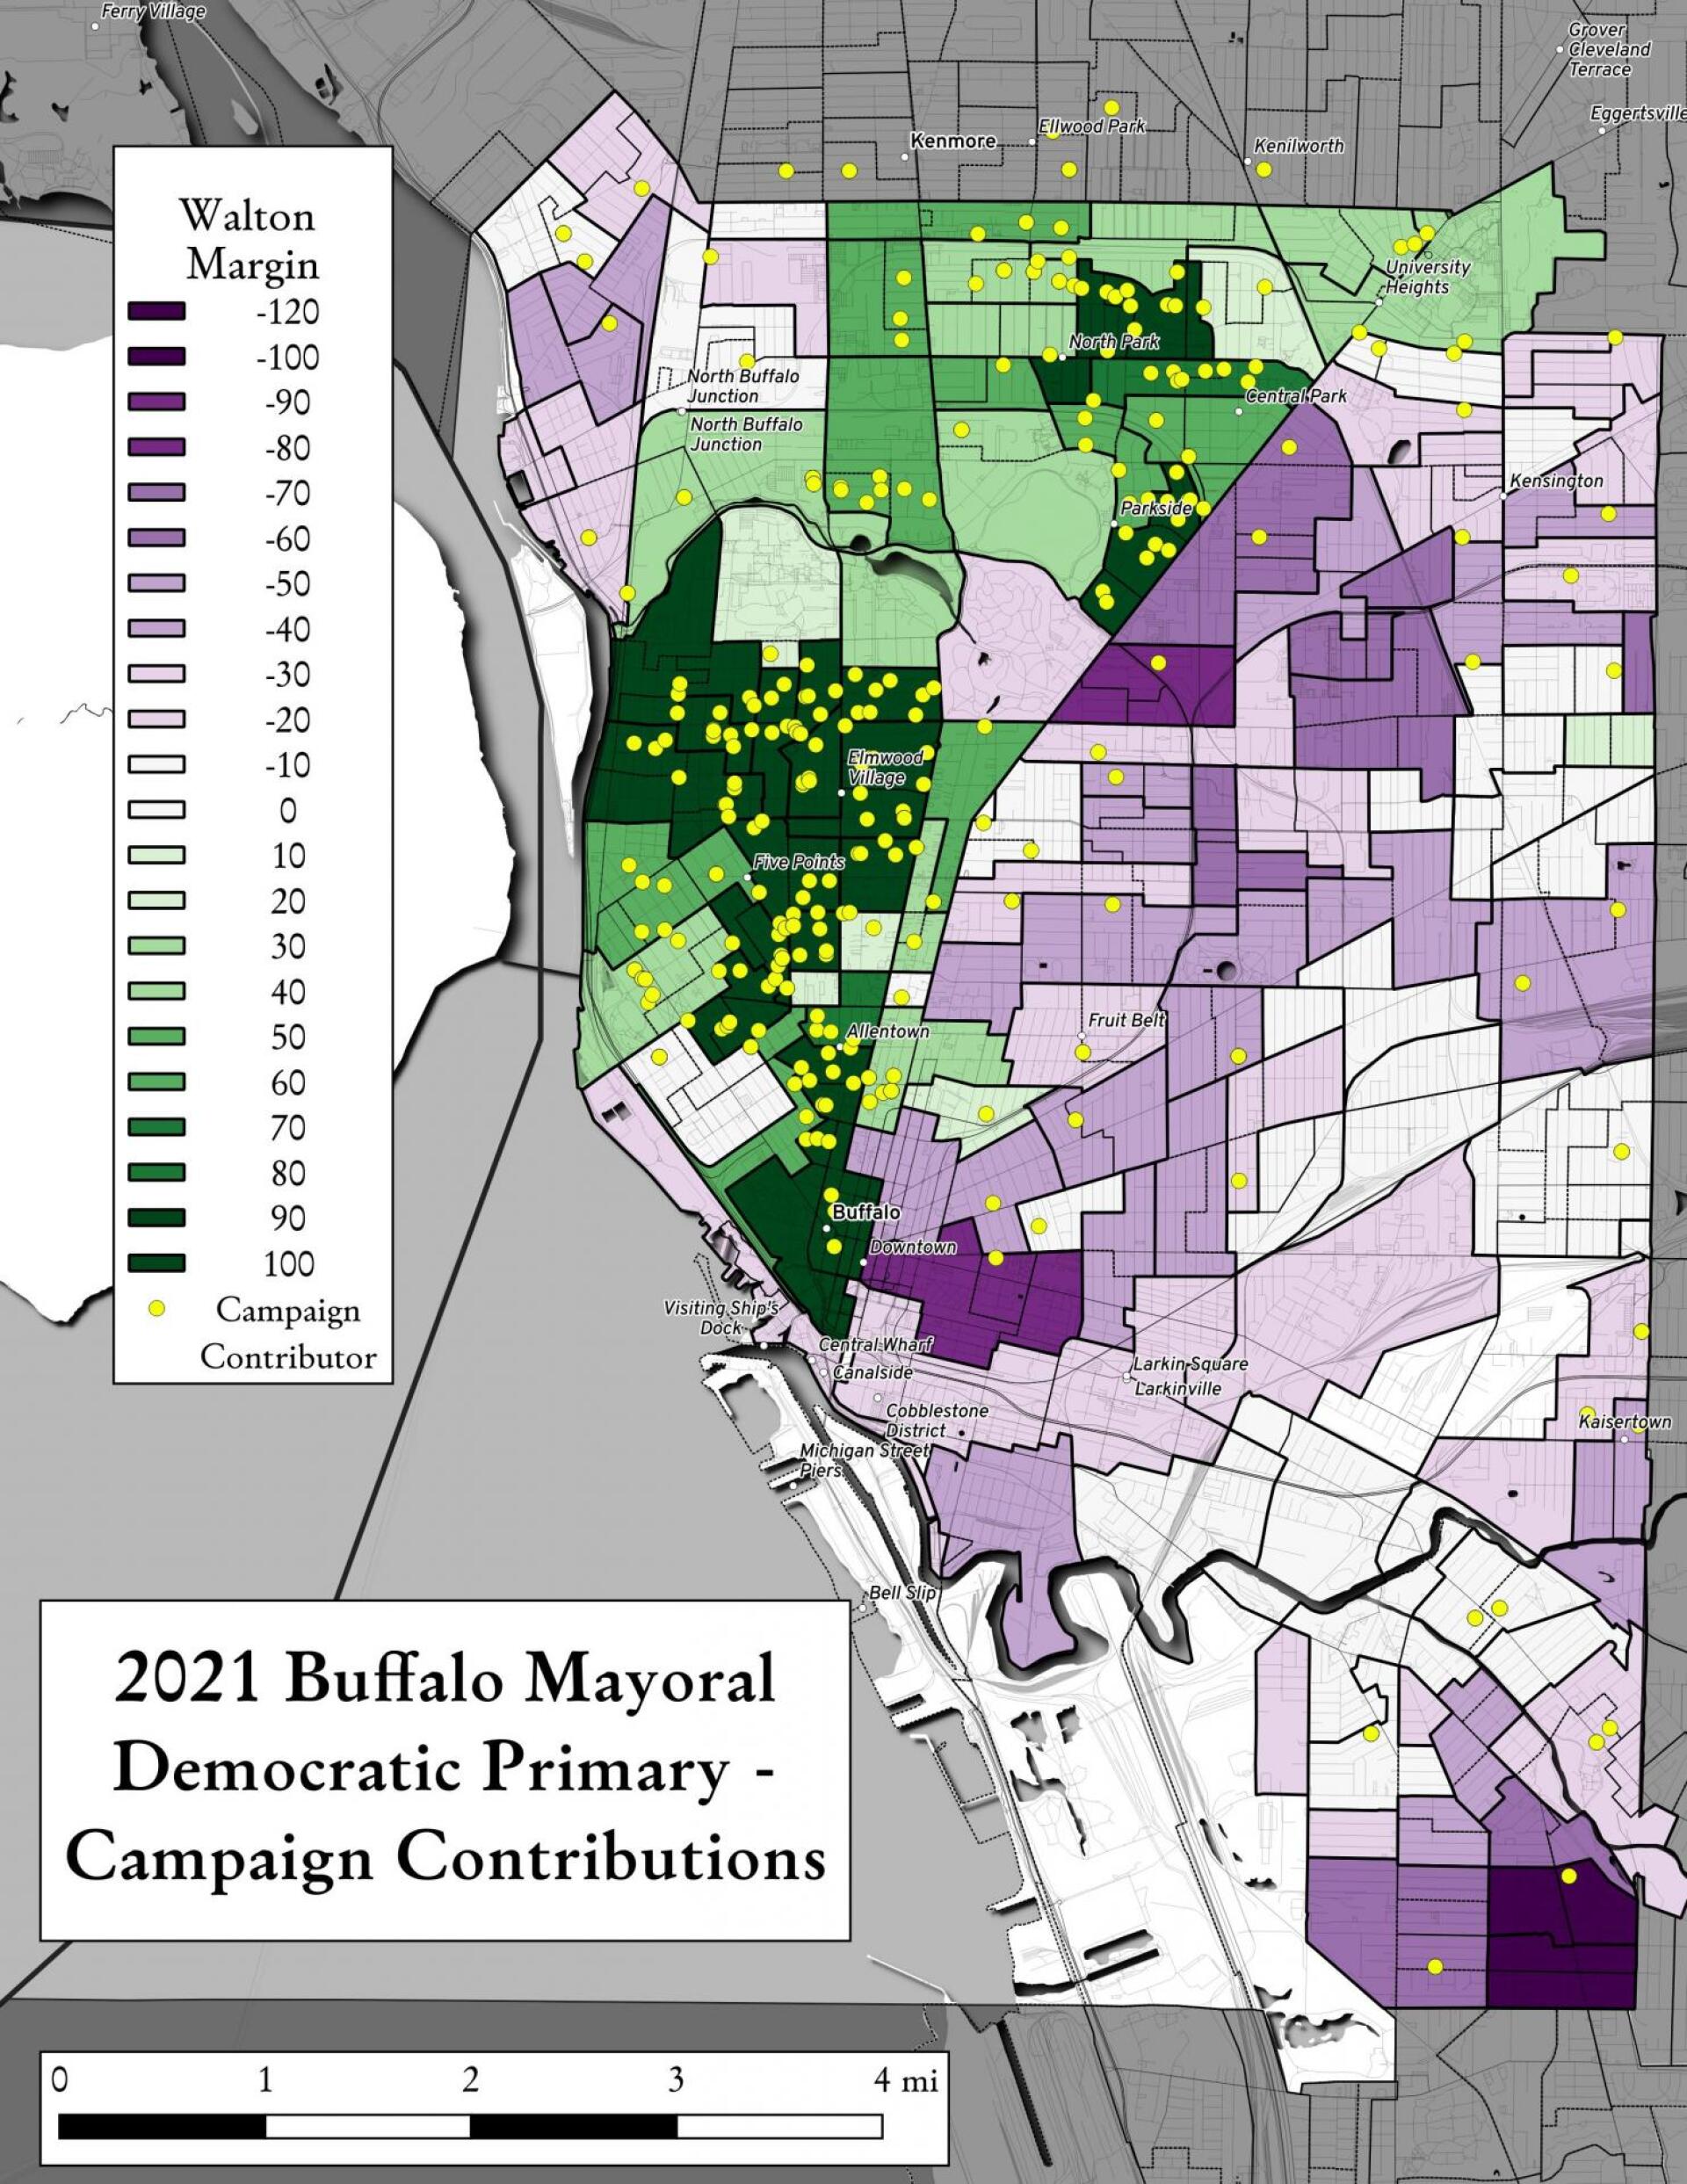
Come redistricting I’m afraid the old election districts will disappear from public view on the servers and won’t be able to obtained easily. But having the old district lines is valuable as you can plot old elections on maps such as the 2018 or 2020 elections than port them over to the new district. Or create cross walk documents that show old versus new election districts. To a certain extent you can use the Voter Tabulation District file put out by the Census Bureau but the problem is that the Census Bureau often collapses small election districts, making it difficult to merge against past local election races.
The state’s LATFOR commission will late this year release election results for recent elections tallied by Voter Tabulation District, that they purchased from a vendor for redistricting purposes. That data will be fairly valuable, especially once they are joined against the new, well updated, election districts created or updated by county boards of elections next year. There is quite a bit of math involved in making the calculations – working with percentages of the old election districts – but I expect I can do a lot of that with PANDAS fairly easy. This might make some pretty maps and interesting analysis of local races.
This interactive google map shows how many maple taps were driven in for each county. New York State and Vermont are the nation's biggest maple producers, but there are several other states that have smaller numbers of trees tapped. This is a consolidation of county level data, those counties with only one farm reporting maple production, were not included in the survey results, which depresses tap counts in counties that are marginal maple producers.
Usually when I want to research a New York organization I start at NY Open Government, which is a website put out by the NY Attorney General and brings together several open datasets.
One way to find people’s addresses is to find them in the voter file. Voter Ref contains the voter files for several states, which can be handy for looking up people’s addresses, date of birth, party registration.
You can confirm the latest information on people’s voting registration and address by using the state board of election’s voter lookup. You will need their county, date of birth and zip code which you can get from Voter Ref.
See Through NY has listings of many though not all government employees, which can be useful when you are trying to find information on government workers. No addresses here, but you can find salaries and who people work for in government. If you need bulk data, I wrote a scraping script.
Another good way to gleam people’s addresses and the candidates they search is NYS Campaign Finance Search. If you think somebody might work for a candidate or campaign, you can search the campaign expenses section.
Every county in New York State is required to post their tax rolls to their website. Tax rolls can be usually found by searching on Google: “XXXX County Tax Rolls” without the quotes. Not only can you find all of the properties owned by a person that way, you can find their address, assessed value and other information. Often the county tax rolls include information on tax exemptions, such as the Guilderland Solar Exemption and Veterans STAR Reduction, which can help you find people who have solar on their homes or are Veterans. I wrote a script to convert the PDFs into Excel spreadsheets.
If you need to search a whole county or the even the state, you will want to get the full roll from NYS GIS. You don’t need mapping or GIS software to use the Shapefiles — Microsoft Excel and OpenOffice can natively open .DBF which contain the data tables. NYS GIS offers selected countys tax-maps as a Shapefile or GeoPackage too.
In addition, most counties offer their tax maps as ArcGIS REST/Services that can be used in a GIS Program like QGIS. You can find them by searching on Google: “XXX County “REST/Services” parcel”.
Geographic Information Services (GIS) – Maps – Cartography
I am an amateur cartographer who designs maps and does a wide variety geospatial analysis using free and open-source geographic information software (GIS) and public sources of data to design quality maps, graphs, charts and datasets. I am looking for new and interesting projects to improve my skills, make connections and expand my portfolio.
Are you looking for my personal blog with it’s hiking, camping and outdoor recreation maps, along with a variety of charts, photos, and stories? Please visit andyarthur.org.
Mapping Avaliable
Tax/Property Mapping
High Resolution Aerial Photography
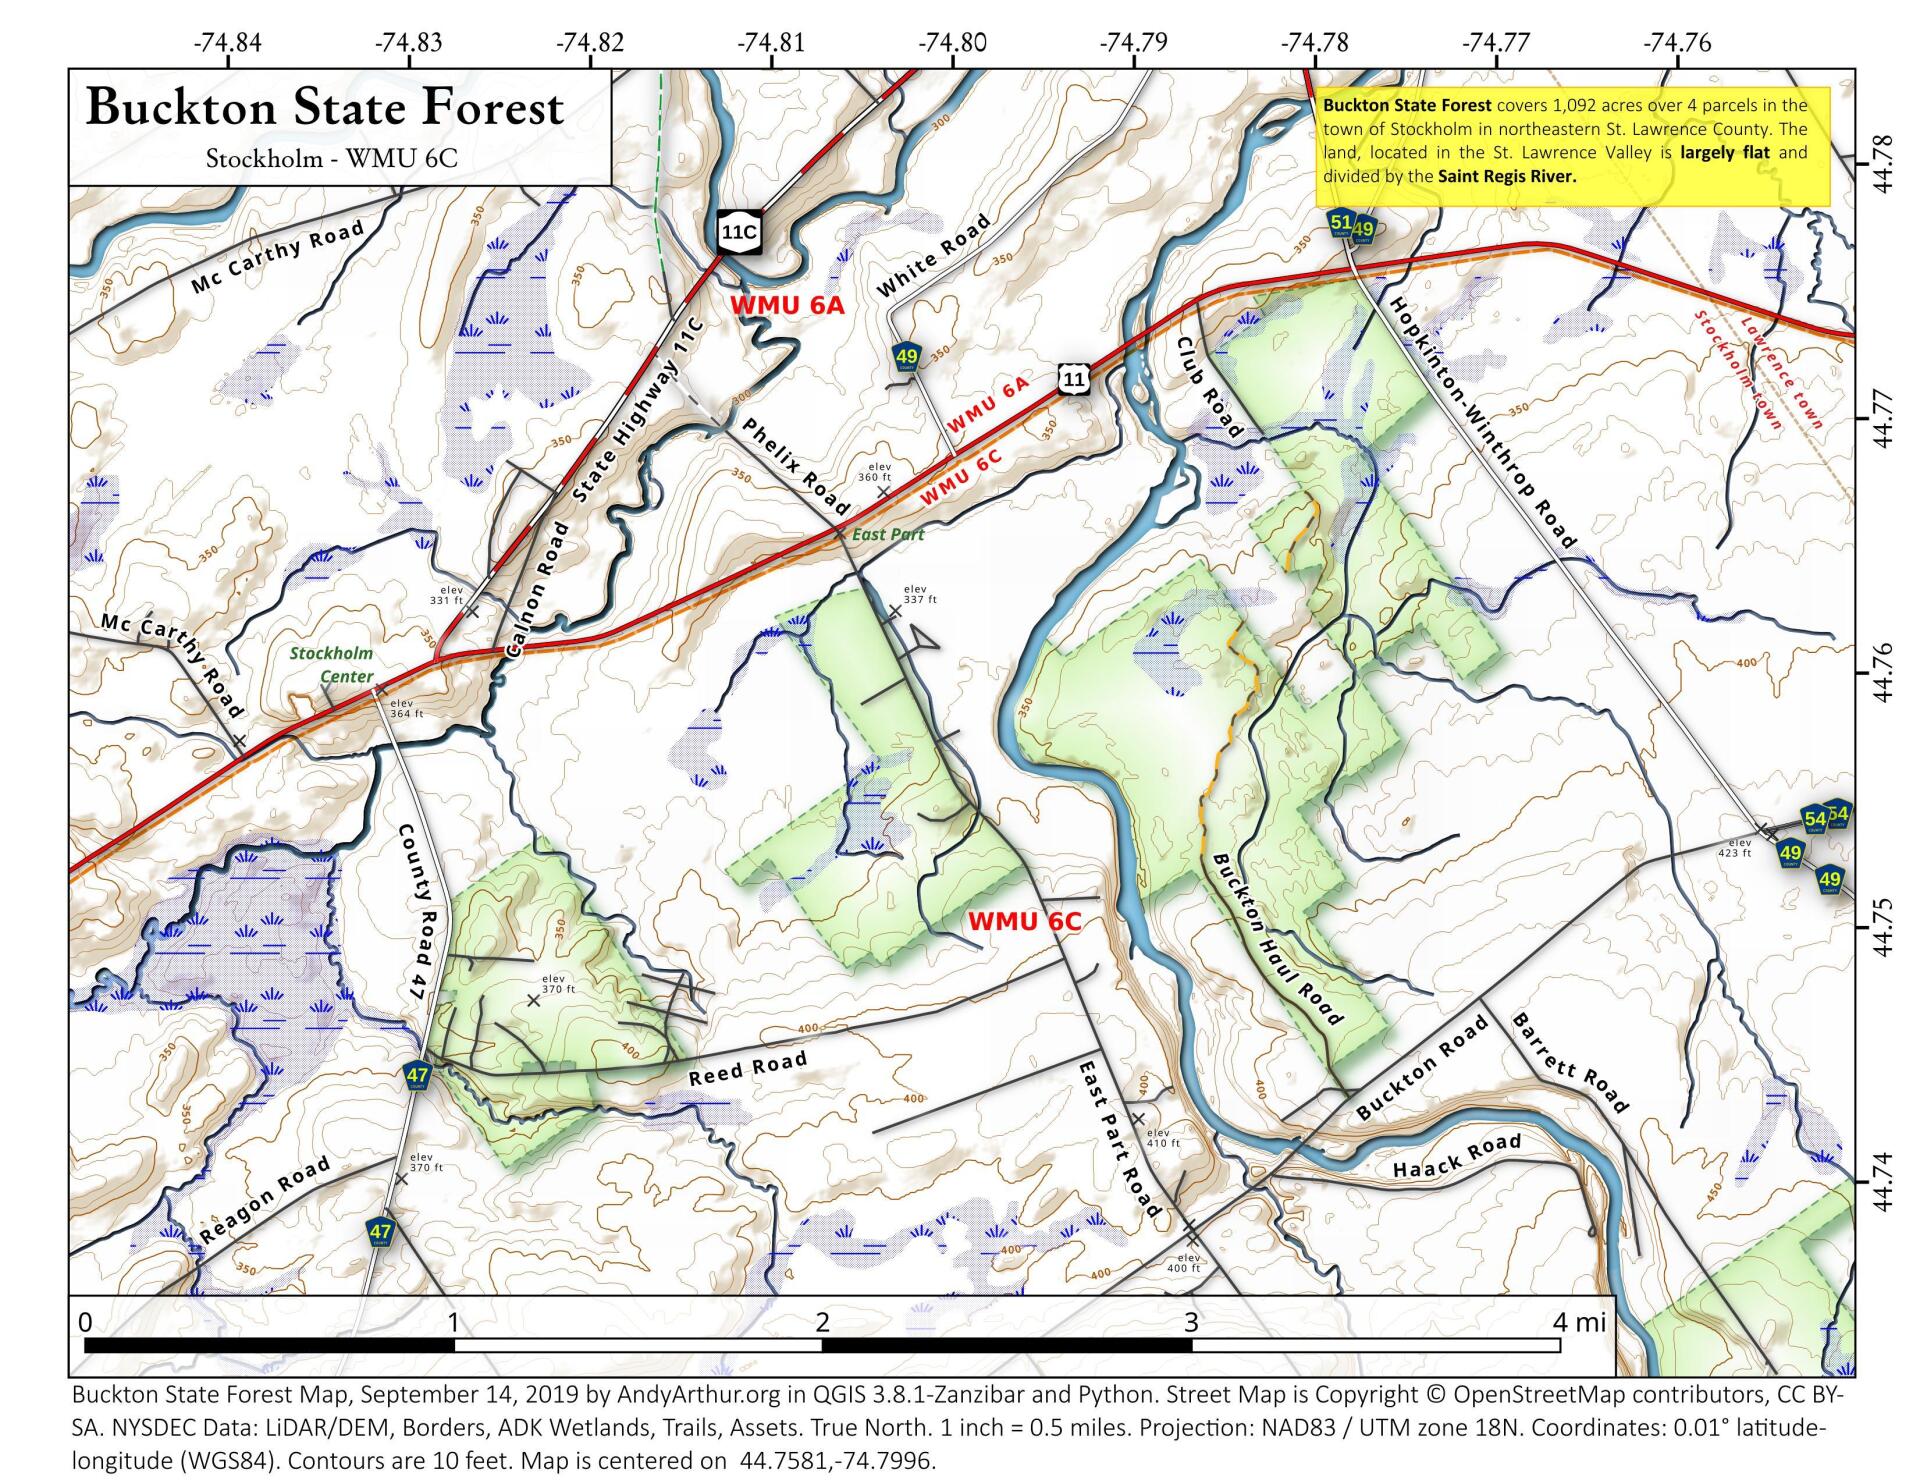
Recreational Maps – Hunting, Camping, Hiking
Georeference addresses using State Address Mapping service, plot them on a map
Wetlands, Topographic Contours, Land Cover
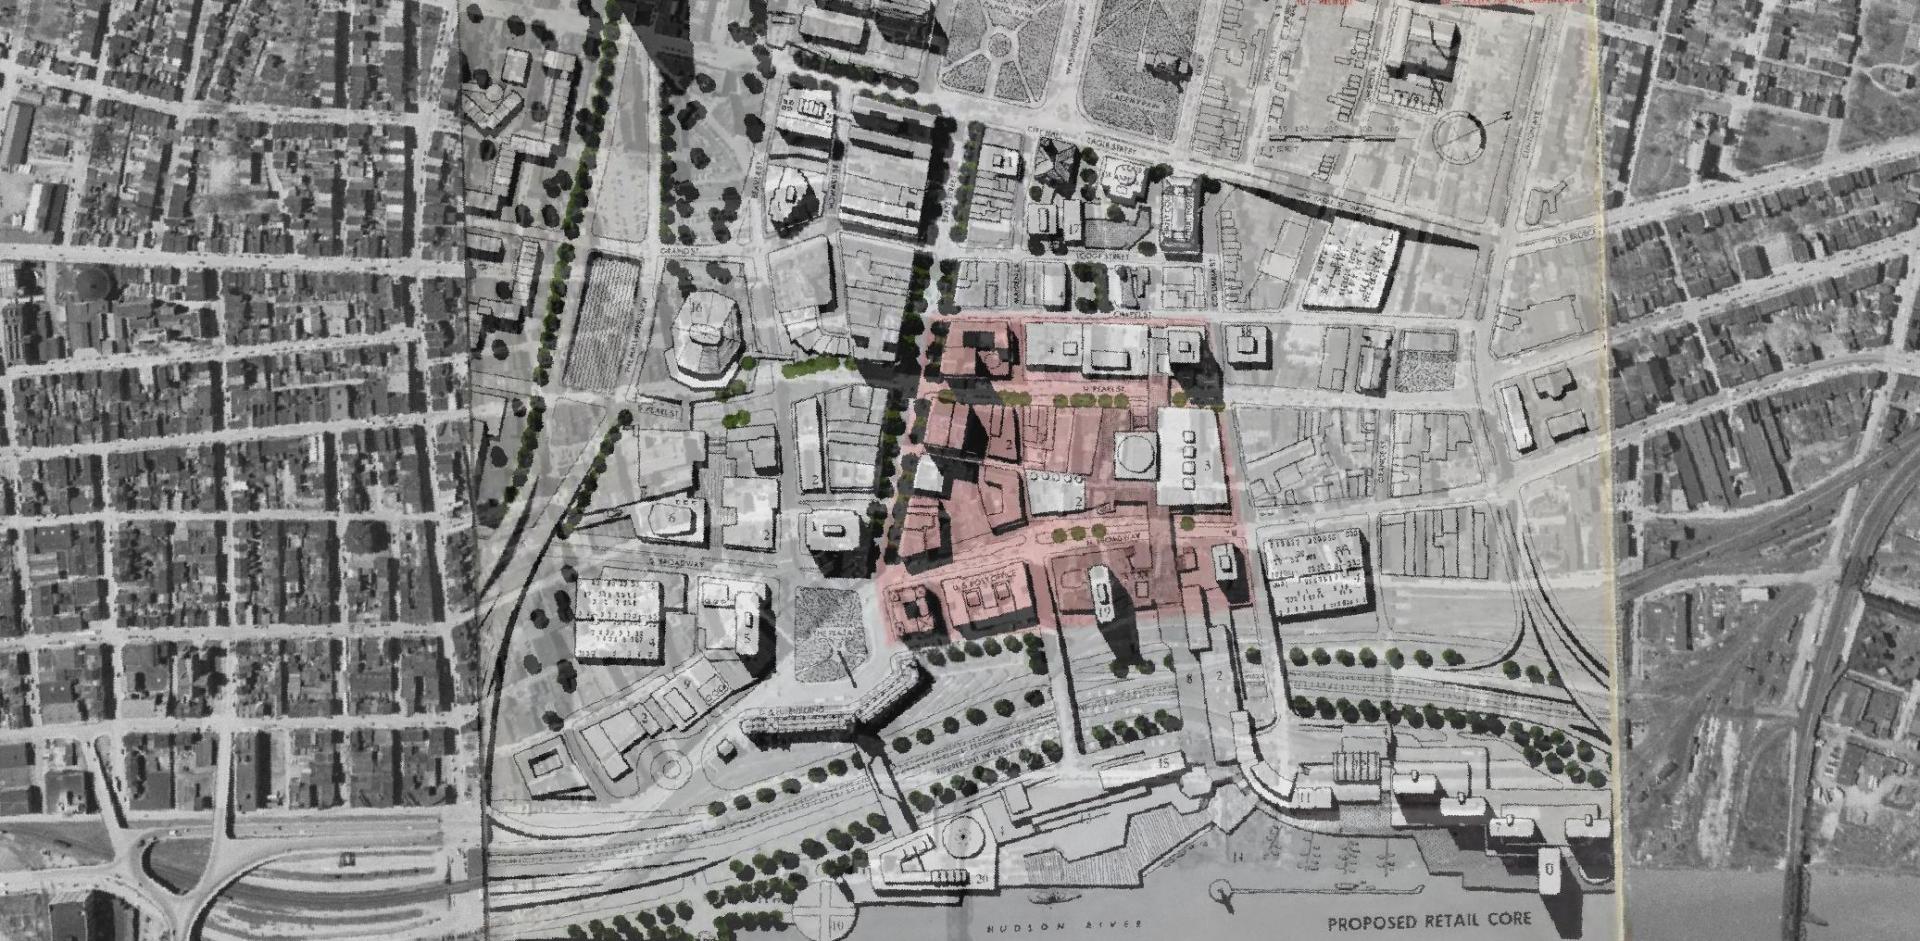
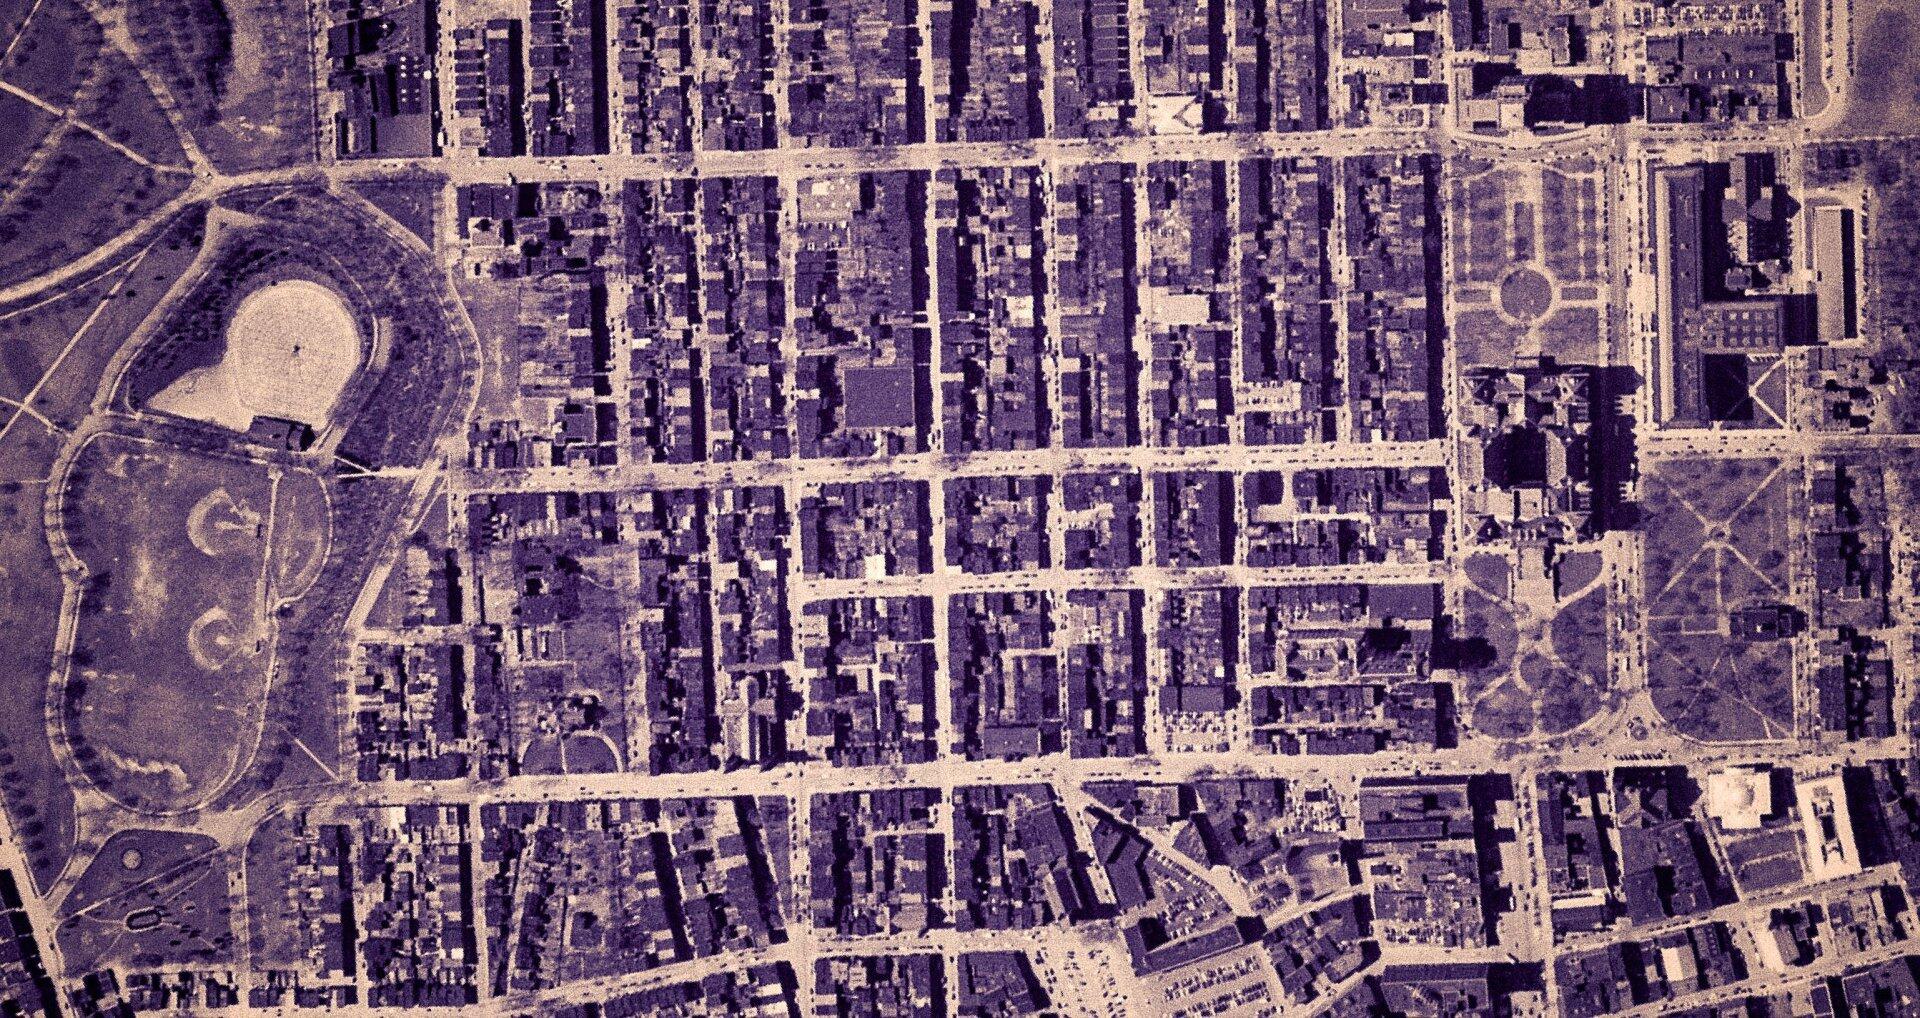
Compare historical aerial photos or maps to current photography
Web mapping using leaflet (HTML/Javascript file to embed on a website or use at home)
For most projects, there is no fee. I am looking for experience, references, mentors and connections in the geospatial community.
If you have a large project, let’s talk about it. I might be willing to do it for free, if it’s something really interesting or important like fighting suburban sprawl and pollution. I don’t a business or taxes set up, so I can’t really charge at this point.
How to get started?
Please send me an email describing the mapping or data project in as much detail as possible.
US Census – 2019 American Community Survey, 2020 US Census
NYS Tax and Assessment Rolls (2020)
NYSDOT Traffic Counts and Road Data
Historical Aerial Photography (primarily 1952, but earlier and later exist)
ArcGIS REST/Services and WMS Services from state and local agencies
LiDAR Elevation Profiles
USGS Topographic Maps, historic and modern – with overlays if requested
Data Repositories like CUGIR, DataNY.gov and NYSGIS
Recreation data from NYSDEC
Software Used
Quantum GIS (QGIS) including 3D Mapping
Geodata Abstraction Library (GDAL, ogr2ogr)
Python, including the data-science libraries PANDAS and GeoPANDAS
LeafletJS Web Mapping Services
Geographies Avaliable
Primary Capital Region and also much of New York State, also some for Pennsylvania, Vermont, West Virginia
State, county, municipal, school districts – Most data sets
Parks, highways, buffer (distance to) – Most data sets
Election districts – Roughly 75% of NYS counties
Census Tract or Blockgroup – 2019 American Community Survey
Tabulation Block – 2020 US Census
Are printed maps avaliable at this time?
Not currently. I can send you a file based on your specifications to print at your local print shop.
How long do mapping projects take?
Depends on complexity of the project. Many projects only take minutes, however if a project requires georeferencing, data cleaning, or custom shapes or layouts, it might take significantly longer. More revisions lead to better quality output.
Do you make maps professionally?
No! This is just a hobby. But I’m interested in expanding my skills. I do a lot of mapping for my blog and in support of community organizations like Save the Pine Bush.
Are my maps of good quality?
Thats for you to decide. I don’t have formal education in map making, and I don’t have professional tools. But do take a look at the work I’ve done below.
Examples of Maps
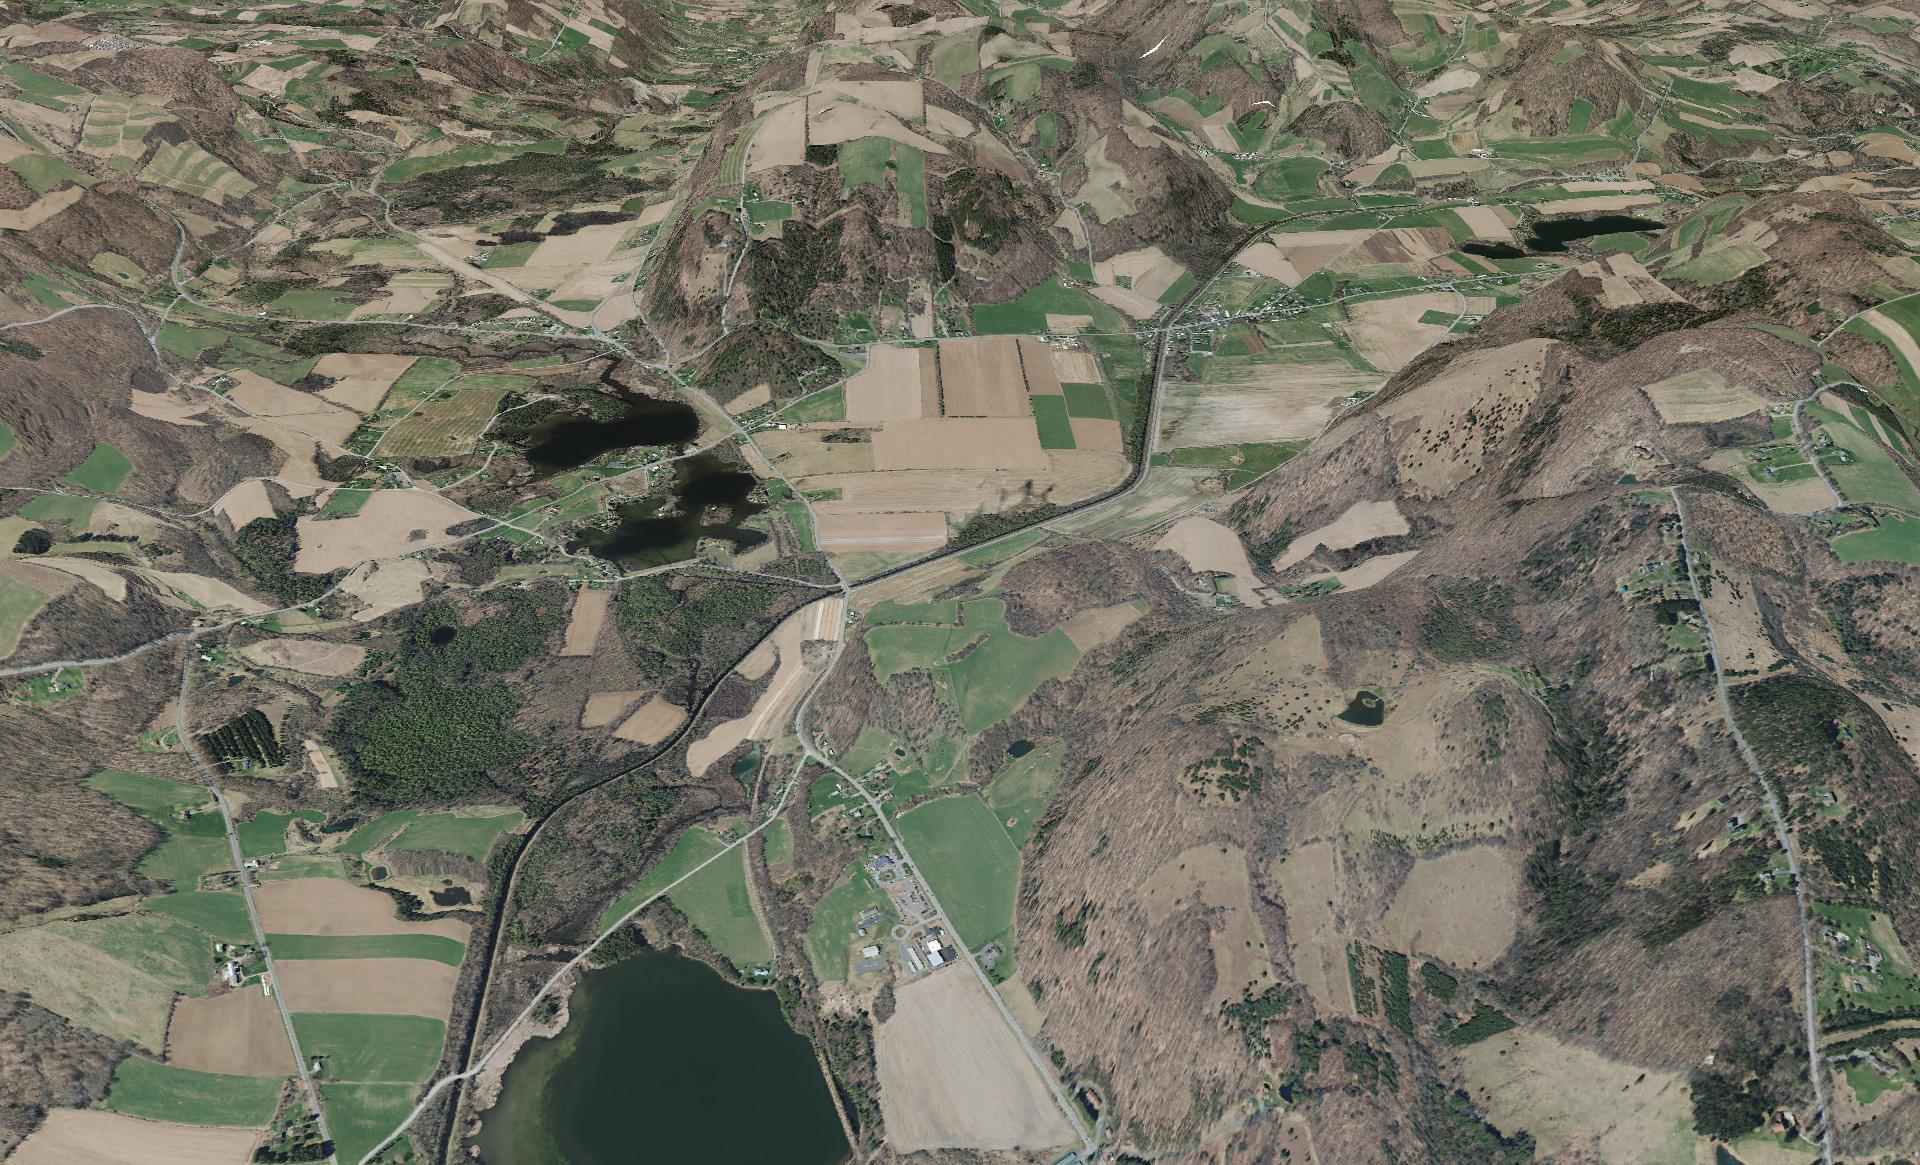
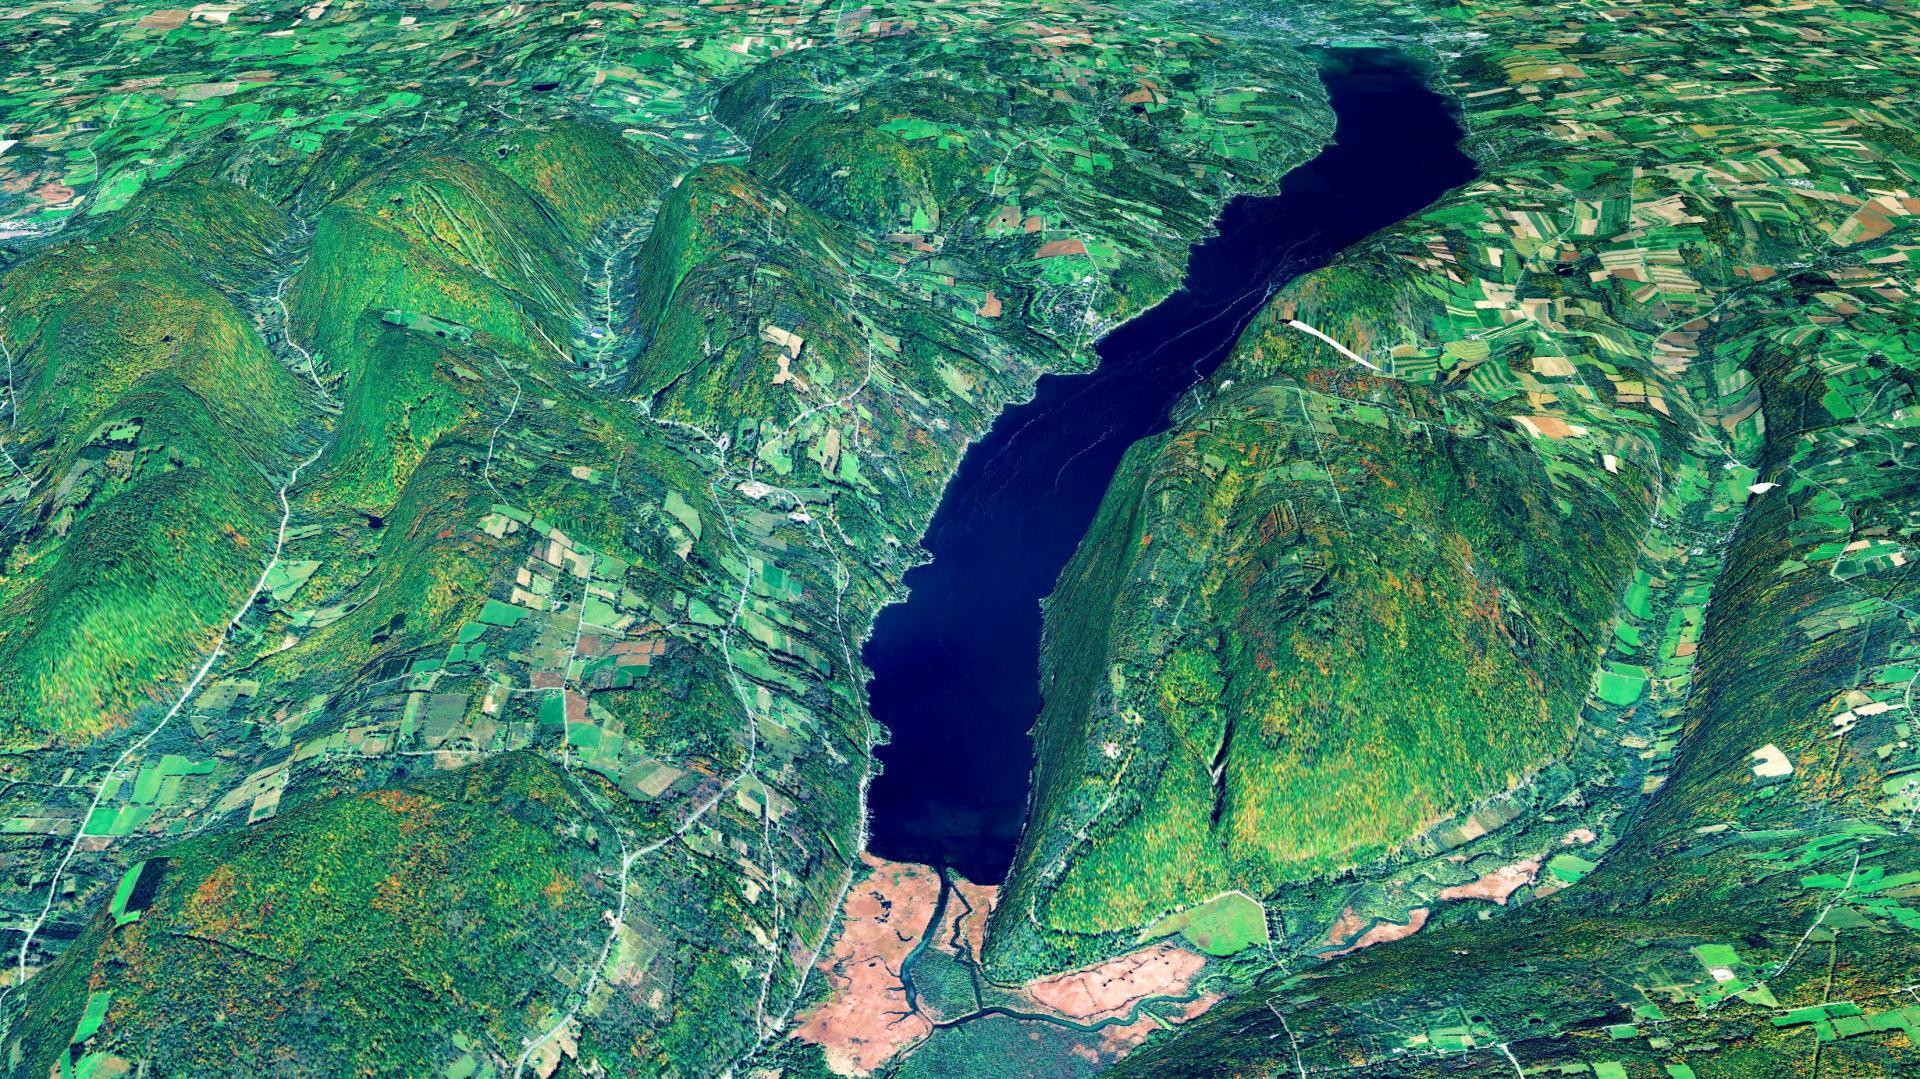
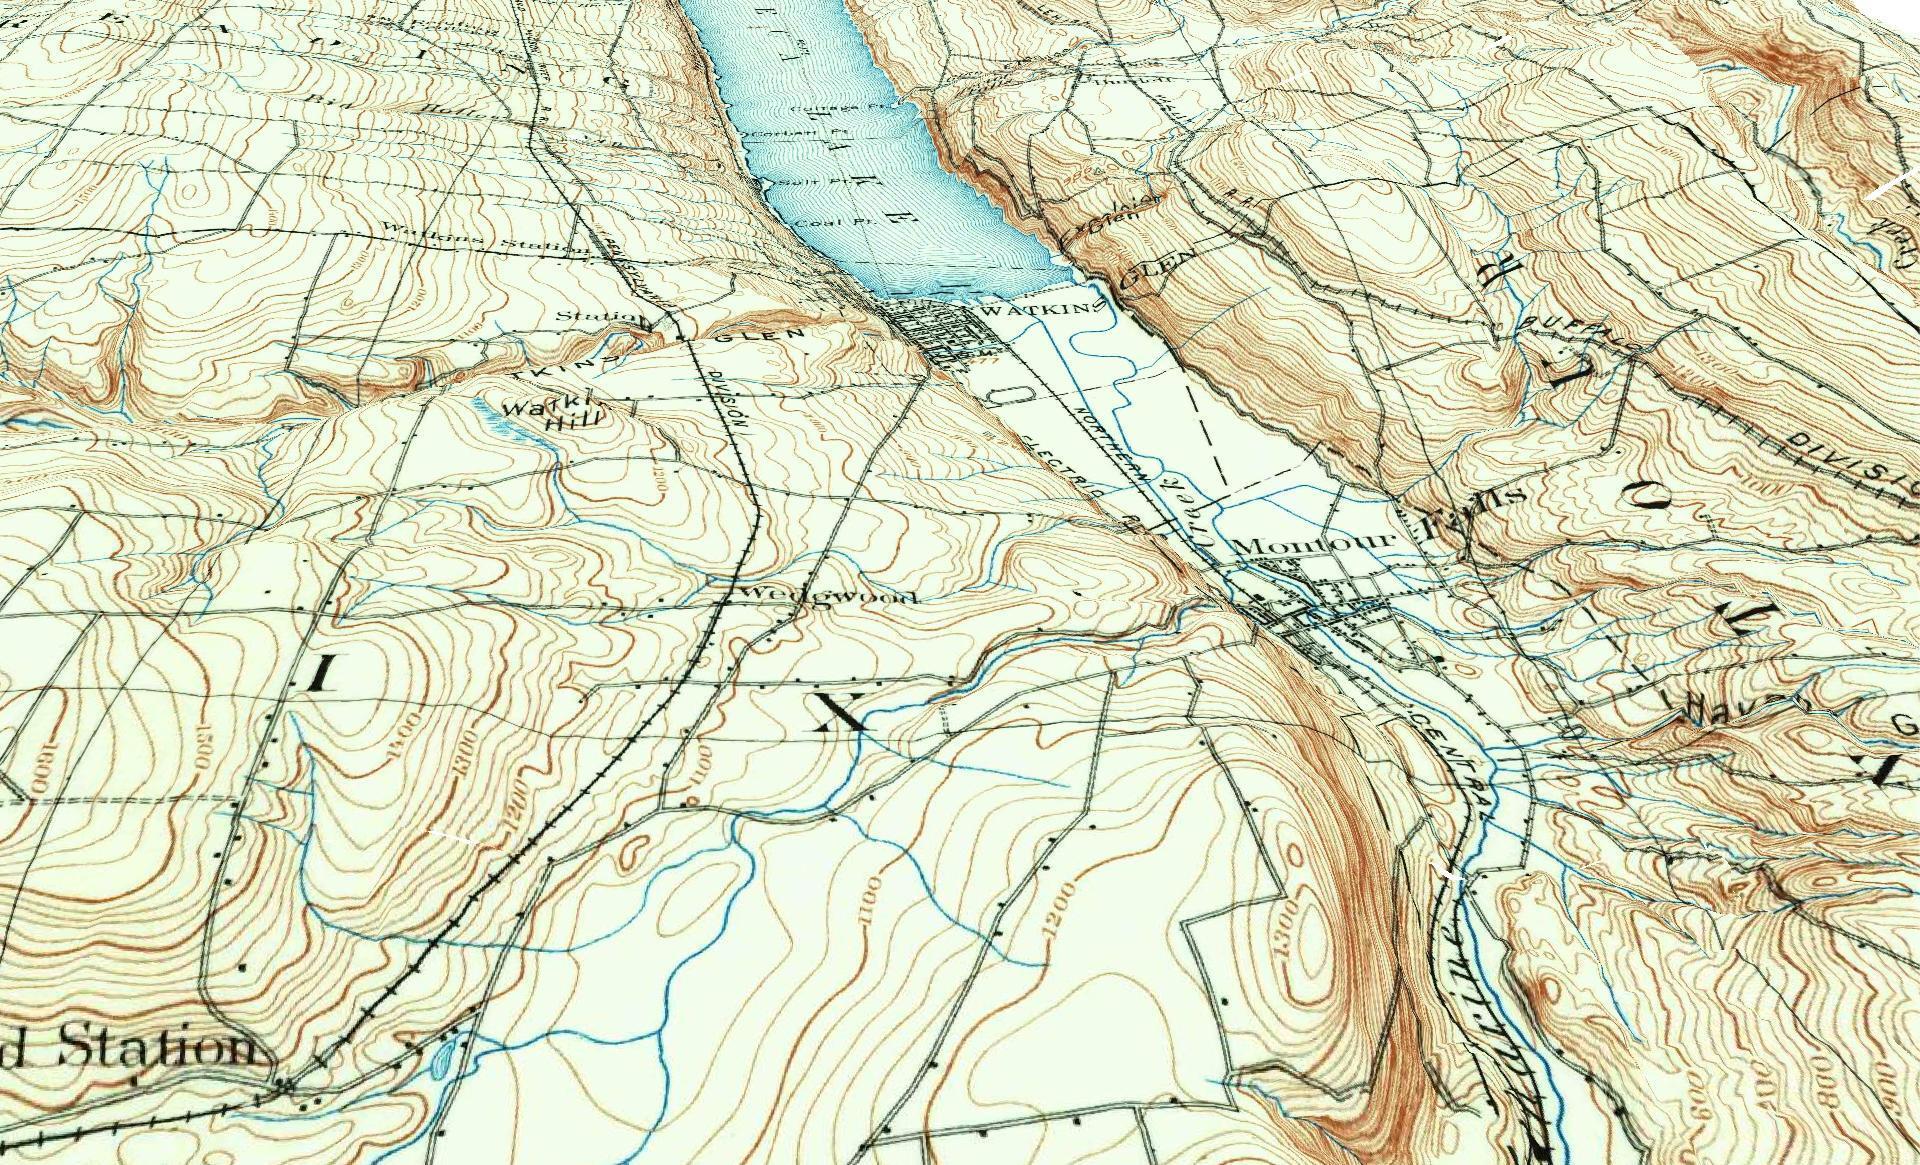
This shows a 3D rendering of the Buckville Canal north of Hamilton
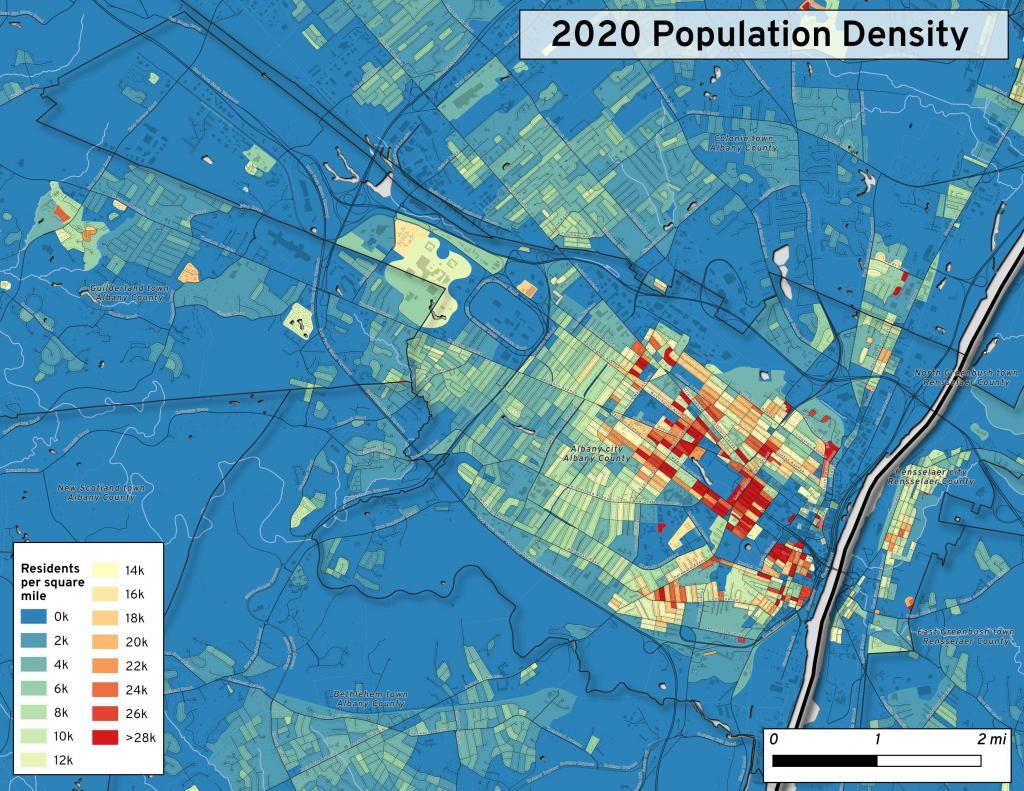
This map shows the use of 2020 PL 94-171 data to calculate population density in City of Albany.
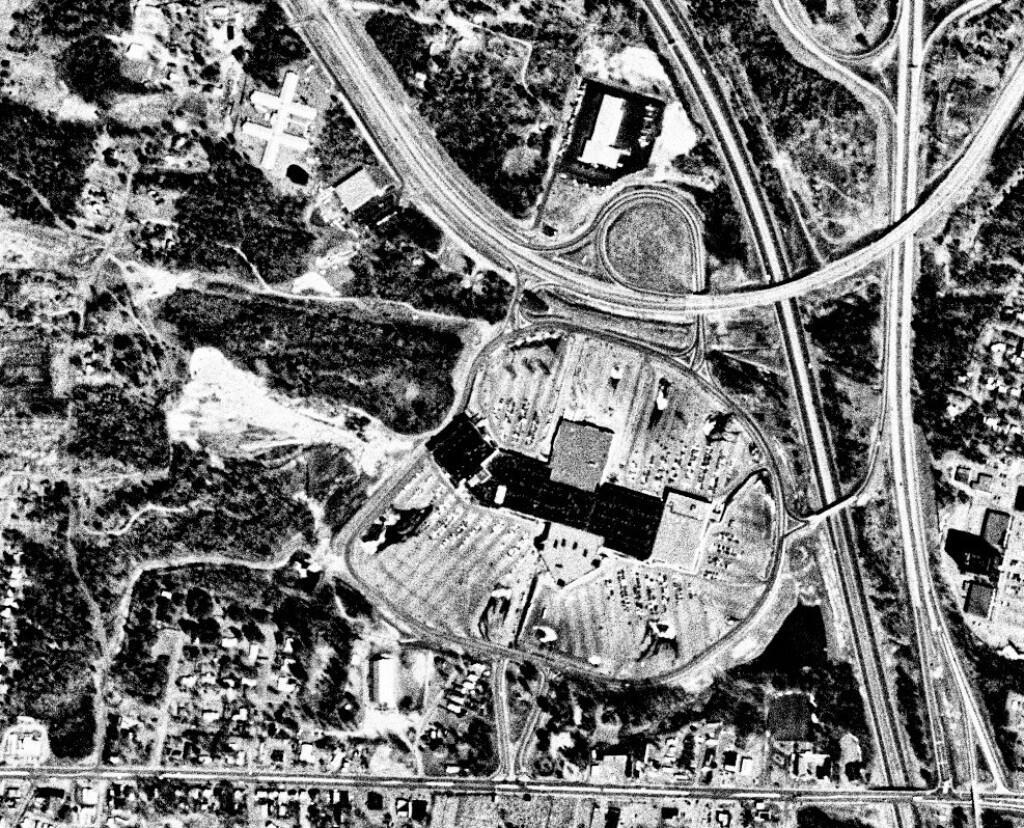
This 1985 aerial photo shows Crossgates Mall prior to it’s expansion.
This GIF image shows the change in unemployment during Coronavirus panademic.
This image shows hiking trails near Brooktrout, Falls Pond and Deep Lake.
Peebles Island, a Comparison 1952
3D Interactive of campsites at Moose River Plains.
import pandas as pd
import geopandas as gpd
# path to overlay shapefile
overlayshp = r'/tmp/dis_to_albany.gpkg'
# summary level -- 750 is tabulation block, 150 is blockgroup
# large areas over about 50 miles much faster to use bg
summaryLevel = 150
#summaryLevel = 750
# path to block or blockgroup file
if summaryLevel == 150:
blockshp = r'/home/andy/Documents/GIS.Data/census.tiger/36_New_York/tl_2020_36_bg20.shp.gpkg'
else:
blockshp = r'/home/andy/Documents/GIS.Data/census.tiger/36_New_York/tl_2020_36_tabblock20.shp.gpkg'
# path to PL 94-171 redistricting geoheader file
pl94171File = '/home/andy/Desktop/nygeo2020.pl'
# field to categorize on (such as Ward -- required!)
catField = 'Name'
# geo header contains 2020 census population in column 90
# per PL 94-171 documentation, low memory chunking disabled
# as it causes issues with the geoid column being mixed types
df=pd.read_csv(pl94171File,delimiter='|',header=None, low_memory=False )
# column 2 is summary level
population=df[(df.iloc[:,2] == summaryLevel)][[9,90]]
# load overlay
overlay = gpd.read_file(overlayshp).to_crs(epsg='3857')
# shapefile of nys 2020 blocks, IMPORTANT (!) mask by output file for speed
blocks = gpd.read_file(blockshp,mask=overlay).to_crs(epsg='3857')
# geoid for linking to shapefile is column 9
joinedBlocks=blocks.set_index('GEOID20').join(population.set_index(9))
# store the size of unbroken blocks
# in case overlay lines break blocks into two
joinedBlocks['area']=joinedBlocks.area
# run union
unionBlocks=gpd.overlay(overlay, joinedBlocks, how='union')
# drop blocks outside of overlay
unionBlocks=unionBlocks.dropna(subset=[catField])
# create population projection when a block crosses
# an overlay line -- avoid double counting -- this isn't perfect
# as we loose a 0.15 percent due to floating point errors
unionBlocks['sublock']=unionBlocks[90]*(unionBlocks.area/unionBlocks['area'])
# sum blocks in category
unionBlocks=pd.DataFrame(unionBlocks.groupby(catField).sum()['sublock'])
# rename columns
unionBlocks=unionBlocks.rename({'sublock': '2020 Census Population'},axis=1)
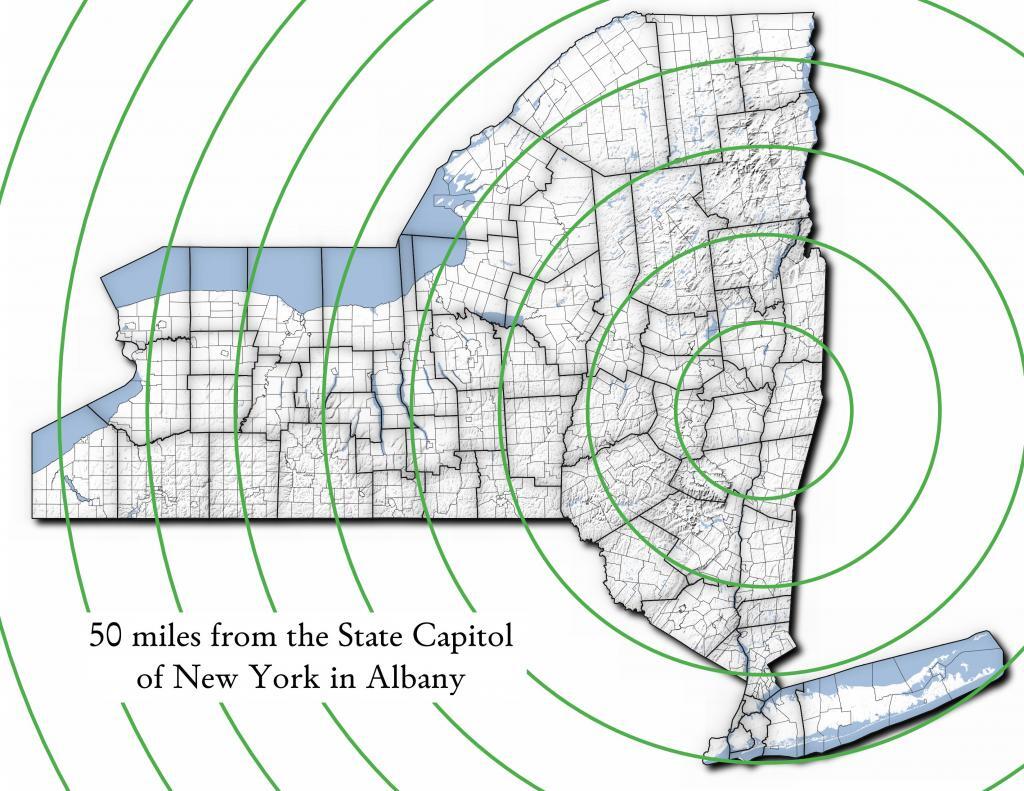
# calculate cumulative sum as you go out each ring
unionBlocks['millions']=unionBlocks.cumsum(axis=0)['2020 Census Population']/1000000
# each ring is 50 miles
unionBlocks['miles']=unionBlocks.index*50
# output
unionBlocks
Land use in town of Berne (from 2016 National Land Cover Dataset)
Most highly assessed properties in Albany County …
I’m a big of farmers who are essentially Living Off the Earth and think Rednecks are Noble Savages. Dairy Farming are key to our rural landscape. I’d trust a farmer or a hunter in a pile of guts he’s butchered over any ivory-tower scientist.
Good evening! Mostly cloudy and 33 degrees in Delmar. Calm wind. Kind of a gloomy but not too cold evening after a rather dark and gloomy day, that got off to such a bad start with the bus running late. But I’m not longer bitter. I promise. I guess they need emission and inspection checks from hardworking individuals to make the state wealthy, so it can spend it on the welfare queens. Steal from the poor, give to welfare queens who always are illegally parked in front of the County Welfare office. At any rate the gloom isn’t expected to last too much into tomorrow. The skies will clear tomorrow around 7 am. But more clouds for Thursday. But I’m getting ahead of myself.
Tonight will be mostly cloudy, with a low of 29 degrees at 5am. Three degrees below normal. Cool but not that cold. Calm wind. In 2016, we had cloudy skies. It got down to 34 degrees. Closer to normal. The record low of 14 occurred back in 1939.
Tonight will have a Waning Crescent Moon with 10% illuminated. The moon will rise tomorrow at 3:40 am. It may be clearing by then, so you might see if you get up way before I will be getting up. The New Moon is on Friday night with a chance of rain then rain is likely. The Cold Moon is on Sunday, December 3rd. The sun will rise at 6:46 am with the first light at 6:16 am, which is one minute and 15 seconds later than yesterday. Tonight will have 14 hours and 15 minutes of darkness, an increase of 2 minutes and 10 seconds over last night.
Tomorrow will be mostly sunny, with a high of 45 degrees at 1pm. Yeah, the sun at least for one day. But still three degrees below normal. Calm wind becoming south 5 to 8 mph in the afternoon. A year ago, we had sunny skies with more clouds in the afternoon. The high last year was 46 degrees. The record high of 74 was set in 1993. 4.8 inches of snow fell back in 1906. Long time ago.
Not a particularly nice weekend on tap, even by November standards. Saturday, snow showers likely before 10am, then rain showers. High near 44. Chance of precipitation is 80%. I heard freezing rain up north. Sunday, a chance of showers. Partly sunny, with a high near 43. Chance of precipitation is 30%. Typical average high for the weekend is 47 degrees.
I still think I will take Friday off, if I can get it off. I got the square nuts to build the rack for my solar panel. Now I just need to find bolts that will fit snuggly, cut and drill the aluminum bars that I will buy. Maybe I will do that on Friday. I will have to see if my parents will be around, as I may want to ask my dad if I can borrow his drill. I have diamond-blades for cutting into the aluminum but lack a power drill of my own. Maybe I should think though about adding that tool to my bin. But first I have to carefully measure everything out so I don’t accidentially mess up a hole and things don’t fit tight.
But I’m staying in town for the weekend, because I don’t want to deal with freezing rain up north. I’m not ready to be out washing the road salt of my truck, moreover, I don’t want to get frozen in the truck cap, or have to deal with the extra patrols for the opening of the Southern Zone regular season, even if I will be in the Northern Zone. I’m still hoping to get away on Black Friday through that Sunday though.
Traffic was pretty heavy coming home on the bus tonight, and I was pretty cheesed out on Facebook about those stupid huts they want to build in the Adirondack Preserve, and charge people big bucks to stay at. Public lands belong to the public, they should be free to use. Pay for public lands by selling timber, hay, and grazing rights. Some oil and gas development. Keep the facilities rustic and manage resource extraction so it pays for public use of the land without compromising it. I don’t get the environmentalists who don’t use office or toilet paper. Or those who want even higher fees to use public lands that should be free for a wide variety of rustic uses. Multiple use can benefit all New Yorkers, we don’t have live under the extreme idea that not a single tree may ever be fallen inside the blue lines of the Adirondack or Catskill Parks. But unfortunately, Manhattan and surrounding areas where all the people live don’t understand that natural resources can be managed for sustainable harvests for generations to come.
I put together a map of the relative state tax rates, but unfortunately the Google Maps export got messed up, so it won’t be posted until later in the week. It also sucks because the US Census Data on State Taxes doesn’t include local taxes, which actually makes New York look lowered taxed then it really is. New York has high state taxes, but when you add in local taxes, we have some of the highest taxes of all. Most states don’t rely on localities to tax as high as New York does, especially with the big Medicaid mandate that pushed down to counties.
I continue to work on my light dimmer program. Been researching color theory and things along the line of HSV to RGB conversions, along with color temperature algorthms, as I want to be able to have very percise flexibillity in getting just the right light for my bedroom. Also rewrote a timer algorithm that is non-blocking of the central loop, so I can use the remote to adjust lighting settings while a ongoing mode is occuring in my program. I can’t wait until my RGB LED strip arrives, along with the transitors and power supply so I can start playing with a real-life demostration.
Also been looking at the different methods of building circuits boards for permanent use — perf board versus strip board — various soldering irons versus kryon twist wiring. And all the stuff that goes along with soldering like choosing between lead and lead-free solder, solder wicks, etc. I have a solder gun and certainly have wired bigger things but I need to be more percise for soldering electronics. While I still hunt and shoot with leaded ammunition, and l’m not concerned about lead fumes when soldering as my other electrical solder is leaded and lead portion doesn’t melt or vaporize while solder typically, I think I’m going to go lead free for future electronic projects. That’s the future, and it makes the net result less toxic where it gets disposed of in a fire eventually or properly recycled at an e-waste event. I am planning to move out to country and live off gird after all eventually. And I hear a lot of fire is involved with that kind of life. Hopefully though I will get a lot of use out of the projects I end up building and will be able to salvage components from them at the end of their lives. I might eventually even switch to lead-free ammunition for hunting and target practice, but that’s a whole another ball of wax because traditional ammunition is a lot cheaper, you use a lot more of it, and it’s a lot easier on your barrel. Solder in contrast is pretty small cost, as even if my electronics hobby picks up and I make a lot of solder bridges on perf board, it’s still only an occassional use. Lead poisioning of Bald Eagles and other raptors is tragic, but as species, it really isn’t a threat to them like DDT once was. Lead shot to humans might break teeth if your not careful, but I doubt you ever swallow it or get enough fragments to do any harm as an adult. I get to get out to range to do some shooting or somewhere in the back country where I have a safe backstop sometime soon. I do pick up my shotgun shells and spent brass as much as possible.
Back to electronics. I also found a local supplier of Arduino Uno cards for a good price in Newburgh on Ebay. Something like $7 each with free one or two day shipping. I should also look at EBay. I don’t have an Ebay prime account but my parents do. Once my LED driver is done, I will want future units for future projects. I calculated that the Arduino run on a 12 volt power supply consumes about a 1/4 watt an hour or 1.9 kWh a year, so it’s pretty reasonable. I expect the LED dimmer to always be powered up so to turn the lights by remote when ever I need them except when I’m out of the town for the weekend or on vacation or traveling for work.
I was also reading about the Raspberry PI. That’s a miniature full-blown computer compared to the Ardiuno which just a fairly basic microprocessor for driving simple electronics. The Raspberry Pi can drive LEDs at different but it really over kill for that, and at $35 is much more expensive. The base model of the Raspberry Pi uses 3.5 watts, which is nothing for a minature computer on a chip board, and has wireless internet, monitor and takes USB disk port, and runs Linux including a LXDE window manager. I could see the Raspberry Pi as a home computer in an off-grid home, as a much more efficent alternative to using my laptop with a 12 volt power supply. My laptop is fairly energy efficent, but when it’s charging, it can use upwards of 90 watts which is a lot of electricity, when your trying to make every watt count on a battery powered setup.
I don’t envision ever owning a television or home internet. My smartphone provides plenty of internet access, if I need high speed internet access like for uploading photos or video, there are always public hotspots in town that I can stop at local libraries and the alike. I had that TV tuner for a while before it stopped working, but I almost never used it except for occassionally watching the PBS Newshour. But I quit watching that, as I found it was just such a time waste. I really am not a fan of all that technology.
In four weeks on December 12 the sun will be setting at 4:21 pm, which is 10 minutes and 46 seconds earlier then tonight. The fact is the sunsets don’t get much earlier then they are now, especially on a gray and depressing days like today. In 2016 on that day, we had rain, snow, freezing fog, mist, cloudy skies and temperatures between 40 and 28 degrees. Typically, you have temperatures between 37 and 23 degrees. The record high of 62 degrees was set back in 1979.
Looking ahead, Election Day 2018 is in 51 weeks and Election Day 2020 is in 155 weeks. That’s pretty much all you do on Tuesdays is vote. That said, I need to start adding some of the 2018 calendar and special dates to holiday.txt file that powers that automagic date count down thingy-ma-bobber.
 /
/ 


 by State Lands or County. You can


 Bicycle Trails and “Blackie” My Mountain Bike


 Learn
Learn 


 Property


 Python and Pandas


 Politics

 The Earth


 Saving Money


 Mission Fifty, Smoking Grass & Being Healthier


 / Enjoying Life


