Bird watching
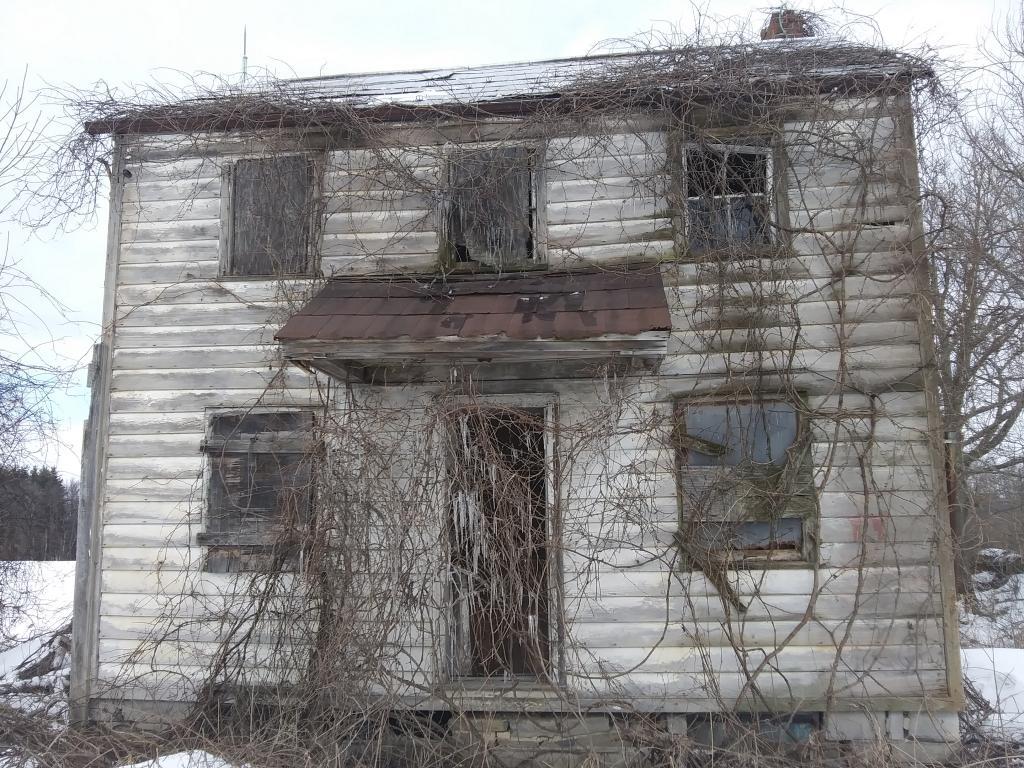
That old house on Meads Lane
Great Appalachian Storm of 1950 – Wikipedia
The Great Appalachian Storm of November 1950 was a large extratropical cyclone which moved through the Eastern United States, causing significant winds, heavy rainfall east of the Appalachian Mountains, and blizzard conditions along the western slopes of the mountains. Hurricane-force winds, peaking at 110 miles per hour (180 km/h) in Concord, New Hampshire, and 160 miles per hour (260 km/h) in the highlands of New England, disrupted power to 1 million customers during the event.In all, the storm impacted 22 states, killing 383 people, injuring over 160, and causing $66.7 million in damage (equivalent to $709,000,000 in 2019). U.S. insurance companies paid out more money to their policy holders for damage resulting from the cyclone than for any previous storm or hurricane at the time. The cyclone is also one of only twenty-six storms to rank as a Category 5 on the Regional Snowfall Index.Sustained winds of 50–60 mph (80–100 km/h) with gusts to 83 miles per hour (134 km/h) were recorded at Albany, New York. A wind gust of 94 miles per hour (151 km/h) was recorded in New York City. Extensive damage was caused by the wind across New York, including massive tree fall and power outages. Coastal flooding breached dikes at LaGuardia Airport, flooding the runways. Flooding extended to New York City's Office of Emergency Management on the Lower East Side, in Manhattan.
List of New York hurricanes – Wikipedia
During Hurricane Hazel in 1954, a wind speed of 113 mph was recorded at Battery Park, NY City. Among many other crazy stories of weather that has hit New York.
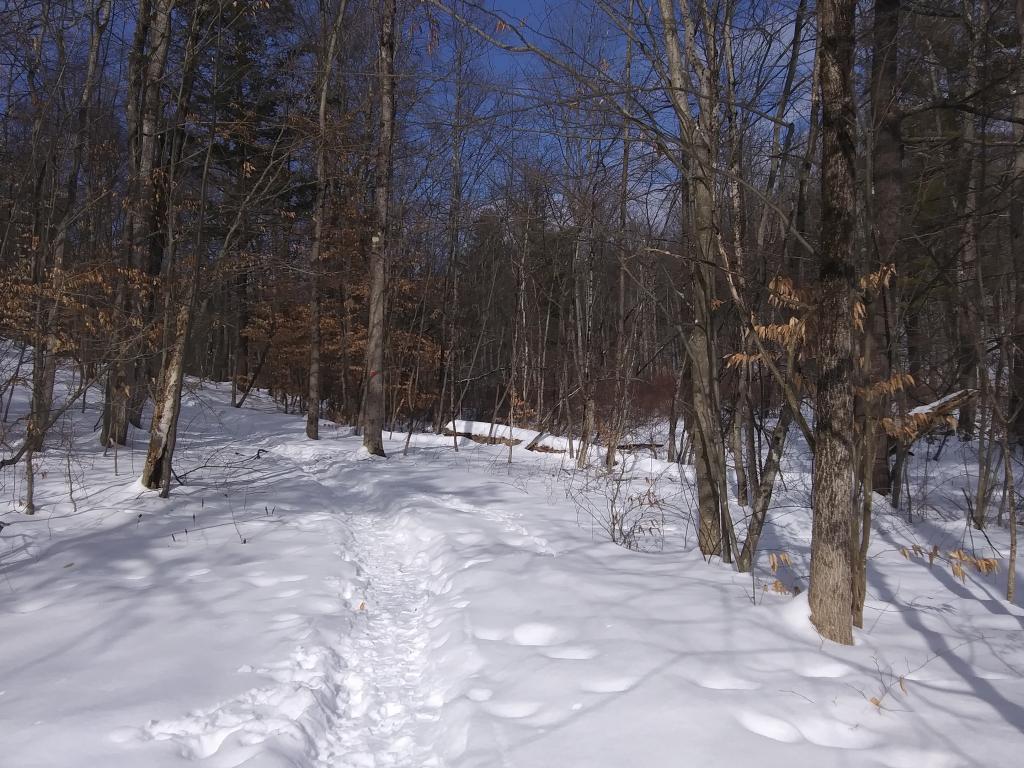
It was a nice walk out to Five Rivers and Van Dyke Preserve
It was a nice walk out to Five Rivers and Van Dyke Preserve. While maybe I could have taken a drive to somewhere exotic, I can prefer just walking and enjoying the scenery. Granted, it’s gotten a little repetitive doing the past same thing the last few Saturdays, but it’s a way to get some fresh air without spending any money or burning any gas.
How Hillshade works—Help | ArcGIS for Desktop
The Hillshade tool obtains the hypothetical illumination of a surface by determining illumination values for each cell in a raster. It does this by setting a position for a hypothetical light source and calculating the illumination values of each cell in relation to neighboring cells. It can greatly enhance the visualization of a surface for analysis or graphical display, especially when using transparency.
By default, shadow and light are shades of gray associated with integers from 0 to 255 (increasing from black to white).


