Search Results for: berlin state forest

USGS Topographic Maps – Madison to Otsego Counties

Counties: Albany to Delaware / Dutchess to Livingston / Madison to Otsego / Putnam to Suffolk / Sullivan to Yates

Browse Topographic Maps: Full State / Historical USGS Topographic Maps

Madison County

PDF (50-60 MB Download) Historical USGS Topo Maps State Lands (Links to DEC Website) Towns (Percent of Town’s Area)
Current Brookfield GeoPDF Map
1943 Map No. 123110, 1943 Map No. 123111 Mount Hunger State Forest, Gorton Lake State Forest, Charles E. Baker State Forest, Brookfield Railroad State Forest, Beaver Creek State Forest Bridgewater (4%), Brookfield (63%), Edmeston (6%), Plainfield (0%), Sangerfield (5%)
Current Canastota GeoPDF Map
1957 Map No. 122776, 1957 Map No. 122777, 1957 Map No. 137151 NA Cazenovia (1%), Fenner (8%), Lenox (36%), Lincoln (38%), Sullivan (40%)
Current Cazenovia GeoPDF Map
1943 Map No. 122876, 1943 Map No. 122877, 1943 Map No. 122878, 1943 Map No. 137162 Chittenango Creek Fishing Access, Stoney Pond State Forest, Nelson Swamp Unique Area Cazenovia (41%), Fenner (65%), Nelson (29%)
Current Cleveland GeoPDF Map
1941 Map No. 137657, 1941 Map No. 137658, 1957 Map No. 137662, 1957 Map No. 137663, 1973 Map No. 137178, 1973 Map No. 137664, 1973 Map No. 137665 Training Academy, Unclassifed, Oneida Lake Boat Launch, Cicero Swamp WMA, Oneida Fish Hatchery Cicero (11%), Constantia (34%), Sullivan (19%), Vienna (1%)
Current Cuyler GeoPDF Map
1943 Map No. 137763, 1943 Map No. 137850, 1943 Map No. 137853, 1943 Map No. 137854 East Branch Tioughnioga River Fishing Access, Cuyler Hill State Forest, Dog Hollow State Forest, Maxon Creek State Forest, Taylor Valley State Forest, Morgan Hill State Forest, Mariposa State Forest Cuyler (66%), DeRuyter (5%), Lincklaen (13%), Pitcher (1%), Solon (7%), Taylor (31%), Truxton (21%)
Current Deruyter GeoPDF Map
1943 Map No. 137206 Morgan Hill State Forest, Deruyter State Forest, Fabius Brook Fishing Access Cazenovia (8%), Cuyler (33%), DeRuyter (18%), Fabius (55%), Pompey (8%)
Current Earlville GeoPDF Map
1943 Map No. 137989, 1943 Map No. 137990 Sherburne Sub-Office, Rogers Environmental Education Center, Pigeon Hill State Forest, Lebanon State Forest, Earlville State Forest Hamilton (4%), Lebanon (7%), North Norwich (14%), Plymouth (14%), Sherburne (37%), Smyrna (57%)
Current Erieville GeoPDF Map
1943 Map No. 138236, 1943 Map No. 138237 Three Springs State Forest, Muller Hill State Forest, Morrow Mountain State Forest, Deruyter State Forest, Tioughnioga WMA Cazenovia (20%), DeRuyter (59%), Georgetown (38%), Nelson (24%)
Current Hamilton GeoPDF Map
1943 Map No. 129672, 1943 Map No. 129673, 1943 Map No. 137238 Chenango River Fishing Access, Earlville State Forest, Lebanon Reservoir Fishing Access, Madison Reservoir Fishing Access Eaton (21%), Hamilton (41%), Lebanon (46%), Madison (21%)
Current Hubbardsville GeoPDF Map
1943 Map No. 129928, 1943 Map No. 129929 Gorton Lake State Forest, Charles E. Baker State Forest Brookfield (30%), Hamilton (51%), Madison (20%), Sangerfield (7%)
Current Jewell GeoPDF Map
1941 Map No. 129994, 1957 Map No. 130091, 1957 Map No. 130092, 1957 Map No. 137285 Stone Barn State Forest, Oneida Lake At Jewell Fishing Access Constantia (0%), Lenox (23%), Sullivan (9%), Vienna (41%)
Current Manlius GeoPDF Map
1957 Map No. 130446, 1957 Map No. 130447, 1973 Map No. 130448, 1973 Map No. 137429, 1973 Map No. 137430, 1973 Map No. 137431 Cicero Swamp WMA, Limestone Creek Fishing Access Cazenovia (2%), Cicero (2%), Manlius (59%), Sullivan (32%)
Current Morrisville GeoPDF Map
1943 Map No. 130686, 1943 Map No. 130687 Stoney Pond State Forest Eaton (30%), Fenner (24%), Nelson (25%), Smithfield (91%), Stockbridge (1%)
Current Munnsville GeoPDF Map
1943 Map No. 130731, 1943 Map No. 130732 Chenango River Fishing Access, Leland Pond Fishing Access Augusta (39%), Eaton (26%), Madison (31%), Smithfield (0%), Stockbridge (60%)
Current New Berlin North GeoPDF Map
NA Charles E. Baker State Forest Brookfield (3%), Columbus (56%), Edmeston (43%), New Berlin (8%), Pittsfield (23%)
Current Oneida GeoPDF Map
1947 Map No. 128908, 1955 Map No. 128909, 1955 Map No. 128910, 1955 Map No. 128911, 1955 Map No. 137484 NA Fenner (3%), Lenox (28%), Lincoln (62%), Oneida city (84%), Smithfield (9%), Stockbridge (9%), Vernon (3%), Verona (5%)
Current Oran GeoPDF Map
1942 Map No. 128929, 1943 Map No. 128930, 1973 Map No. 128933, 1973 Map No. 137488 Chittenango Creek Fishing Access, Limestone Creek Fishing Access Parking, Limestone Creek Fishing Access Cazenovia (27%), Manlius (8%), Pompey (55%)
Current Oriskany Falls GeoPDF Map
1943 Map No. 135895, 1943 Map No. 135896, 1943 Map No. 137490, 1944 Map No. 135898 NA Augusta (36%), Kirkland (1%), Madison (29%), Marshall (57%), Sangerfield (44%)
Current Otselic GeoPDF Map
1943 Map No. 135937, 1943 Map No. 135940, 1943 Map No. 136760 Texas Hill State Forest, Pigeon Hill State Forest, Perkins Pond State Forest, Otselic State Forest, Muller Hill State Forest, Lebanon State Forest, Beaver Meadow State Forest, Pharsalia WMA Georgetown (10%), Lebanon (7%), Otselic (58%), Pharsalia (11%), Plymouth (8%), Smyrna (43%)
Current Sherburne GeoPDF Map
1943 Map No. 136155, 1943 Map No. 136156, 1943 Map No. 136914, 1943 Map No. 136915 Skinner Hill State Forest, Pine Ridge State Forest, Charles E. Baker State Forest Brookfield (3%), Columbus (44%), Hamilton (4%), New Berlin (7%), North Norwich (14%), Sherburne (63%)
Current South Otselic GeoPDF Map
1943 Map No. 136928 Perkins Pond State Forest, Otselic State Forest, Muller Hill State Forest, Mariposa State Forest, Lincklaen State Forest, Bucks Brook State Forest, South Otselic Fish Hatchery DeRuyter (19%), Georgetown (10%), Lincklaen (87%), Otselic (42%), Pharsalia (6%), Pitcher (14%)
Current Sylvan Beach GeoPDF Map
1947 Map No. 139931, 1955 Map No. 136943, 1955 Map No. 139933, 1955 Map No. 139934, 1955 Map No. 139935 NA Lenox (13%), Oneida city (4%), Rome city (5%), Verona (39%), Vienna (19%)
Current Unadilla Forks GeoPDF Map
1943 Map No. 139435, 1943 Map No. 139436 Plainfield State Forest, Basswood Pond State Forest Bridgewater (0%), Brookfield (1%), Burlington (18%), Edmeston (16%), Exeter (15%), Plainfield (97%), Richfield (2%), Winfield (19%)
Current Vernon GeoPDF Map
1955 Map No. 139488, 1955 Map No. 139489 NA Augusta (13%), Oneida city (12%), Stockbridge (30%), Vernon (73%), Verona (13%), Westmoreland (0%)
Current West Eaton GeoPDF Map
1943 Map No. 140153, 1943 Map No. 140154 Texas Hill State Forest, Morrow Mountain State Forest, Lebanon State Forest, Eaton Reservoir Boat Launch Eaton (23%), Georgetown (42%), Lebanon (41%), Nelson (22%)

Monroe County

PDF (50-60 MB Download) Historical USGS Topo Maps State Lands (Links to DEC Website) Towns (Percent of Town’s Area)
Current Braddock Heights GeoPDF Map
1934 Map No. 123371, 1934 Map No. 123372, 1934 Map No. 123373, 1952 Map No. 123374, 1952 Map No. 123375, 1952 Map No. 123376, 1952 Map No. 123377, 1971 Map No. 123378, 1971 Map No. 123379 Slater Creek Waterway Access, Braddock Bay WMA Greece (45%), Parma (0%)
Current Brockport GeoPDF Map
1934 Map No. 123100, 1952 Map No. 123101, 1952 Map No. 123102, 1952 Map No. 123103, 1971 Map No. 123104, 1971 Map No. 123106 NA Bergen (9%), Clarendon (2%), Clarkson (38%), Murray (1%), Ogden (11%), Riga (1%), Sweden (99%)
Current Caledonia GeoPDF Map
1950 Map No. 123137, 1950 Map No. 123138, 1950 Map No. 123139, 1950 Map No. 123142 Caledonia Fish Hatchery Avon (22%), Caledonia (68%), Rush (0%), Wheatland (17%), York (21%)
Current Churchville GeoPDF Map
1935 Map No. 122736, 1950 Map No. 122738, 1950 Map No. 122739 NA Bergen (72%), Le Roy (32%), Riga (48%), Wheatland (13%)
Current Clifton GeoPDF Map
1934 Map No. 137669, 1934 Map No. 137670, 1950 Map No. 137671, 1950 Map No. 137672, 1950 Map No. 137673, 1971 Map No. 137674, 1971 Map No. 137675, 1971 Map No. 137676 Cedar Springs Fish Hatchery Chili (54%), Riga (49%), Wheatland (53%)
Current Fairport GeoPDF Map
1932 Map No. 139532, 1934 Map No. 138126, 1952 Map No. 138129, 1952 Map No. 138130, 1952 Map No. 138131, 1952 Map No. 138132, 1971 Map No. 138133, 1971 Map No. 138134, 1971 Map No. 138135 NA East Rochester (98%), Mendon (5%), Penfield (2%), Perinton (97%), Pittsford (16%), Victor (37%)
Current Hamlin GeoPDF Map
1932 Map No. 139631, 1935 Map No. 129677, 1935 Map No. 129678, 1952 Map No. 129679, 1952 Map No. 129680, 1971 Map No. 129681, 1978 Map No. 129682 Sandy Creek Fishing Access Parking, Sandy Creek Wetlands Clarkson (44%), Hamlin (73%), Kendall (4%), Murray (2%)
Current Hilton GeoPDF Map
1934 Map No. 129854, 1934 Map No. 129855, 1952 Map No. 129851, 1952 Map No. 129852, 1952 Map No. 129853, 1971 Map No. 129849, 1971 Map No. 129850 Braddock Bay WMA Clarkson (12%), Greece (0%), Hamlin (27%), Parma (59%)
Current Honeoye Falls GeoPDF Map
1934 Map No. 129754, 1951 Map No. 129752, 1951 Map No. 129753, 1971 Map No. 129750, 1971 Map No. 129751, 1971 Map No. 137256 NA Lima (49%), Mendon (58%), Rush (4%), West Bloomfield (57%)
Current Le Roy GeoPDF Map
1950 Map No. 130235, 1950 Map No. 130236, 1950 Map No. 130237, 1950 Map No. 137314 Groveland Secondary Trailway Caledonia (24%), Le Roy (40%), Pavilion (39%), Wheatland (5%), York (23%)
Current Macedon GeoPDF Map
1951 Map No. 130414, 1951 Map No. 130415, 1951 Map No. 130416, 1951 Map No. 130417 NA Farmington (37%), Macedon (98%), Marion (0%), Penfield (0%), Perinton (3%), Victor (1%), Walworth (2%)
Current Ninemile Point GeoPDF Map
1934 Map No. 128722, 1934 Map No. 128725, 1952 Map No. 128723, 1952 Map No. 128724, 1952 Map No. 128726, 1971 Map No. 128727, 1971 Map No. 137422 NA Ontario (0%), Webster (18%)
Current Pittsford GeoPDF Map
1971 Map No. 129031, 1971 Map No. 129032, 1971 Map No. 129033, 1994 Map No. 136811 NA Brighton (47%), East Rochester (2%), Henrietta (38%), Mendon (29%), Penfield (0%), Pittsford (84%), Rochester city (2%), Rush (5%)
Current Rochester East GeoPDF Map
1931 Map No. 148332, 1935 Map No. 136081, 1935 Map No. 136082, 1935 Map No. 136083, 1952 Map No. 136084, 1952 Map No. 136085, 1952 Map No. 136086, 1971 Map No. 136087, 1971 Map No. 136088, 1971 Map No. 136089 NA Brighton (33%), Greece (1%), Irondequoit (100%), Penfield (15%), Rochester city (54%), Webster (15%)
Current Rochester West GeoPDF Map
1931 Map No. 148335, 1935 Map No. 136091, 1935 Map No. 136092, 1952 Map No. 136093, 1952 Map No. 136094, 1952 Map No. 136095, 1971 Map No. 136096, 1971 Map No. 136097, 1971 Map No. 136860, 1971 Map No. 136861, 1994 Map No. 136862 NA Chili (0%), Gates (95%), Greece (53%), Rochester city (37%)
Current Rush GeoPDF Map
1931 Map No. 148375, 1934 Map No. 129251, 1934 Map No. 129252, 1951 Map No. 129253, 1951 Map No. 129254, 1971 Map No. 129255, 1971 Map No. 129256, 1971 Map No. 136877 Avon Regional Office, Genesee River Waterway Access, Twin Cedars Environmental Area, Rush Oak Openings Unique Area Avon (52%), Caledonia (8%), Lima (22%), Mendon (1%), Rush (70%), Wheatland (3%)
Current Spencerport GeoPDF Map
1932 Map No. 148525, 1934 Map No. 139834, 1934 Map No. 139835, 1952 Map No. 139836, 1952 Map No. 139837, 1952 Map No. 139838, 1971 Map No. 139839, 1971 Map No. 139840 NA Chili (1%), Clarkson (6%), Gates (5%), Greece (1%), Ogden (89%), Parma (41%), Riga (2%), Sweden (1%)
Current Victor GeoPDF Map
1951 Map No. 139496, 1951 Map No. 139497, 1951 Map No. 139498, 1971 Map No. 139499, 1971 Map No. 139500, 1971 Map No. 139501 NA East Bloomfield (74%), Mendon (8%), Victor (59%), West Bloomfield (21%)
Current Webster GeoPDF Map
1932 Map No. 144023, 1934 Map No. 140091, 1934 Map No. 140092, 1934 Map No. 140093, 1952 Map No. 140094, 1952 Map No. 140095, 1952 Map No. 140096, 1971 Map No. 136996, 1971 Map No. 140097, 1971 Map No. 140098 NA Ontario (0%), Penfield (82%), Walworth (0%), Webster (67%)
Current West Henrietta GeoPDF Map
1971 Map No. 140165, 1971 Map No. 140166 Black Creek Waterway Access Brighton (20%), Chili (45%), Henrietta (62%), Rochester city (6%), Rush (20%), Wheatland (10%)

Montgomery County

PDF (50-60 MB Download) Historical USGS Topo Maps State Lands (Links to DEC Website) Towns (Percent of Town’s Area)
Current Amsterdam GeoPDF Map
1954 Map No. 136622, 1954 Map No. 136623, 1954 Map No. 136624, 1954 Map No. 137071 NA Amsterdam city (100%), Amsterdam (56%), Duanesburg (0%), Florida (47%), Perth (28%), Princetown (0%)
Current Canajoharie GeoPDF Map
1944 Map No. 123405, 1944 Map No. 123406 NA Canajoharie (28%), Ephratah (9%), Minden (1%), Palatine (84%), Root (3%), St. Johnsville (9%)
Current Carlisle GeoPDF Map
1943 Map No. 122809, 1943 Map No. 122810 Rural Grove State Forest, Yatesville Falls State Forest Carlisle (36%), Charleston (28%), Glen (5%), Root (56%)
Current Duanesburg GeoPDF Map
1954 Map No. 137906, 1954 Map No. 137907, 1954 Map No. 137909 Featherstonhaugh State Forest Duanesburg (59%), Esperance (0%), Florida (24%)
Current East Springfield GeoPDF Map
1943 Map No. 138023, 1943 Map No. 138024 NA Cherry Valley (34%), Middlefield (19%), Minden (1%), Otsego (0%), Roseboom (4%), Springfield (57%), Stark (3%)
Current Esperance GeoPDF Map
1943 Map No. 138118, 1943 Map No. 138120 Lost Valley State Forest, Charleston State Forest Carlisle (9%), Charleston (72%), Duanesburg (3%), Esperance (54%), Florida (7%), Glen (11%)
Current Fort Plain GeoPDF Map
1944 Map No. 138157, 1944 Map No. 138280 NA Canajoharie (9%), Danube (4%), Manheim (0%), Minden (87%), Palatine (2%), St. Johnsville (25%)
Current Oppenheim GeoPDF Map
1945 Map No. 128927, 1945 Map No. 128928 Fulton FP Detached Parcel, Lassellsville State Forest, Ferris Lake Wild Forest Danube (0%), Manheim (3%), Oppenheim (75%), Salisbury (0%), St. Johnsville (62%), Stratford (1%)
Current Pattersonville GeoPDF Map
1954 Map No. 135974, 1954 Map No. 135975 NA Amsterdam (30%), Charlton (37%), Duanesburg (0%), Florida (5%), Galway (13%), Glenville (40%), Perth (6%), Princetown (7%), Rotterdam (5%)
Current Randall GeoPDF Map
1944 Map No. 136007, 1944 Map No. 136008, 1944 Map No. 136009 Yatesville Falls State Forest Ephratah (1%), Glen (28%), Johnstown city (27%), Johnstown (7%), Mohawk (62%), Palatine (14%), Root (18%)
Current Sharon Springs GeoPDF Map
1943 Map No. 136148, 1943 Map No. 136149, 1943 Map No. 136150 NA Canajoharie (39%), Carlisle (8%), Root (23%), Seward (0%), Sharon (61%)
Current Sprout Brook GeoPDF Map
1943 Map No. 136932, 1943 Map No. 139853, 1943 Map No. 139854 Cherry Valley State Forest, Honey Hill State Forest Canajoharie (24%), Cherry Valley (66%), Minden (9%), Roseboom (9%), Sharon (26%)
Current Tribes Hill GeoPDF Map
1944 Map No. 139361, 1944 Map No. 139363 NA Amsterdam (13%), Florida (17%), Glen (56%), Johnstown city (8%), Johnstown (6%), Mohawk (38%), Perth (8%)
Current Van Hornesville GeoPDF Map
1943 Map No. 139474, 1943 Map No. 139475 Otsquago State Forest, Ohisa State Forest, Van Hornesville Fish Hatchery Danube (69%), Little Falls (7%), Minden (2%), Springfield (6%), Stark (90%), Warren (0%)

Nassau County

PDF (50-60 MB Download) Historical USGS Topo Maps State Lands (Links to DEC Website) Towns (Percent of Town’s Area)
Current Amityville GeoPDF Map
1947 Map No. 136609, 1954 Map No. 136610, 1969 Map No. 136611, 1969 Map No. 136612, 1994 Map No. 137067 Babylon Marsh-Elder And Petteanger Isl Stw Babylon (34%), Hempstead (4%), Oyster Bay (23%)
Current Bayville GeoPDF Map
1954 Map No. 123220, 1954 Map No. 123221, 1967 Map No. 123222, 1967 Map No. 123223, 1967 Map No. 123224 Oyster Bay Western Waterfront Waterway Glen Cove city (9%), Oyster Bay (10%)
Current Far Rockaway GeoPDF Map
1947 Map No. 138136, 1954 Map No. 138137, 1969 Map No. 138139, 1969 Map No. 138140 Norton Basin Natural Resource Area Brooklyn borough (7%), Hempstead (1%), Queens borough (11%)
Current Flushing GeoPDF Map
1947 Map No. 138246, 1947 Map No. 138247, 1955 Map No. 138248, 1955 Map No. 138249, 1966 Map No. 137330, 1966 Map No. 138250, 1966 Map No. 138251, 1966 Map No. 138252, 1995 Map No. 137332 Bronx River Trail Bronx borough (42%), North Hempstead (2%), Queens borough (17%)
Current Freeport GeoPDF Map
1947 Map No. 138178, 1955 Map No. 138179, 1969 Map No. 138180, 1969 Map No. 138181, 1994 Map No. 137214 NA Hempstead (40%), North Hempstead (1%), Oyster Bay (1%)
Current Hicksville GeoPDF Map
1947 Map No. 129919, 1954 Map No. 129917, 1954 Map No. 129918, 1967 Map No. 129914, 1967 Map No. 129915, 1967 Map No. 129916 Old Westbury Unique Area, Underhill Unique Area Glen Cove city (29%), Hempstead (0%), North Hempstead (19%), Oyster Bay (39%)
Current Huntington GeoPDF Map
1947 Map No. 129952, 1954 Map No. 129954, 1954 Map No. 129955, 1967 Map No. 130047, 1967 Map No. 137270 NA Babylon (3%), Huntington (33%), Oyster Bay (20%)
Current Jones Inlet GeoPDF Map
1947 Map No. 129875, 1954 Map No. 130099, 1954 Map No. 130100, 1967 Map No. 130101, 1967 Map No. 130103 Lido Beach State Tidal Wetland Hempstead (12%)
Current Lawrence GeoPDF Map
1947 Map No. 130229, 1954 Map No. 130230, 1966 Map No. 130231, 1966 Map No. 130232, 1966 Map No. 130233 NA Hempstead (11%), Long Beach city (100%), Queens borough (1%)
Current Lloyd Harbor GeoPDF Map
1954 Map No. 130306, 1954 Map No. 130307, 1967 Map No. 130308, 1967 Map No. 137367 NA Huntington (21%), Oyster Bay (1%)
Current Lynbrook GeoPDF Map
1947 Map No. 130380, 1954 Map No. 130381, 1954 Map No. 130382, 1969 Map No. 130383, 1969 Map No. 191791 Oceanside Landing Waterway Access Site, Inwood Bay State Tidal Wetland Hempstead (30%), North Hempstead (7%), Queens borough (9%)
Current Mamaroneck GeoPDF Map
1947 Map No. 130436, 1955 Map No. 130438, 1955 Map No. 130439, 1967 Map No. 130440, 1967 Map No. 137428 NA Glen Cove city (27%), Harrison (30%), Mamaroneck (52%), Rye city (100%), Rye (31%), Scarsdale (3%), White Plains city (9%)
Current Sea Cliff GeoPDF Map
1947 Map No. 136120, 1954 Map No. 136115, 1954 Map No. 136116, 1968 Map No. 136117, 1968 Map No. 136118 Udall’s Cove And Ravine Natural Resource Area, Udall’s Cove And Ravine Natural Resource Area Glen Cove city (36%), North Hempstead (70%), Oyster Bay (2%), Queens borough (2%)
Current West Gilgo Beach GeoPDF Map
NA Babylon Marsh-Elder And Petteanger Isl Stw Babylon (2%), Hempstead (1%), Oyster Bay (4%)

New York County

PDF (50-60 MB Download) Historical USGS Topo Maps State Lands (Links to DEC Website) Towns (Percent of Town’s Area)
Current Brooklyn GeoPDF Map
1947 Map No. 123124, 1956 Map No. 123127, 1956 Map No. 123128, 1967 Map No. 123129, 1967 Map No. 123130, 1967 Map No. 123131, 1967 Map No. 123132, 1995 Map No. 137132 NA Brooklyn borough (47%), Manhattan borough (18%), Queens borough (10%)
Current Central Park GeoPDF Map
1947 Map No. 122894, 1956 Map No. 122895, 1956 Map No. 122896, 1966 Map No. 122897, 1966 Map No. 122898, 1966 Map No. 122899, 1966 Map No. 122900, 1995 Map No. 137165 Bronx River Trail Bronx borough (31%), Manhattan borough (68%), Queens borough (7%)
Current Jersey City GeoPDF Map
NA NA Brooklyn borough (7%), Manhattan borough (12%), Staten Island borough (7%)

Niagara County

PDF (50-60 MB Download) Historical USGS Topo Maps State Lands (Links to DEC Website) Towns (Percent of Town’s Area)
Current Akron GeoPDF Map
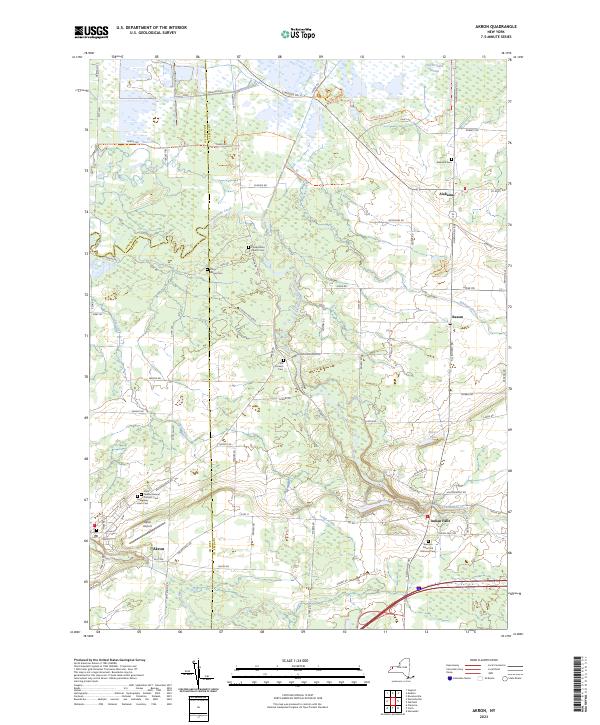
1949 Map No. 136539, 1951 Map No. 136540, 1951 Map No. 710097 Onondaga Escarpment Unique Area, John White WMA, Tonawanda WMA Alabama (46%), Newstead (17%), Pembroke (24%), Royalton (6%), Tonawanda Reservation (100%), Tonawanda Reservation (100%), Tonawanda Reservation (100%)
Current Barker GeoPDF Map
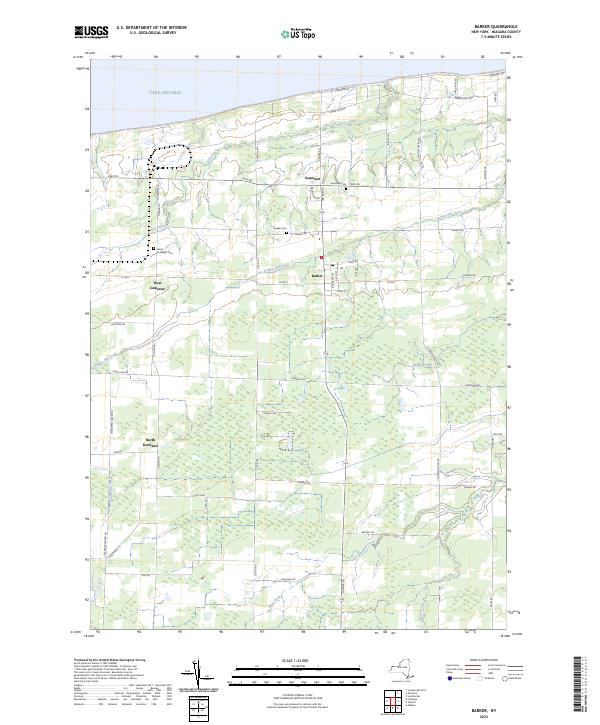
1949 Map No. 123175, 1965 Map No. 123176 Hartland Swamp WMA Hartland (45%), Somerset (73%)
Current Cambria GeoPDF Map
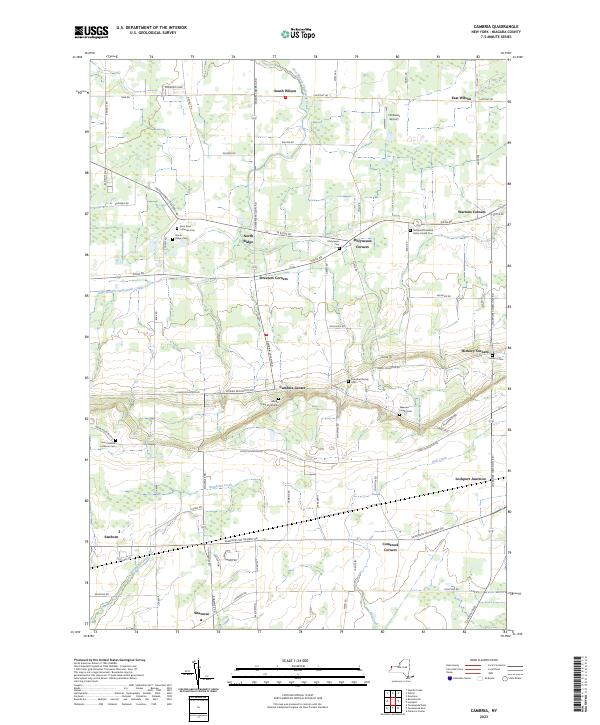
1949 Map No. 123146, 1965 Map No. 123148 NA Cambria (92%), Lockport (3%), Newfane (1%), Pendleton (8%), Wheatfield (5%), Wilson (25%)
Current Clarence Center GeoPDF Map
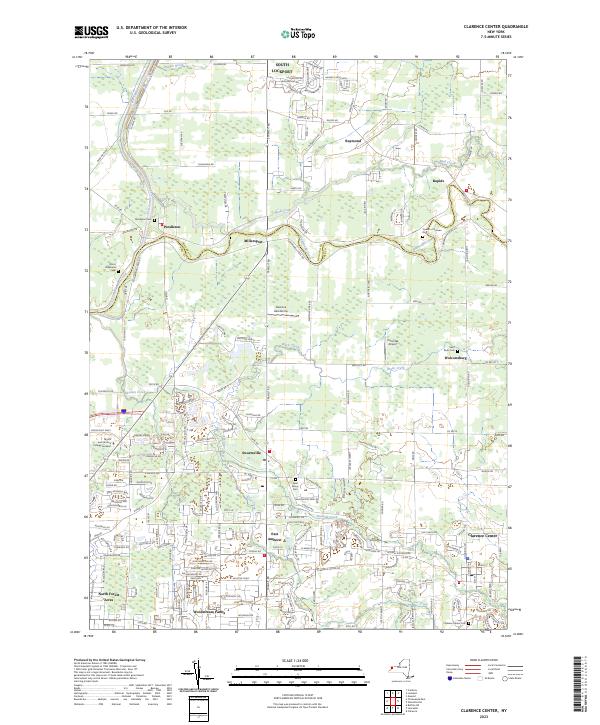
1950 Map No. 137625, 1950 Map No. 137626, 1965 Map No. 137627 Great Baehre Swamp WMA Amherst (28%), Clarence (41%), Lockport (21%), Pendleton (29%)
Current Fort Niagara GeoPDF Map
NA NA Porter (13%)
Current Gasport GeoPDF Map
1950 Map No. 129475, 1965 Map No. 129476 NA Hartland (27%), Lockport (4%), Royalton (55%)
Current Lewiston GeoPDF Map
1950 Map No. 130254, 1965 Map No. 130255 NA Lewiston (37%), Niagara Falls city (3%), Niagara (10%), Porter (17%)
Current Lockport GeoPDF Map
1950 Map No. 130317, 1965 Map No. 130318 NA Hartland (2%), Lockport city (100%), Lockport (69%), Newfane (24%), Pendleton (5%)
Current Lyndonville GeoPDF Map
1951 Map No. 130384, 1951 Map No. 130385 NA Hartland (13%), Ridgeway (34%), Somerset (22%), Yates (59%)
Current Medina GeoPDF Map
1949 Map No. 130524, 1951 Map No. 130527 Tonawanda WMA Alabama (4%), Hartland (9%), Ridgeway (20%), Royalton (16%), Shelby (58%)
Current Newfane GeoPDF Map
1950 Map No. 130845, 1965 Map No. 130846 NA Hartland (4%), Newfane (73%), Somerset (5%)
Current Niagara Falls GeoPDF Map
1949 Map No. 128711, 1965 Map No. 128712 NA Grand Island (9%), Niagara Falls city (67%), Niagara (10%)
Current Ransomville GeoPDF Map
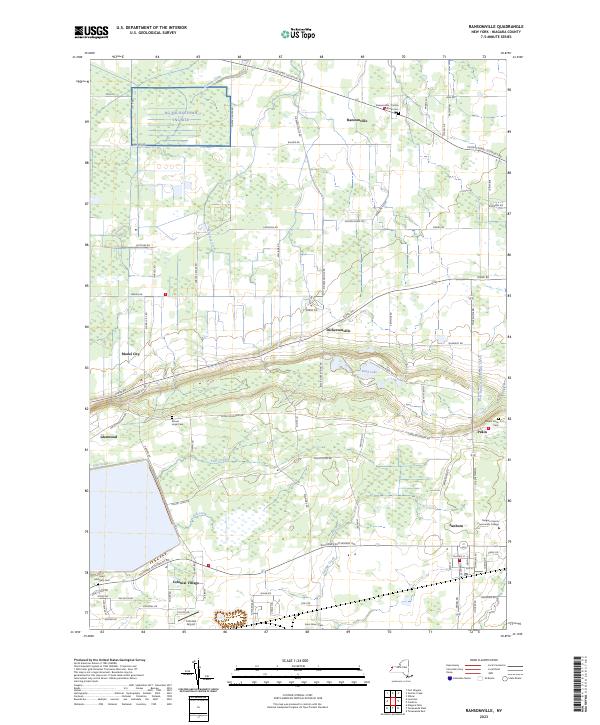
1950 Map No. 136015, 1965 Map No. 136016 NA Cambria (8%), Lewiston (63%), Niagara (15%), Porter (31%), Tuscarora Nation Reservation (100%), Wheatfield (6%), Wilson (5%)
Current Sixmile Creek GeoPDF Map
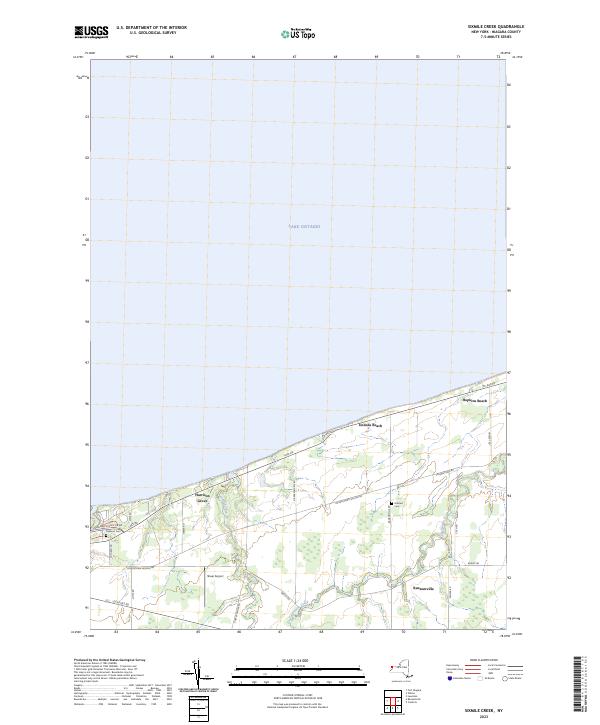
1949 Map No. 136173, 1965 Map No. 136174, 1973 Map No. 136175 NA Porter (38%), Wilson (10%)
Current Tonawanda East GeoPDF Map
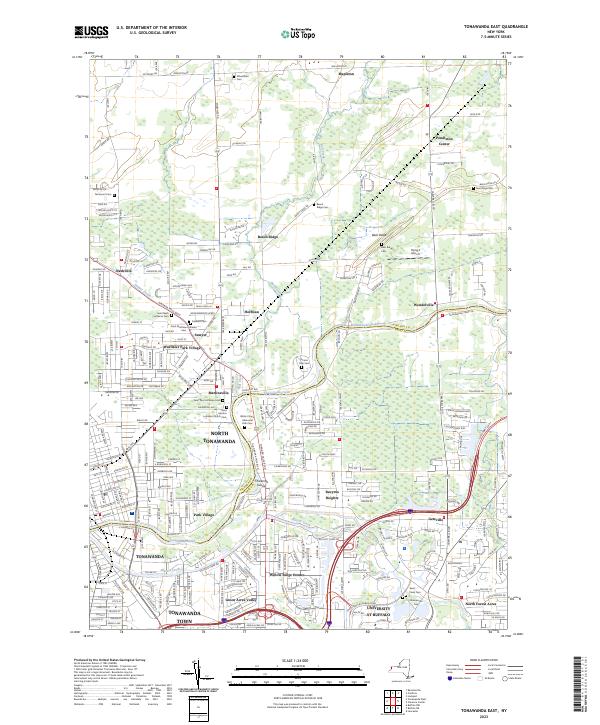
1950 Map No. 139339, 1950 Map No. 139340, 1965 Map No. 139341, 1980 Map No. 139342 NA Amherst (31%), North Tonawanda city (64%), Pendleton (57%), Tonawanda city (41%), Tonawanda (13%), Wheatfield (39%)
Current Tonawanda West GeoPDF Map
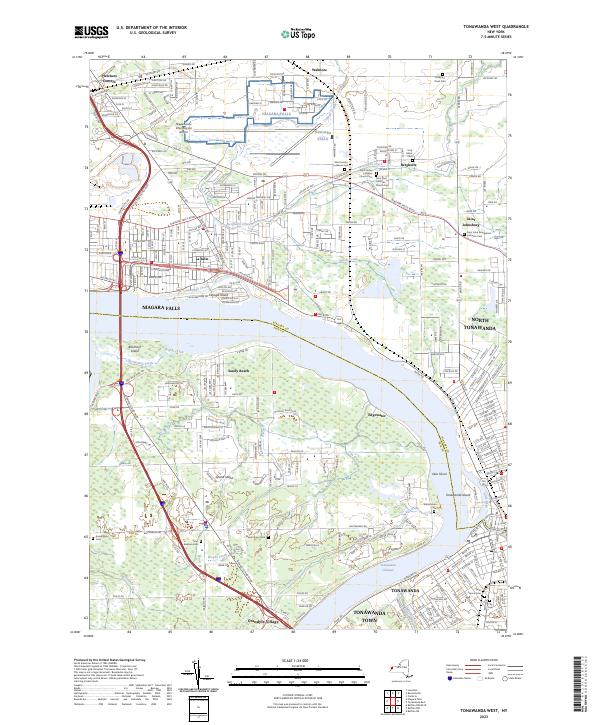
1948 Map No. 139343, 1948 Map No. 139344, 1950 Map No. 139345, 1965 Map No. 139347 Spicer Creek WMA Grand Island (66%), Niagara Falls city (30%), Niagara (65%), North Tonawanda city (36%), Tonawanda city (57%), Tonawanda (3%), Wheatfield (51%)
Current Wilson GeoPDF Map
1949 Map No. 140342, 1965 Map No. 140343 NA Newfane (3%), Wilson (60%)
Current Wolcottsville GeoPDF Map
1950 Map No. 140363, 1965 Map No. 140364 Tonawanda WMA, Tonawanda Creek Fishing Access Clarence (25%), Lockport (2%), Newstead (47%), Royalton (23%)

Oneida County

PDF (50-60 MB Download) Historical USGS Topo Maps State Lands (Links to DEC Website) Towns (Percent of Town’s Area)
Current Boonville GeoPDF Map
1945 Map No. 123359, 1955 Map No. 123361, 1955 Map No. 123362, 1955 Map No. 137122 Hogsback State Forest, Buck Hill State Forest, Clark Hill State Forest, Penn Mountain State Forest, Jackson Hill State Forest, Black River Fishing Access Ava (3%), Boonville (59%), Leyden (0%), Steuben (16%), Western (7%)
Current Brookfield GeoPDF Map
1943 Map No. 123110, 1943 Map No. 123111 Mount Hunger State Forest, Gorton Lake State Forest, Charles E. Baker State Forest, Brookfield Railroad State Forest, Beaver Creek State Forest Bridgewater (4%), Brookfield (63%), Edmeston (6%), Plainfield (0%), Sangerfield (5%)
Current Camden East GeoPDF Map
1955 Map No. 123164, 1955 Map No. 123165, 1955 Map No. 137141 Oneida FP Detached Parcel, Fish Creek State Forest, Cobb Brook State Forest, Furnace Creek State Forest, West Branch Fish Creek Fishing Access Annsville (36%), Camden (33%), Florence (3%), Rome city (0%), Vienna (14%)
Current Camden West GeoPDF Map
1943 Map No. 123170, 1960 Map No. 123168, 1960 Map No. 123169, 1960 Map No. 137142 Oneida FP Detached Parcel, Stone Barn State Forest Amboy (1%), Camden (54%), Constantia (2%), Vienna (24%)
Current Cassville GeoPDF Map
1943 Map No. 122832, 1943 Map No. 122833 Sauquoit Creek Fishing Access, Mount Hunger State Forest, Gorton Lake State Forest, Beaver Creek State Forest, Albert J. Woodford Memorial State Forest Bridgewater (55%), Marshall (40%), Paris (48%), Sangerfield (43%)
Current Cleveland GeoPDF Map
1941 Map No. 137657, 1941 Map No. 137658, 1957 Map No. 137662, 1957 Map No. 137663, 1973 Map No. 137178, 1973 Map No. 137664, 1973 Map No. 137665 Training Academy, Unclassifed, Oneida Lake Boat Launch, Cicero Swamp WMA, Oneida Fish Hatchery Cicero (11%), Constantia (34%), Sullivan (19%), Vienna (1%)
Current Clinton GeoPDF Map
1949 Map No. 137768, 1955 Map No. 137769, 1955 Map No. 137770 NA Augusta (11%), Kirkland (58%), Marshall (0%), Vernon (24%), Westmoreland (51%), Whitestown (0%)
Current Florence GeoPDF Map
1955 Map No. 138243, 1955 Map No. 138244, 1955 Map No. 138245 Lewis FP Detached Parcel, Lot 127 FP Detached Parcel, Lot 134 FP Detached Parcel, Salmon River Fishing Access, Big Brook State Forest, Swancott Hill State Forest, Tri-County State Forest, Fall Brook State Forest, Furnace Creek State Forest, Mad River State Forest, West Osceola State Forest, Swancott Mill State Forest, East Osceola State Forest, Salmon River East Branch Fishing Access Annsville (10%), Camden (0%), Florence (51%), Lewis (13%), Osceola (13%)
Current Forestport GeoPDF Map
1945 Map No. 138257, 1945 Map No. 138258, 1945 Map No. 138259, 1945 Map No. 138260 Forestport FP Detached Parcel, Woodhull Creek Fishing Access, Hogsback State Forest, Punkeyville State Forest, Woodhull State Forest, Penn Mountain State Forest, Black River Fishing Access Boonville (16%), Forestport (39%), Remsen (24%), Steuben (7%)
Current Hinckley GeoPDF Map
1946 Map No. 129856, 1946 Map No. 129857, 1946 Map No. 137252 Hinckley State Forest, Ferris Lake Wild Forest, Black River Wild Forest, Hinckley Day Use Area Norway (2%), Ohio (2%), Remsen (23%), Russia (66%), Trenton (1%)
Current Hubbardsville GeoPDF Map
1943 Map No. 129928, 1943 Map No. 129929 Gorton Lake State Forest, Charles E. Baker State Forest Brookfield (30%), Hamilton (51%), Madison (20%), Sangerfield (7%)
Current Jewell GeoPDF Map
1941 Map No. 129994, 1957 Map No. 130091, 1957 Map No. 130092, 1957 Map No. 137285 Stone Barn State Forest, Oneida Lake At Jewell Fishing Access Constantia (0%), Lenox (23%), Sullivan (9%), Vienna (41%)
Current Lee Center GeoPDF Map
1955 Map No. 130240, 1955 Map No. 130241, 1955 Map No. 130242 West Branch State Forest, Canada Creek State Forest, Point Rock State Forest, Rome Sand Plains Unique Area Annsville (30%), Lee (61%), Rome city (10%), Vienna (1%)
Current Mckeever GeoPDF Map
NA Black River Wild Forest Forestport (11%), Lyonsdale (1%), Ohio (6%), Webb (5%)
Current Munnsville GeoPDF Map
1943 Map No. 130731, 1943 Map No. 130732 Chenango River Fishing Access, Leland Pond Fishing Access Augusta (39%), Eaton (26%), Madison (31%), Smithfield (0%), Stockbridge (60%)
Current Newport GeoPDF Map
1943 Map No. 130848, 1943 Map No. 130849, 1943 Map No. 130850, 1982 Map No. 130852 West Canada Creek Fishing Access Deerfield (24%), Herkimer (2%), Newport (85%), Norway (0%), Russia (14%), Schuyler (24%)
Current North Western GeoPDF Map
1955 Map No. 128773, 1955 Map No. 128774 Buck Hill State Forest, South Hill State Forest, Clark Hill State Forest, Penn Mountain State Forest Floyd (43%), Steuben (48%), Trenton (2%), Western (32%)
Current North Wilmurt GeoPDF Map
1946 Map No. 128775, 1946 Map No. 128777 Forestport FP Detached Parcel, Woodhull Detached Parcel, Black River Wild Forest, Black River Fishing Access Forestport (14%), Ohio (10%), Remsen (12%), Russia (11%)
Current Oneida GeoPDF Map
1947 Map No. 128908, 1955 Map No. 128909, 1955 Map No. 128910, 1955 Map No. 128911, 1955 Map No. 137484 NA Fenner (3%), Lenox (28%), Lincoln (62%), Oneida city (84%), Smithfield (9%), Stockbridge (9%), Vernon (3%), Verona (5%)
Current Oriskany GeoPDF Map
1949 Map No. 135899, 1955 Map No. 135900, 1955 Map No. 135902 Mohawk River Fishing Access, Oriskany Flats WMA Floyd (45%), Marcy (66%), Rome city (2%), Trenton (7%), Whitestown (45%)
Current Oriskany Falls GeoPDF Map
1943 Map No. 135895, 1943 Map No. 135896, 1943 Map No. 137490, 1944 Map No. 135898 NA Augusta (36%), Kirkland (1%), Madison (29%), Marshall (57%), Sangerfield (44%)
Current Panther Lake GeoPDF Map
1959 Map No. 135963, 1959 Map No. 135964, 1959 Map No. 136770 Klondike State Forest, Oneida Fish Hatchery Amboy (42%), Camden (1%), Constantia (38%)
Current Point Rock GeoPDF Map
1955 Map No. 129062, 1955 Map No. 129063, 1955 Map No. 136814, 1955 Map No. 136815 Lewis FP Detached Parcel, East Branch Fish Creek Fishing Access, Fish Creek Fishing Access, Fall Brook State Forest, Point Rock State Forest, Raywood Unique Area, Swancott Mill State Forest, East Branch Fish Creek State Forest, Cottrell State Forest, Kotary Road Fishing Access Annsville (23%), Ava (21%), Lee (4%), Lewis (47%)
Current Port Leyden GeoPDF Map
1966 Map No. 129118, 1966 Map No. 129119 Boonville FP Detached Parcel, Lyonsdale FP Detached Parcel, Popple Pond State Forest, Independence River Wild Forest, Black River Wild Forest, Sand Flats State Forest, Black River Fishing Access Boonville (14%), Leyden (48%), Lyonsdale (38%), West Turin (1%)
Current Remsen GeoPDF Map
1955 Map No. 136052, 1955 Map No. 136053, 1955 Map No. 136054, 1955 Map No. 136855 Cincinnati Creek Waterway Access, Penn Mountain State Forest Floyd (1%), Remsen (41%), Russia (9%), Steuben (29%), Trenton (48%)
Current Rome GeoPDF Map
1949 Map No. 136103, 1955 Map No. 136104, 1955 Map No. 136105, 1955 Map No. 136869, 1955 Map No. 136870 Rome WMA Floyd (5%), Rome city (42%), Westmoreland (39%), Whitestown (17%)
Current South Trenton GeoPDF Map
1955 Map No. 136206, 1955 Map No. 136207, 1983 Map No. 136208 NA Deerfield (72%), Marcy (31%), Russia (0%), Schuyler (4%), Trenton (41%), Utica city (2%)
Current Sylvan Beach GeoPDF Map
1947 Map No. 139931, 1955 Map No. 136943, 1955 Map No. 139933, 1955 Map No. 139934, 1955 Map No. 139935 NA Lenox (13%), Oneida city (4%), Rome city (5%), Verona (39%), Vienna (19%)
Current Utica East GeoPDF Map
1943 Map No. 139462, 1955 Map No. 139464, 1955 Map No. 139465, 1983 Map No. 139466 Herkimer FP Detached Parcel, Utica Marsh WMA Deerfield (3%), Frankfort (60%), Litchfield (12%), Marcy (2%), New Hartford (24%), Paris (8%), Schuyler (15%), Utica city (74%)
Current Utica West GeoPDF Map
1949 Map No. 139468, 1955 Map No. 136980, 1955 Map No. 139470 NA Kirkland (41%), Marcy (1%), Marshall (2%), New Hartford (76%), Paris (17%), Utica city (24%), Westmoreland (0%), Whitestown (38%)
Current Vernon GeoPDF Map
1955 Map No. 139488, 1955 Map No. 139489 NA Augusta (13%), Oneida city (12%), Stockbridge (30%), Vernon (73%), Verona (13%), Westmoreland (0%)
Current Verona GeoPDF Map
1948 Map No. 139490, 1955 Map No. 139491, 1955 Map No. 139492, 1955 Map No. 139493 Rome WMA, Rome Sand Plains Unique Area Rome city (28%), Verona (42%), Vienna (0%), Westmoreland (9%)
Current West Leyden GeoPDF Map
1955 Map No. 137009, 1955 Map No. 140171 Buck Hill State Forest, Webster Hill State Forest, Point Rock State Forest, Jackson Hill State Forest, Mohawk Springs State Forest Ava (77%), Boonville (4%), Lee (3%), Lewis (16%), Leyden (13%), West Turin (0%), Western (10%)
Current West Winfield GeoPDF Map
1943 Map No. 137017, 1943 Map No. 140225, 1943 Map No. 140226 NA Bridgewater (41%), Litchfield (63%), Paris (27%), Plainfield (1%), Richfield (0%), Winfield (72%)
Current Westdale GeoPDF Map
1946 Map No. 140228, 1959 Map No. 137018, 1959 Map No. 140230, 1959 Map No. 140231 West Branch Fish Creek Fishing Access, Florence Hill State Forest, Tri-County State Forest, Mad River State Forest, O’hara State Forest, Orton Hollow State Forest, West Osceola State Forest Amboy (5%), Camden (12%), Florence (46%), Osceola (1%), Redfield (7%), Williamstown (33%)
Current Westernville GeoPDF Map
1955 Map No. 140237, 1955 Map No. 140238, 1955 Map No. 140239, 1955 Map No. 140241, 1955 Map No. 140242 Buck Hill State Forest, Rome Fish Hatchery Floyd (5%), Lee (32%), Rome city (14%), Western (51%)
Current Woodgate GeoPDF Map
NA Boonville FP Detached Parcel, Hogsback State Forest, Popple Pond State Forest, Black River Wild Forest, Sand Flats State Forest Boonville (8%), Forestport (36%), Lyonsdale (28%)

Onondaga County

PDF (50-60 MB Download) Historical USGS Topo Maps State Lands (Links to DEC Website) Towns (Percent of Town’s Area)
Current Baldwinsville GeoPDF Map
1948 Map No. 123393, 1957 Map No. 123394, 1957 Map No. 123395, 1973 Map No. 123400, 1973 Map No. 123401, 1973 Map No. 123402 Peter Scott Swamp Freshwater Wetlands, Three Rivers WMA, Seneca River Boat Launch Clay (11%), Granby (6%), Lysander (47%), Salina (0%), Schroeppel (18%), Van Buren (23%)
Current Brewerton GeoPDF Map
1940 Map No. 122993, 1957 Map No. 122998, 1957 Map No. 122999, 1973 Map No. 123000, 1973 Map No. 123001 Seneca River Waterway Access, Hamlin Marsh WMA Cicero (11%), Clay (81%), Hastings (3%), Lysander (2%), Salina (5%), Schroeppel (14%), West Monroe (1%)
Current Camillus GeoPDF Map
1943 Map No. 123173, 1943 Map No. 123174, 1955 Map No. 123068, 1955 Map No. 123069 Split Rock Unique Area, Nine Mile Creek Fishing Access, Camillus Forest Unique Area Camillus (90%), Elbridge (1%), Geddes (14%), Lysander (0%), Marcellus (11%), Onondaga (7%), Salina (0%), Skaneateles (0%), Van Buren (38%)
Current Central Square GeoPDF Map
1956 Map No. 122904, 1956 Map No. 122906, 1956 Map No. 122907, 1956 Map No. 122908, 1956 Map No. 122909 Three Mile Bay WMA Clay (4%), Hastings (76%), Palermo (24%), Schroeppel (17%), West Monroe (1%)
Current Cicero GeoPDF Map
1940 Map No. 137611, 1957 Map No. 137615, 1957 Map No. 137616, 1973 Map No. 137617, 1973 Map No. 137618, 1973 Map No. 137619, 1973 Map No. 137620 Unclassifed, Cicero Swamp WMA, Three Mile Bay WMA Cicero (72%), Constantia (14%), West Monroe (15%)
Current Cleveland GeoPDF Map
1941 Map No. 137657, 1941 Map No. 137658, 1957 Map No. 137662, 1957 Map No. 137663, 1973 Map No. 137178, 1973 Map No. 137664, 1973 Map No. 137665 Training Academy, Unclassifed, Oneida Lake Boat Launch, Cicero Swamp WMA, Oneida Fish Hatchery Cicero (11%), Constantia (34%), Sullivan (19%), Vienna (1%)
Current Deruyter GeoPDF Map
1943 Map No. 137206 Morgan Hill State Forest, Deruyter State Forest, Fabius Brook Fishing Access Cazenovia (8%), Cuyler (33%), DeRuyter (18%), Fabius (55%), Pompey (8%)
Current Jamesville GeoPDF Map
1943 Map No. 129980, 1955 Map No. 129985, 1955 Map No. 129986, 1973 Map No. 129988 Butternut Creek Fishing Access De Witt (15%), LaFayette (60%), Manlius (2%), Onondaga (6%), Pompey (32%), Syracuse city (0%)
Current Jordan GeoPDF Map
1955 Map No. 130109, 1955 Map No. 130110, 1978 Map No. 130111, 1978 Map No. 130112 Cold Brook Parking Area, Carpenter’s Creek Fishing Access, Cross Lake Islands WMA, Cross Lake Waterway Access Brutus (5%), Camillus (0%), Cato (5%), Elbridge (99%), Lysander (4%), Sennett (3%), Skaneateles (5%), Van Buren (19%)
Current Lysander GeoPDF Map
1955 Map No. 130408, 1955 Map No. 130409, 1955 Map No. 137424 Three Rivers WMA Cato (13%), Granby (16%), Ira (15%), Lysander (47%), Van Buren (20%)
Current Manlius GeoPDF Map
1957 Map No. 130446, 1957 Map No. 130447, 1973 Map No. 130448, 1973 Map No. 137429, 1973 Map No. 137430, 1973 Map No. 137431 Cicero Swamp WMA, Limestone Creek Fishing Access Cazenovia (2%), Cicero (2%), Manlius (59%), Sullivan (32%)
Current Marcellus GeoPDF Map
1955 Map No. 130455, 1955 Map No. 130456, 1955 Map No. 130457, 1955 Map No. 130458 Otisco Lake Waterway Access Marcellus (89%), Onondaga (21%), Otisco (14%), Skaneateles (8%), Spafford (13%)
Current Oran GeoPDF Map
1942 Map No. 128929, 1943 Map No. 128930, 1973 Map No. 128933, 1973 Map No. 137488 Chittenango Creek Fishing Access, Limestone Creek Fishing Access Parking, Limestone Creek Fishing Access Cazenovia (27%), Manlius (8%), Pompey (55%)
Current Otisco Valley GeoPDF Map
1955 Map No. 135933, 1955 Map No. 135934, 1955 Map No. 135935, 1955 Map No. 136759 Hewitt State Forest, Tully Lake Fishing Access LaFayette (8%), Otisco (52%), Preble (24%), Scott (20%), Spafford (23%), Tully (59%)
Current Owasco GeoPDF Map
1943 Map No. 135945, 1955 Map No. 135946, 1955 Map No. 135947, 1955 Map No. 135948 Dutch Hollow Brook Parking Area, Frozen Ocean State Forest, Owasco Lake Water Access Moravia (35%), Niles (64%), Owasco (23%), Scipio (7%), Skaneateles (14%), Spafford (1%), Venice (3%)
Current Skaneateles GeoPDF Map
1955 Map No. 136178, 1955 Map No. 136179, 1955 Map No. 136180 Skaneateles Lake Boat Launch Owasco (36%), Sennett (35%), Skaneateles (72%), Spafford (4%)
Current South Onondaga GeoPDF Map
1955 Map No. 136195, 1955 Map No. 136196, 1955 Map No. 136197, 1973 Map No. 136198 NA LaFayette (18%), Onondaga Nation Reservation (100%), Onondaga (50%), Otisco (24%), Syracuse city (8%)
Current Spafford GeoPDF Map
1955 Map No. 139819, 1955 Map No. 139820 Grout Brook Fishing Access, Carpenter Falls Unique Area, Bear Swamp State Forest, Otisco Lake Waterway Access Site Moravia (1%), Niles (33%), Otisco (10%), Scott (8%), Sempronius (39%), Skaneateles (1%), Spafford (60%)
Current Syracuse East GeoPDF Map
1938 Map No. 139939, 1938 Map No. 139940, 1957 Map No. 139943, 1957 Map No. 139944, 1957 Map No. 139945, 1957 Map No. 139947, 1977 Map No. 139946 NA Cicero (4%), De Witt (85%), Manlius (31%), Onondaga (1%), Salina (8%), Syracuse city (25%)
Current Syracuse West GeoPDF Map
1939 Map No. 139950, 1939 Map No. 139952, 1958 Map No. 139953, 1958 Map No. 139954, 1973 Map No. 139955, 1973 Map No. 139956 Onondaga Lake Access, Split Rock Unique Area Camillus (10%), Cicero (0%), Clay (5%), Geddes (86%), Onondaga (14%), Salina (86%), Syracuse city (67%)
Current Tully GeoPDF Map
1943 Map No. 139399, 1955 Map No. 136971, 1955 Map No. 139401, 1955 Map No. 139402, 1955 Map No. 139403 Labrador Hollow Unique Area, Morgan Hill State Forest, Kettlebail State Forest Cuyler (1%), Fabius (45%), LaFayette (14%), Pompey (5%), Preble (17%), Truxton (20%), Tully (41%)

Ontario County

PDF (50-60 MB Download) Historical USGS Topo Maps State Lands (Links to DEC Website) Towns (Percent of Town’s Area)
Current Bristol Center GeoPDF Map
1951 Map No. 123015, 1951 Map No. 123016, 1951 Map No. 123017, 1951 Map No. 137130 Stid Hill Mua Bristol (95%), East Bloomfield (21%), Richmond (18%), South Bristol (7%), West Bloomfield (7%)
Current Bristol Springs GeoPDF Map
1943 Map No. 123020, 1943 Map No. 123021, 1943 Map No. 123022, 1943 Map No. 123023 Honeoye Inlet WMA, High Tor WMA, Stid Hill Mua Canadice (2%), Naples (44%), Richmond (13%), South Bristol (69%), Springwater (3%)
Current Canandaigua GeoPDF Map
1951 Map No. 122761, 1951 Map No. 122762, 1951 Map No. 122764 NA Canandaigua city (89%), Canandaigua (40%), East Bloomfield (3%), Farmington (60%), Victor (2%)
Current Canandaigua Lake GeoPDF Map
1951 Map No. 122751, 1951 Map No. 122752, 1951 Map No. 122753, 1951 Map No. 122754 Bare Hill Unique Area, Skenoh Island WMA, Canandaigua Lake Access Bristol (5%), Canandaigua city (11%), Canandaigua (58%), East Bloomfield (1%), Gorham (21%), Middlesex (8%), South Bristol (4%)
Current Clifton Springs GeoPDF Map
1951 Map No. 137666, 1951 Map No. 137667, 1951 Map No. 137668 Canandaigua Outlet Boat Launch Canandaigua (2%), Farmington (2%), Hopewell (78%), Manchester (58%), Phelps (4%), Seneca (1%)
Current Fairport GeoPDF Map
1932 Map No. 139532, 1934 Map No. 138126, 1952 Map No. 138129, 1952 Map No. 138130, 1952 Map No. 138131, 1952 Map No. 138132, 1971 Map No. 138133, 1971 Map No. 138134, 1971 Map No. 138135 NA East Rochester (98%), Mendon (5%), Penfield (2%), Perinton (97%), Pittsford (16%), Victor (37%)
Current Geneva North GeoPDF Map
1953 Map No. 129490, 1953 Map No. 129491, 1953 Map No. 129492, 1953 Map No. 129493 Junius Pond Unique Area Fayette (6%), Geneva city (29%), Geneva (12%), Junius (65%), Phelps (19%), Waterloo (81%)
Current Geneva South GeoPDF Map
1953 Map No. 129495, 1953 Map No. 129496, 1953 Map No. 129497, 1953 Map No. 129498, 1953 Map No. 129499 NA Benton (6%), Fayette (34%), Geneva city (56%), Geneva city (100%), Geneva (36%), Romulus (0%), Varick (39%), Waterloo (1%)
Current Honeoye GeoPDF Map
1951 Map No. 129741, 1951 Map No. 129742, 1951 Map No. 129743 Hemlock-Canadice State Forest, Honeoye Creek WMA Canadice (14%), Conesus (2%), Lima (17%), Livonia (29%), Richmond (65%), West Bloomfield (15%)
Current Honeoye Falls GeoPDF Map
1934 Map No. 129754, 1951 Map No. 129752, 1951 Map No. 129753, 1971 Map No. 129750, 1971 Map No. 129751, 1971 Map No. 137256 NA Lima (49%), Mendon (58%), Rush (4%), West Bloomfield (57%)
Current Lyons GeoPDF Map
1953 Map No. 130403, 1953 Map No. 130404, 1953 Map No. 130405 Galen WMA Galen (56%), Junius (18%), Lyons (38%), Phelps (3%), Rose (1%)
Current Macedon GeoPDF Map
1951 Map No. 130414, 1951 Map No. 130415, 1951 Map No. 130416, 1951 Map No. 130417 NA Farmington (37%), Macedon (98%), Marion (0%), Penfield (0%), Perinton (3%), Victor (1%), Walworth (2%)
Current Middlesex GeoPDF Map
1942 Map No. 130556, 1942 Map No. 130558, 1942 Map No. 130559 Bare Hill Unique Area, Italy Hill State Forest, High Tor WMA – Clark Gully, High Tor WMA – Parrish Gully, High Tor WMA, Woodville Boat Launch Italy (45%), Middlesex (80%), Naples (3%), Potter (1%), South Bristol (19%)
Current Naples GeoPDF Map
1942 Map No. 130756, 1942 Map No. 130761, 1942 Map No. 137395 High Tor WMA Cohocton (47%), Naples (49%), Prattsburgh (15%), Springwater (3%)
Current Newark GeoPDF Map
1952 Map No. 130822, 1952 Map No. 130823, 1952 Map No. 130824, 1952 Map No. 130825 NA Arcadia (67%), Lyons (37%), Phelps (9%)
Current Palmyra GeoPDF Map
1952 Map No. 135960, 1952 Map No. 135961 NA Arcadia (8%), Farmington (1%), Macedon (2%), Manchester (42%), Marion (0%), Palmyra (98%), Phelps (1%)
Current Phelps GeoPDF Map
1953 Map No. 128973, 1953 Map No. 128974 NA Geneva city (2%), Geneva (12%), Phelps (66%), Seneca (19%)
Current Prattsburg GeoPDF Map
1942 Map No. 129177, 1942 Map No. 129178 Italy Hill State Forest, High Tor WMA – Parrish Gully, High Tor WMA Italy (50%), Naples (4%), Prattsburgh (65%)
Current Rushville GeoPDF Map
1952 Map No. 129258, 1952 Map No. 129259, 1952 Map No. 129260 NA Canandaigua (1%), Gorham (78%), Hopewell (22%), Middlesex (2%), Potter (12%), Seneca (1%)
Current Springwater GeoPDF Map
1942 Map No. 136931, 1942 Map No. 139848, 1942 Map No. 139849, 1942 Map No. 139850 Hemlock-Canadice State Forest, Honeoye Inlet WMA Canadice (84%), Conesus (16%), Richmond (3%), Springwater (38%)
Current Stanley GeoPDF Map
1952 Map No. 139873, 1952 Map No. 139874 NA Benton (13%), Geneva city (13%), Geneva (40%), Gorham (1%), Potter (0%), Seneca (79%)
Current Victor GeoPDF Map
1951 Map No. 139496, 1951 Map No. 139497, 1951 Map No. 139498, 1971 Map No. 139499, 1971 Map No. 139500, 1971 Map No. 139501 NA East Bloomfield (74%), Mendon (8%), Victor (59%), West Bloomfield (21%)

Orange County

PDF (50-60 MB Download) Historical USGS Topo Maps State Lands (Links to DEC Website) Towns (Percent of Town’s Area)
Current Cornwall-on-Hudson GeoPDF Map
1994 Map No. 137191 Moodna Creek Waterway Access, Stewart State Forest, Kowawese Unique Area Blooming Grove (4%), Cornwall (92%), Fishkill (0%), Highlands (12%), New Windsor (54%), Newburgh city (33%), Newburgh (2%), Woodbury (6%)
Current Goshen GeoPDF Map
1942 Map No. 129570, 1957 Map No. 129576, 1957 Map No. 129577, 1957 Map No. 129578 NA Blooming Grove (0%), Chester (2%), Goshen (49%), Hamptonburgh (53%), Montgomery (3%), Wallkill (28%), Wawayanda (0%)
Current Greenwood Lake GeoPDF Map
1954 Map No. 129633, 1954 Map No. 129634, 1954 Map No. 129635, 1954 Map No. 129636, 1954 Map No. 137234 Mount Peter Hawk Watch Trailway Warwick (31%)
Current Maybrook GeoPDF Map
1957 Map No. 130490, 1957 Map No. 130491, 1957 Map No. 130492, 1957 Map No. 130493 Stewart State Forest Blooming Grove (72%), Chester (0%), Hamptonburgh (47%), Montgomery (7%), New Windsor (38%), Woodbury (1%)
Current Middletown GeoPDF Map
1942 Map No. 130561, 1969 Map No. 130564, 1969 Map No. 137445 NA Goshen (10%), Middletown city (100%), Mount Hope (18%), Wallkill (37%), Wawayanda (53%)
Current Monroe GeoPDF Map
1957 Map No. 130608, 1957 Map No. 130609, 1957 Map No. 130610, 1957 Map No. 130611, 1957 Map No. 137458 NA Blooming Grove (24%), Chester (23%), Monroe (100%), Palm Tree (100%), Tuxedo (23%), Warwick (0%), Woodbury (25%)
Current Newburgh GeoPDF Map
1957 Map No. 130832, 1957 Map No. 130833, 1957 Map No. 130834, 1957 Map No. 130835 Ulster FP Detached Parcel Marlborough (18%), Montgomery (0%), New Windsor (1%), Newburgh city (60%), Newburgh (83%), Plattekill (24%)
Current Otisville GeoPDF Map
1942 Map No. 135936, 1969 Map No. 135938, 1969 Map No. 135939 Graham Mountain State Forest, Gobbler’s Knob State Forest, Huckleberry Ridge State Forest, Bashakill WMA Deerpark (25%), Forestburgh (0%), Greenville (46%), Mamakating (0%), Minisink (0%), Mount Hope (78%), Wallkill (1%), Wawayanda (14%)
Current Peekskill GeoPDF Map
1947 Map No. 128944, 1957 Map No. 128946, 1957 Map No. 128948, 1957 Map No. 128949, 1957 Map No. 136783, 1957 Map No. 136784, 1957 Map No. 136785 NA Cortlandt (40%), Highlands (20%), Peekskill city (100%), Philipstown (24%), Putnam Valley (6%), Stony Point (28%)
Current Pine Bush GeoPDF Map
1956 Map No. 128999, 1956 Map No. 129000, 1956 Map No. 136802 NA Crawford (88%), Mamakating (0%), Montgomery (15%), Shawangunk (12%), Wallkill (9%)
Current Pine Island GeoPDF Map
1942 Map No. 129001, 1942 Map No. 129002, 1969 Map No. 136803 Pochuck Mountain State Forest Goshen (22%), Minisink (10%), Warwick (30%), Wawayanda (32%)
Current Pond Eddy GeoPDF Map
1965 Map No. 129064, 1965 Map No. 129065, 1965 Map No. 129066, 1965 Map No. 129067, 1965 Map No. 136816, 1992 Map No. 136817, 1997 Map No. 136818 Hickok Brook Multiple Use Area, Mongaup Valley WMA Deerpark (2%), Forestburgh (0%), Highland (1%), Lumberland (56%)
Current Popolopen Lake GeoPDF Map
1946 Map No. 129072, 1947 Map No. 129074, 1957 Map No. 129075, 1957 Map No. 129076, 1957 Map No. 129077, 1957 Map No. 129078, 1957 Map No. 129079, 1994 Map No. 136820 NA Cornwall (1%), Highlands (47%), Stony Point (30%), Tuxedo (11%), Woodbury (69%)
Current Port Jervis North GeoPDF Map
NA Cherry Island WMA, Huckleberry Ridge State Forest, Mongaup Valley WMA Deerpark (70%), Forestburgh (3%), Greenville (3%), Port Jervis city (68%)
Current Port Jervis South GeoPDF Map
NA Huckleberry Ridge State Forest Deerpark (3%), Greenville (18%), Port Jervis city (32%)
Current Sloatsburg GeoPDF Map
1955 Map No. 136181, 1955 Map No. 136182 NA Haverstraw (7%), Ramapo (31%), Tuxedo (62%), Warwick (1%)
Current Thiells GeoPDF Map
1955 Map No. 136954, 1955 Map No. 140002, 1955 Map No. 140003, 1955 Map No. 140004 NA Clarkstown (11%), Haverstraw (62%), Ramapo (38%), Stony Point (27%), Tuxedo (4%)
Current Unionville GeoPDF Map
1953 Map No. 139444, 1963 Map No. 139445, 1967 Map No. 139446, 1969 Map No. 139447, 1969 Map No. 139448, 1969 Map No. 139449 Huckleberry Ridge State Forest, Pochuck Mountain State Forest Greenville (34%), Minisink (90%), Warwick (3%), Wawayanda (1%)
Current Walden GeoPDF Map
1942 Map No. 139517, 1957 Map No. 139519, 1957 Map No. 139520 Stewart State Forest Crawford (1%), Montgomery (75%), New Windsor (6%), Newburgh (3%), Plattekill (1%), Shawangunk (24%)
Current Wappingers Falls GeoPDF Map
1956 Map No. 140039, 1956 Map No. 140040, 1956 Map No. 140041 Stonykill Environmental Education Center, Baxtertown Woods WMA Beacon city (64%), Fishkill (56%), Marlborough (24%), Newburgh city (3%), Newburgh (12%), Poughkeepsie (17%), Wappinger (60%)
Current Warwick GeoPDF Map
1943 Map No. 140047, 1957 Map No. 136991, 1957 Map No. 140048, 1957 Map No. 140049 NA Chester (75%), Goshen (19%), Warwick (28%)
Current Wawayanda GeoPDF Map
NA NA Warwick (6%)
Current West Point GeoPDF Map
1941 Map No. 140199, 1947 Map No. 140198, 1957 Map No. 137014, 1957 Map No. 140200, 1957 Map No. 140201, 1957 Map No. 140202 NA Beacon city (36%), Cornwall (8%), Fishkill (29%), Highlands (21%), New Windsor (0%), Newburgh city (4%), Philipstown (63%), Putnam Valley (7%)
Current Wurtsboro GeoPDF Map
1943 Map No. 140385, 1943 Map No. 140386, 1969 Map No. 137046, 1969 Map No. 137047, 1969 Map No. 140387 Wurtsboro Ridge State Forest, Roosa Gap State Forest, Bashakill WMA Crawford (10%), Mamakating (36%), Mount Hope (3%), Shawangunk (1%), Wallkill (25%)

Orleans County

PDF (50-60 MB Download) Historical USGS Topo Maps State Lands (Links to DEC Website) Towns (Percent of Town’s Area)
Current Albion GeoPDF Map
1950 Map No. 136565, 1950 Map No. 136566, 1950 Map No. 137062, 1952 Map No. 136570 NA Albion (64%), Barre (64%), Elba (7%), Oakfield (1%)
Current Ashwood GeoPDF Map
1950 Map No. 136715, 1950 Map No. 136716, 1952 Map No. 136717 NA Albion (1%), Carlton (31%), Gaines (26%), Ridgeway (30%), Yates (41%)
Current Brockport GeoPDF Map
1934 Map No. 123100, 1952 Map No. 123101, 1952 Map No. 123102, 1952 Map No. 123103, 1971 Map No. 123104, 1971 Map No. 123106 NA Bergen (9%), Clarendon (2%), Clarkson (38%), Murray (1%), Ogden (11%), Riga (1%), Sweden (99%)
Current Hamlin GeoPDF Map
1932 Map No. 139631, 1935 Map No. 129677, 1935 Map No. 129678, 1952 Map No. 129679, 1952 Map No. 129680, 1971 Map No. 129681, 1978 Map No. 129682 Sandy Creek Fishing Access Parking, Sandy Creek Wetlands Clarkson (44%), Hamlin (73%), Kendall (4%), Murray (2%)
Current Holley GeoPDF Map
1950 Map No. 129882, 1950 Map No. 129883, 1950 Map No. 137254 NA Albion (5%), Barre (5%), Bergen (2%), Byron (7%), Clarendon (98%), Elba (1%), Murray (43%)
Current Kendall GeoPDF Map
1951 Map No. 130013, 1951 Map No. 130014, 1978 Map No. 130015 NA Albion (0%), Carlton (5%), Gaines (5%), Kendall (96%), Murray (55%)
Current Kent GeoPDF Map
1951 Map No. 130020 NA Albion (4%), Carlton (64%), Gaines (69%)
Current Knowlesville GeoPDF Map
1950 Map No. 130142, 1950 Map No. 130143, 1950 Map No. 255469 Oak Orchard WMA Alabama (3%), Albion (26%), Barre (31%), Oakfield (6%), Ridgeway (17%), Shelby (42%)
Current Lyndonville GeoPDF Map
1951 Map No. 130384, 1951 Map No. 130385 NA Hartland (13%), Ridgeway (34%), Somerset (22%), Yates (59%)
Current Medina GeoPDF Map
1949 Map No. 130524, 1951 Map No. 130527 Tonawanda WMA Alabama (4%), Hartland (9%), Ridgeway (20%), Royalton (16%), Shelby (58%)

Oswego County

PDF (50-60 MB Download) Historical USGS Topo Maps State Lands (Links to DEC Website) Towns (Percent of Town’s Area)
Current Baldwinsville GeoPDF Map
1948 Map No. 123393, 1957 Map No. 123394, 1957 Map No. 123395, 1973 Map No. 123400, 1973 Map No. 123401, 1973 Map No. 123402 Peter Scott Swamp Freshwater Wetlands, Three Rivers WMA, Seneca River Boat Launch Clay (11%), Granby (6%), Lysander (47%), Salina (0%), Schroeppel (18%), Van Buren (23%)
Current Boylston Center GeoPDF Map
1959 Map No. 123366, 1959 Map No. 123367, 1959 Map No. 123368 Winona State Forest, Littlejohn WMA Boylston (67%), Lorraine (40%), Redfield (7%), Worth (13%)
Current Brewerton GeoPDF Map
1940 Map No. 122993, 1957 Map No. 122998, 1957 Map No. 122999, 1973 Map No. 123000, 1973 Map No. 123001 Seneca River Waterway Access, Hamlin Marsh WMA Cicero (11%), Clay (81%), Hastings (3%), Lysander (2%), Salina (5%), Schroeppel (14%), West Monroe (1%)
Current Camden West GeoPDF Map
1943 Map No. 123170, 1960 Map No. 123168, 1960 Map No. 123169, 1960 Map No. 137142 Oneida FP Detached Parcel, Stone Barn State Forest Amboy (1%), Camden (54%), Constantia (2%), Vienna (24%)
Current Central Square GeoPDF Map
1956 Map No. 122904, 1956 Map No. 122906, 1956 Map No. 122907, 1956 Map No. 122908, 1956 Map No. 122909 Three Mile Bay WMA Clay (4%), Hastings (76%), Palermo (24%), Schroeppel (17%), West Monroe (1%)
Current Cicero GeoPDF Map
1940 Map No. 137611, 1957 Map No. 137615, 1957 Map No. 137616, 1973 Map No. 137617, 1973 Map No. 137618, 1973 Map No. 137619, 1973 Map No. 137620 Unclassifed, Cicero Swamp WMA, Three Mile Bay WMA Cicero (72%), Constantia (14%), West Monroe (15%)
Current Cleveland GeoPDF Map
1941 Map No. 137657, 1941 Map No. 137658, 1957 Map No. 137662, 1957 Map No. 137663, 1973 Map No. 137178, 1973 Map No. 137664, 1973 Map No. 137665 Training Academy, Unclassifed, Oneida Lake Boat Launch, Cicero Swamp WMA, Oneida Fish Hatchery Cicero (11%), Constantia (34%), Sullivan (19%), Vienna (1%)
Current Dugway GeoPDF Map
1957 Map No. 137912, 1957 Map No. 137913, 1957 Map No. 137914, 1957 Map No. 137915 Happy Valley WMA Albion (40%), Amboy (0%), Hastings (1%), Mexico (0%), Parish (79%), Richland (3%)
Current Ellisburg GeoPDF Map
1958 Map No. 137320, 1958 Map No. 138208 North Pond Sandy Creek Waterway Access, Little Sandy Creek Fishing Access, Lakeview WMA Ellisburg (23%), Sandy Creek (29%)
Current Fulton GeoPDF Map
1955 Map No. 138083, 1955 Map No. 138087, 1955 Map No. 138198, 1955 Map No. 138199 Curtiss Gale WMA Fulton city (100%), Granby (72%), Hannibal (8%), Ira (1%), Minetto (5%), Oswego (1%), Volney (24%)
Current Hannibal GeoPDF Map
1943 Map No. 129704, 1954 Map No. 129707, 1954 Map No. 129708, 1978 Map No. 129709 NA Granby (4%), Hannibal (92%), Ira (5%), Oswego (8%), Sterling (14%), Victory (1%)
Current Lysander GeoPDF Map
1955 Map No. 130408, 1955 Map No. 130409, 1955 Map No. 137424 Three Rivers WMA Cato (13%), Granby (16%), Ira (15%), Lysander (47%), Van Buren (20%)
Current Mallory GeoPDF Map
1957 Map No. 130423, 1957 Map No. 130424, 1957 Map No. 130425 Three Mile Bay WMA, Oneida Fish Hatchery Amboy (1%), Constantia (12%), Hastings (14%), Parish (8%), West Monroe (83%)
Current Mexico GeoPDF Map
1956 Map No. 130542, 1956 Map No. 130543 Grindstone Creek Fishing Access Hastings (7%), Mexico (78%), Palermo (15%), Parish (8%), Richland (9%)
Current New Haven GeoPDF Map
1956 Map No. 130804, 1956 Map No. 130805 NA Mexico (10%), New Haven (82%), Palermo (23%), Scriba (8%), Volney (23%)
Current Orwell GeoPDF Map
1943 Map No. 135904, 1959 Map No. 135905, 1959 Map No. 135906, 1959 Map No. 137491, 1959 Map No. 137492 Stave Mill State Forest, Salmon River North Branch Fishing Access, Salmon River Fishing Access, Lower Salmon River State Forest, Chateaugay State Forest, Hall Island State Forest, Salmon River State Forest, Salmon River Falls Unique Area, Trout Brook State Forest, Salmon River Reservoir Boat Launch, Salmon River Fish Hatchery Albion (8%), Boylston (15%), Orwell (86%), Redfield (8%), Williamstown (4%)
Current Oswego East GeoPDF Map
1954 Map No. 135924, 1954 Map No. 135925, 1954 Map No. 135926 NA Minetto (87%), Oswego city (53%), Oswego (2%), Scriba (79%), Volney (19%)
Current Oswego West GeoPDF Map
1954 Map No. 135927, 1954 Map No. 135928, 1954 Map No. 135929, 1954 Map No. 137498 NA Minetto (8%), Oswego city (47%), Oswego (90%), Sterling (3%)
Current Panther Lake GeoPDF Map
1959 Map No. 135963, 1959 Map No. 135964, 1959 Map No. 136770 Klondike State Forest, Oneida Fish Hatchery Amboy (42%), Camden (1%), Constantia (38%)
Current Pennellville GeoPDF Map
1956 Map No. 128960, 1956 Map No. 128961, 1956 Map No. 128962, 1956 Map No. 128963 Peter Scott Swamp Freshwater Wetlands Granby (1%), Palermo (37%), Schroeppel (51%), Volney (34%)
Current Pulaski GeoPDF Map
1956 Map No. 129192, 1956 Map No. 129193, 1956 Map No. 129194, 1956 Map No. 136834, 1956 Map No. 136836 Salmon River Fishing Access, Grindstone Creek Fishing Access, Salmon River Fishing Access, Deer Creek Marsh WMA Mexico (8%), Richland (54%), Sandy Creek (11%)
Current Redfield GeoPDF Map
1942 Map No. 136039, 1960 Map No. 136040, 1960 Map No. 136041, 1960 Map No. 136042, 1960 Map No. 136854 Stave Mill State Forest, Salmon River North Branch Fishing Access, Salmon River Fishing Access, Battle Hill State Forest, Hall Island State Forest, O’hara State Forest, Salmon River State Forest, West Osceola State Forest, Line Brook State Forest, Mill Stream Fishing Access, Mill Stream Fishing Access Osceola (6%), Redfield (52%)
Current Richland GeoPDF Map
1958 Map No. 136067, 1958 Map No. 136068, 1958 Map No. 136069 Salmon River Fishing Access, Lower Salmon River State Forest, Altmar State Forest, Sandy Creek State Forest, Trout Brook State Forest, Trout Brook Parking Area Albion (35%), Boylston (2%), Orwell (14%), Richland (35%), Sandy Creek (24%)
Current Sandy Creek GeoPDF Map
1942 Map No. 129339, 1958 Map No. 129341, 1958 Map No. 129342, 1958 Map No. 129343, 1958 Map No. 129344 Lindsey Creek Fishing Access, Little Sandy Creek Fishing Access, Winona State Forest Boylston (16%), Ellisburg (31%), Lorraine (10%), Sandy Creek (37%)
Current Texas GeoPDF Map
1955 Map No. 136947, 1955 Map No. 139977, 1955 Map No. 139978 NA Mexico (4%), New Haven (18%), Scriba (1%)
Current West Of Texas GeoPDF Map
NA NA Scriba (12%)
Current Westdale GeoPDF Map
1946 Map No. 140228, 1959 Map No. 137018, 1959 Map No. 140230, 1959 Map No. 140231 West Branch Fish Creek Fishing Access, Florence Hill State Forest, Tri-County State Forest, Mad River State Forest, O’hara State Forest, Orton Hollow State Forest, West Osceola State Forest Amboy (5%), Camden (12%), Florence (46%), Osceola (1%), Redfield (7%), Williamstown (33%)
Current Williamstown GeoPDF Map
1960 Map No. 137031, 1960 Map No. 140303, 1960 Map No. 140304 Kasoag State Forest, Orton Hollow State Forest, Stone Hill State Forest, Happy Valley WMA, Salmon River Fish Hatchery, Fish Creek Fishing Access, West Branch Fish Creek Fishing Access Albion (17%), Amboy (50%), Parish (5%), Redfield (0%), Williamstown (63%)
Current Worth Center GeoPDF Map
1960 Map No. 137044, 1960 Map No. 137045, 1960 Map No. 140382, 1960 Map No. 140383 Tug Hill State Forest, Sears Pond State Forest, Littlejohn WMA Montague (14%), Osceola (1%), Redfield (26%), Worth (44%)

Otsego County

PDF (50-60 MB Download) Historical USGS Topo Maps State Lands (Links to DEC Website) Towns (Percent of Town’s Area)
Current Brookfield GeoPDF Map
1943 Map No. 123110, 1943 Map No. 123111 Mount Hunger State Forest, Gorton Lake State Forest, Charles E. Baker State Forest, Brookfield Railroad State Forest, Beaver Creek State Forest Bridgewater (4%), Brookfield (63%), Edmeston (6%), Plainfield (0%), Sangerfield (5%)
Current Charlotteville GeoPDF Map
1943 Map No. 122912, 1943 Map No. 122913, 1943 Map No. 122916, 1943 Map No. 137167 Schenevus Creek Fishing Access, Lutheranville State Forest, Clapper Hollow State Forest Decatur (1%), Harpersfield (6%), Jefferson (17%), Summit (38%), Worcester (65%)
Current Cooperstown GeoPDF Map
1943 Map No. 137188, 1943 Map No. 137189, 1943 Map No. 137720, 1943 Map No. 137721 NA Hartwick (27%), Middlefield (37%), Otsego (35%), Westford (0%)
Current East Springfield GeoPDF Map
1943 Map No. 138023, 1943 Map No. 138024 NA Cherry Valley (34%), Middlefield (19%), Minden (1%), Otsego (0%), Roseboom (4%), Springfield (57%), Stark (3%)
Current Edmeston GeoPDF Map
1943 Map No. 137351, 1943 Map No. 138041, 1943 Map No. 138042 Texas School House State Forest, Basswood Pond State Forest, Butternut Creek Fishing Access Burlington (48%), Edmeston (34%), New Lisbon (29%), Pittsfield (13%)
Current Franklin GeoPDF Map
1943 Map No. 138167, 1943 Map No. 138168, 1943 Map No. 138171, 1943 Map No. 138172 NA Franklin (38%), Masonville (1%), Otego (4%), Sidney (40%), Unadilla (1%), Walton (2%)
Current Gilbertsville GeoPDF Map
1943 Map No. 129515, 1943 Map No. 129519 NA Butternuts (67%), Guilford (0%), Morris (2%), Otego (0%), Unadilla (40%)
Current Guilford GeoPDF Map
1943 Map No. 129655, 1943 Map No. 129656, 1943 Map No. 129657 South Hill State Forest Butternuts (10%), Guilford (58%), Norwich (27%), Unadilla (5%)
Current Hartwick GeoPDF Map
1943 Map No. 129821, 1943 Map No. 129822, 1943 Map No. 137246, 1943 Map No. 137247 Hartwick State Forest, Texas School House State Forest, Basswood Pond State Forest Burlington (30%), Exeter (0%), Hartwick (46%), New Lisbon (19%), Otsego (24%)
Current Holmesville GeoPDF Map
1943 Map No. 129732, 1943 Map No. 129733, 1943 Map No. 129885, 1943 Map No. 137255 Whaupaunaucau State Forest, Skinner Hill State Forest, Hunts Pond State Forest, Ambler State Forest, Unadilla River Fishing Access Butternuts (3%), Morris (0%), New Berlin (63%), North Norwich (37%), Norwich (32%)
Current Milford GeoPDF Map
1943 Map No. 130570, 1943 Map No. 130571, 1943 Map No. 130573, 1943 Map No. 137449 Crumhorn Mountain WMA, Hooker Mountain State Forest, Susquehanna State Forest, Arnold Lake State Forest, Goodyear Lake Waterway Access Hartwick (10%), Maryland (28%), Middlefield (9%), Milford (61%), Westford (6%)
Current Millers Mills GeoPDF Map
1943 Map No. 130585, 1943 Map No. 130586 Herkimer FP Detached Parcel Columbia (86%), Frankfort (3%), German Flatts (23%), Litchfield (24%), Richfield (19%), Winfield (9%)
Current Morris GeoPDF Map
1943 Map No. 130674, 1943 Map No. 130675, 1943 Map No. 137385 NA Laurens (40%), Morris (41%), New Lisbon (32%), Otego (0%), Pittsfield (21%)
Current Mount Vision GeoPDF Map
NA Milford State Forest, Arnold Lake State Forest Hartwick (18%), Laurens (54%), Milford (28%), New Lisbon (20%), Oneonta (10%)
Current New Berlin North GeoPDF Map
NA Charles E. Baker State Forest Brookfield (3%), Columbus (56%), Edmeston (43%), New Berlin (8%), Pittsfield (23%)
Current New Berlin South GeoPDF Map
NA Morris Reservoir Waterway Access, General Jacob Morris State Forest, Wagner Farm State Forest, Calhoun Creek State Forest, Hunts Pond State Forest Butternuts (12%), Morris (55%), New Berlin (23%), Pittsfield (43%)
Current Oneonta GeoPDF Map
1943 Map No. 128915, 1943 Map No. 128916, 1943 Map No. 128917, 1943 Map No. 128920, 1943 Map No. 128921, 1943 Map No. 137485 Charlotte River Fishing Access Davenport (11%), Franklin (18%), Laurens (3%), Meredith (4%), Milford (2%), Oneonta city (100%), Oneonta (76%), Otego (1%)
Current Otego GeoPDF Map
1943 Map No. 135930, 1943 Map No. 135931, 1943 Map No. 135932 NA Butternuts (9%), Franklin (2%), Laurens (3%), Morris (2%), Oneonta (8%), Otego (95%), Sidney (0%), Unadilla (2%)
Current Richfield Springs GeoPDF Map
1943 Map No. 136062, 1943 Map No. 136063 Maumee Swamp Columbia (0%), Middlefield (2%), Otsego (34%), Richfield (15%), Springfield (35%), Warren (33%)
Current Schenevus GeoPDF Map
1943 Map No. 129435, 1943 Map No. 129436, 1943 Map No. 129439, 1943 Map No. 136899 Schenevus Creek Fishing Access, Hooker Mountain WMA, South Hill State Forest, Hooker Mountain State Forest Davenport (5%), Decatur (1%), Harpersfield (2%), Maryland (61%), Westford (25%), Worcester (22%)
Current Schuyler Lake GeoPDF Map
1943 Map No. 136108, 1943 Map No. 136109, 1943 Map No. 136905 Exeter State Forest, Basswood Pond State Forest Burlington (4%), Columbia (1%), Exeter (85%), Otsego (7%), Plainfield (1%), Richfield (63%), Warren (0%)
Current Sidney GeoPDF Map
1943 Map No. 136165, 1943 Map No. 136166, 1943 Map No. 136167 Pine Hill State Forest, South Hill State Forest, Oak Ridge State Forest Afton (3%), Bainbridge (67%), Guilford (24%), Masonville (9%), Sidney (10%), Unadilla (12%)
Current South Valley GeoPDF Map
1943 Map No. 136210, 1943 Map No. 136211, 1943 Map No. 136212, 1943 Map No. 136929 Bear Swamp State Forest, Cherry Valley State Forest, Decatur State Forest, Honey Hill State Forest, Maple Valley State Forest, R. Milton Hick Memorial State Forest Decatur (95%), Richmondville (4%), Roseboom (58%), Seward (17%), Sharon (6%), Summit (0%), Worcester (13%)
Current Sprout Brook GeoPDF Map
1943 Map No. 136932, 1943 Map No. 139853, 1943 Map No. 139854 Cherry Valley State Forest, Honey Hill State Forest Canajoharie (24%), Cherry Valley (66%), Minden (9%), Roseboom (9%), Sharon (26%)
Current Unadilla GeoPDF Map
1943 Map No. 139426, 1943 Map No. 139427, 1943 Map No. 139433, 1943 Map No. 139434 Pine Hill State Forest Masonville (20%), Sidney (50%), Unadilla (41%)
Current Unadilla Forks GeoPDF Map
1943 Map No. 139435, 1943 Map No. 139436 Plainfield State Forest, Basswood Pond State Forest Bridgewater (0%), Brookfield (1%), Burlington (18%), Edmeston (16%), Exeter (15%), Plainfield (97%), Richfield (2%), Winfield (19%)
Current Van Hornesville GeoPDF Map
1943 Map No. 139474, 1943 Map No. 139475 Otsquago State Forest, Ohisa State Forest, Van Hornesville Fish Hatchery Danube (69%), Little Falls (7%), Minden (2%), Springfield (6%), Stark (90%), Warren (0%)
Current West Davenport GeoPDF Map
1943 Map No. 140148, 1943 Map No. 140149, 1943 Map No. 140150 Davenport FP Detached Parcel, Susquehanna River Fishing Access Davenport (49%), Kortright (1%), Maryland (11%), Meredith (30%), Milford (10%), Oneonta (6%)
Current Westford GeoPDF Map
1943 Map No. 137023, 1943 Map No. 140253, 1943 Map No. 140254 Maple Valley State Forest, R. Milton Hick Memorial State Forest, Roseboom State Forest Decatur (3%), Middlefield (34%), Roseboom (29%), Westford (68%)

June 26, 2016 Afternoon

Good afternoon! Sunny and 86 degrees in Stratford. There is a south breeze at 9 mph. The dew point is 57 degrees. It needs to be 10 to 20 degrees warmer to be the perfect temperature for the Potholers. I would rank the weather as an 8 out of ten for the Potholers. I could have spent the rest of the afternoon at the Potholers if I didn’t have to head home unpack and clean up my truck.

I know as I head home, I’ll eventually close the windows then turn on the air conditioning. As I drive into the city, the air conditioner will automatically start ramping up and will be absurdly hot in the city.

This afternoon will be mostly sunny, with a high near 87. Six degrees above normal. Southwest wind 8 to 10 mph. The record high of 99 was set in 1952.

Tonight the sun will set at 8:42 pm with dusk around 9:17 pm, which is exactly the same as than yesterday. Today will have 15 hours and 21 minutes of daylight, a decrease of 25 seconds over yesterday.

Tonight will be partly cloudy, with a low around 60. Typical for tonight. South wind around 7 mph. The record low of 45 occured back in 1970.

On this day in 1963, U.S. President John F. Kennedy gave his “Ich bin ein Berliner” speech, underlining the support of the United States for democratic West Germany shortly after Soviet-supported East Germany erected the Berlin Wall. Also, The Universal Product Code is scanned for the first time in 1974 to sell a package of Wrigley’s chewing gum at the Marsh Supermarket in Troy, Ohio.

There are 11 weeks until September 11th when the sun will be setting at 7:14 pm with dusk at 7:42 pm. The average high temperature is 74 degrees, with a record high of 98 in 1931.

At the point you’re reading this, I’m on my way back to Albany. I have to get home fairly early today, so I can get unpacked and the inside of my truck cleaned in preparation for the work trip on Monday. And leaving Friday morning for Moose River Plains for Independence Day Weekend. Hah! Life sure is rough for me. Racking up the miles. But winter will soon beΒ  here, and I’ll be driving only 30 miles a week, and bitching about the road salt. God, that is depressing. Maybe with global warming, it won’t ever get below freezing this winter. Last winter was nice, I was in a t-shirt camping on Christmas Day at Charles Baker State Forest in Madison County.

Last night I was lighting off fireworks at my campsite. Those $10 fountain packages at Shop-rite are kind of lame as the crappy fountains that are legal in New York. I think I’m going to have to buy some real fireworks like Roman Candles the next time I’m in Pennsylvania, and save them for some place like Moose River Plains or Powley Place, where I can light them off with nobody caring, and still have a good view of them. Haha. Hopefully it won’t be so dry that I accidentally burn down the area, although things are still pretty charred at Powley Place.

I’m shocked to see all that charred ground along the old East Branch of the Sacanadaga River at Powley Place, but I can imagine all those grasses get pretty dry in the spring. I think I vaguely remember reading about the wildfire in the newspapers a while back but I want to read up again after seeing the charred ground. It’s kind of shocking to see the black ground where normally tall green marsh grass. If the fire occurred before the road opened in late May, I wonder if anyone noticed the fire before it burned itself out. Probably wasn’t human caused with the road closed in the spring and three miles from the gate. I took some pic and will post them later.

Camping out on the sand plains means excellent views of the stars, especially when I dim the lights, as IΒ  did as the evening progressed. With the low humidity and the remote location I’m in, I think the stars were about as beautiful as I ever remember them being in New York. The colors from my various light strings are pretty but so are the stars and they aren’t like that at home.Β  Somebody slowed down quite a bit when they saw the colorful blinking lights. A lot of time that surprises people although it shouldn’t with all the time I’ve camped here over the years. Spring peepers were singing their songs last night and an owl was doing a lot of hooting.

The evenings were fairly cool or maybe just pleasant but the overnights I had to really climb under the covers. Maybe not heater weather, but gawd, it’s only a week to Independence Day. You expect to be sleeping above the covers and not dealing with temperatures dropping down to the mid 40s each night. But with crystal clear skies and low humid the mercury dropped pretty low. The days were pretty nice – warm but not humid so very comfortable. Black flies were pretty bad around dusk each day. When I was sitting at Stewart Landing beach a horse fly got my back, and I was dripping in blood bad enough that some random person asked if I was okay. Later in the evening I went to the Potholers and those bubbly waters ensured I was quite clean.

The Potholers were as enjoyable as ever. The water was fairly warm but cold enough to be refreshing. The water levels in the potholes were just perfect. Enough water to give you a good scrubbing but not dangerously or obnoxiously high. Warmer weather would have been nice for the Potholers but it was cool enough in the days for paddling Stewart Landing to West Canada Lake. I should have hiked somewheres like back to House Pond.

Saw lots of wildlife. Sitting in camp, a ruffled grouse kind of flew through camp, as grouse often do. I saw a bunch of turkeys driving through but didn’t get a good look to see if they were bearded. A doe was in the road on Saturday and I watched as a trooper almost hit it. I had to hit my brakes too.
It was a good weekend but it’s coming to an end much too quickly. But next weekend is a long one…

What Does 100 Miles from the Rapp Road Landfill Look Like?

About a year ago, in the Capital Region Solid Waste Plan, the City of Albany proposed creating a mega-solid waste authority to manage the Solid Waste for most of the Eastern Half of New York State. The plan specifically called for creating a regional authority — to service up to nine counties, and cover an area of 100 miles from the center point of the Rapp Road Landfill.

So I decided to make a map, and run some numbers…

Along the Lake

100 square miles equals roughly 30,500 square miles, with 21,500 sq miles in New York State and 9,000 sq miles out of State — primarily Southern Vermont, but also most of Western Massachussets, roughly 3/4th of Connecicut, and part of Pennsylvania in the Poconos.

In contrast to 30,500 square miles, Adirondack Park “Blue Line” covers roughly 9,100 sq miles in NY State and the Catskill Park “Blue Line” covers roughly 1,100 sq miles. That includes all land within those parks, publicly and privately owned.

That area, within NY State, covers an area were 2,957,993 persons reported residing in the 2010 census.

That is 2.95 million people, or almost 3 million people, a population greater then Manhattan at 1.5 million persons, and even Brooklyn at 2.5 million.

While no one town or city in the proposed in Authorty is particularly large — the City of Albany is the largest population center at 97,856 followed by Colonie at 81,591, the reality is those numbers add up, when you include the 406 towns and cities in NY State that fall within the 100 mile distance from the Rapp Road Landfill.

Large Cities and Towns in Proposed Authority.

Town /City Population
Albany city 97,856
Colonie town 81,591
Schenectady city 66,135
Utica city 62,235
Troy city 50,129
Poughkeepsie town 43,341
Cortlandt town 41,592
Monroe town 39,912
Clifton Park town 36,705
Yorktown town 36,081
Guilderland town 35,303
Carmel town 34,305
Rome city 33,725
Bethlehem town 33,656
Poughkeepsie city 32,736
Warwick town 32,065
Newburgh town 29,801
Glenville town 29,480
Rotterdam town 29,094

All Towns and Cities in NY State within 100 miles of Rapp Road Landfill.

Here is entire list of towns partially or wholely contained in the proposed jurisdiction of the Albany Solid Waste Authority (including large cities and towns listed above)…

Town /City Population Area (sq mi) Pop sq/mi
Albany city 97,856 21 4659.8
Colonie town 81,591 57 1431.4
Schenectady city 66,135 10 6613.5
Utica city 62,235 16 3889.7
Troy city 50,129 11 4557.2
Poughkeepsie town 43,341 31 1398.1
Cortlandt town 41,592 49 848.8
Monroe town 39,912 21 1900.6
Clifton Park town 36,705 50 734.1
Yorktown town 36,081 39 925.2
Guilderland town 35,303 58 608.7
Carmel town 34,305 40 857.6
Rome city 33,725 75 449.7
Bethlehem town 33,656 50 673.1
Poughkeepsie city 32,736 5 6547.2
Warwick town 32,065 105 305.4
Newburgh town 29,801 46 647.8
Glenville town 29,480 50 589.6
Rotterdam town 29,094 36 808.2
East Fishkill town 29,029 57 509.3
Newburgh city 28,866 4 7216.5
Middletown city 28,086 5 5617.2
Queensbury town 27,901 64 436.0
Wallkill town 27,426 62 442.4
Wappinger town 27,048 28 966.0
Saratoga Springs city 26,586 28 949.5
New Windsor town 25,244 36 701.2
Kingston city 23,893 8 2986.6
Peekskill city 23,583 5 4716.6
Montgomery town 22,606 51 443.3
New Hartford town 22,166 25 886.6
Fishkill town 22,107 32 690.8
Niskayuna town 21,781 15 1452.1
Hyde Park town 21,571 39 553.1
Halfmoon town 21,535 33 652.6
Somers town 20,434 32 638.6
Saugerties town 19,482 67 290.8
Whitestown town 18,667 27 691.4
Amsterdam city 18,620 6 3103.3
Milton town 18,575 35 530.7
Southeast town 18,404 34 541.3
Blooming Grove town 18,028 35 515.1
East Greenbush town 16,473 24 686.4
Wilton town 16,173 35 462.1
Cohoes city 16,168 4 4042.0
La Grange town 15,730 40 393.3
Gloversville city 15,665 5 3133.0
Beacon city 15,541 4 3885.3
Thompson town 15,308 87 176.0
Stony Point town 15,059 31 485.8
Malta town 14,765 31 476.3
Moreau town 14,728 43 342.5
Glens Falls city 14,700 3 4900.0
Beekman town 14,621 30 487.4
Shawangunk town 14,332 56 255.9
New Paltz town 14,003 34 411.9
Oneonta city 13,901 4 3475.3
Goshen town 13,687 44 311.1
Kent town 13,507 43 314.1
German Flatts town 13,258 34 389.9
Wawarsing town 13,157 133 98.9
Fallsburg town 12,870 79 162.9
Schodack town 12,794 63 203.1
Kingsbury town 12,671 40 316.8
Cornwall town 12,646 28 451.6
Highlands town 12,492 33 378.5
Lewisboro town 12,411 29 428.0
Ulster town 12,327 28 440.3
Mamakating town 12,085 98 123.3
North Greenbush town 12,075 18 670.8
Patterson town 12,023 32 375.7
Chester town 11,981 87 137.7
Chester town 11,981 25 479.2
Brunswick town 11,941 44 271.4
Putnam Valley town 11,809 42 281.2
Catskill town 11,775 64 184.0
Oneida city 11,393 22 517.9
Woodbury town 11,353 37 306.8
Red Hook town 11,319 40 283.0
Lloyd town 10,863 33 329.2
Plattekill town 10,499 35 300.0
Kirkland town 10,315 33 312.6
Watervliet city 10,254 1 10254.0
Herkimer town 10,175 32 318.0
Liberty town 9,885 80 123.6
Ballston town 9,776 30 325.9
Pleasant Valley town 9,672 33 293.1
Philipstown town 9,662 51 189.5
Rensselaer city 9,392 3 3130.7
Crawford town 9,316 40 232.9
Lenox town 9,122 36 253.4
Esopus town 9,041 41 220.5
Marcy town 8,982 33 272.2
North Elba town 8,957 156 57.4
Coxsackie town 8,918 38 234.7
Marlborough town 8,808 26 338.8
Johnstown city 8,743 4 2185.8
Dover town 8,699 56 155.3
New Scotland town 8,648 57 151.7
Sand Lake town 8,530 36 236.9
Kinderhook town 8,498 32 265.6
Pawling town 8,463 45 188.1
Waterford town 8,423 7 1203.3
Stillwater town 8,287 43 192.7
Deerpark town 7,901 67 117.9
Greenfield town 7,775 67 116.0
Schaghticoke town 7,679 51 150.6
Frankfort town 7,636 36 212.1
Rhinebeck town 7,548 39 193.5
Coeymans town 7,418 53 140.0
Rochester town 7,313 89 82.2
Wawayanda town 7,266 35 207.6
Norwich city 7,190 2 3595.0
Johnstown town 7,098 71 100.0
Mount Hope town 7,018 25 280.7
Hoosick town 6,924 63 109.9
Hudson city 6,713 2 3356.5
Hamilton town 6,690 41 163.2
Cairo town 6,670 60 111.2
Granville town 6,669 56 119.1
Cobleskill town 6,625 30 220.8
Corinth town 6,531 58 112.6
Mayfield town 6,495 64 101.5
Lee town 6,486 45 144.1
Fort Edward town 6,371 27 236.0
Hurley town 6,314 35 180.4
Verona town 6,293 69 91.2
Windsor town 6,274 93 67.5
Fort Ann town 6,190 111 55.8
Westmoreland town 6,138 43 142.7
Duanesburg town 6,122 71 86.2
Rosendale town 6,075 20 303.8
Claverack town 6,021 47 128.1
Woodstock town 5,884 67 87.8
Sidney town 5,774 50 115.5
Pittstown town 5,735 64 89.6
Gardiner town 5,713 43 132.9
Saratoga town 5,674 42 135.1
Marbletown town 5,607 55 101.9
Greene town 5,604 75 74.7
Walton town 5,576 97 57.5
Amsterdam town 5,566 30 185.5
Hamptonburgh town 5,561 26 213.9
Vienna town 5,440 95 57.3
Vernon town 5,408 37 146.2
Ghent town 5,402 45 120.0
Broadalbin town 5,260 39 134.9
Eaton town 5,255 45 116.8
Colesville town 5,232 79 66.2
Oneonta town 5,229 33 158.5
Mechanicville city 5,196 0
Delhi town 5,117 64 80.0
North Salem town 5,104 22 232.0
Northumberland town 5,087 32 159.0
Ticonderoga town 5,042 88 57.3
Little Falls city 4,946 3 1648.7
Greenwich town 4,942 44 112.3
Union Vale town 4,877 37 131.8
Moriah town 4,798 71 67.6
Nassau town 4,789 45 106.4
Washington town 4,741 58 81.7
Boonville town 4,555 72 63.3
Poestenkill town 4,530 32 141.6
Trenton town 4,498 43 104.6
Minisink town 4,490 23 195.2
Amenia town 4,436 43 103.2
Olive town 4,419 65 68.0
Paris town 4,411 31 142.3
Unadilla town 4,392 46 95.5
Minden town 4,297 51 84.3
Deerfield town 4,273 33 129.5
Bethel town 4,255 90 47.3
Greenport town 4,165 20 208.3
Charlton town 4,133 32 129.2
Chatham town 4,128 53 77.9
Warrensburg town 4,094 64 64.0
Athens town 4,089 28 146.0
Sherburne town 4,048 43 94.1
Whitehall town 4,042 58 69.7
Norwich town 3,998 42 95.2
Oxford town 3,901 60 65.0
Otsego town 3,900 59 66.1
Mohawk town 3,844 35 109.8
Stanford town 3,823 50 76.5
Floyd town 3,819 34 112.3
Argyle town 3,782 57 66.4
Rockland town 3,775 95 39.7
Middletown town 3,750 97 38.7
Middleburgh town 3,746 49 76.4
Greenville town 3,739 39 95.9
Greenville town 3,739 30 124.6
Canajoharie town 3,730 43 86.7
Livingston town 3,646 38 95.9
Perth town 3,646 26 140.2
Tuxedo town 3,624 49 74.0
Copake town 3,615 42 86.1
Neversink town 3,557 86 41.4
Galway town 3,545 45 78.8
Lake George town 3,515 32 109.8
Schuyler town 3,420 40 85.5
New Baltimore town 3,370 43 78.4
Westerlo town 3,361 58 57.9
White Creek town 3,356 48 69.9
Lake Luzerne town 3,347 54 62.0
Manheim town 3,334 29 115.0
Bainbridge town 3,308 34 97.3
Palatine town 3,240 41 79.0
Hancock town 3,224 161 20.0
Schoharie town 3,205 29 110.5
Otego town 3,115 45 69.2
Shandaken town 3,085 120 25.7
Sherrill city 3,071 2 1535.5
Callicoon town 3,057 48 63.7
Milford town 3,044 47 64.8
North East town 3,031 43 70.5
Annsville town 3,012 60 50.2
Madison town 3,008 41 73.4
Davenport town 2,965 52 57.0
Guilford town 2,922 61 47.9
Stephentown town 2,903 58 50.1
Afton town 2,851 46 62.0
Stockport town 2,815 13 216.5
Berne town 2,794 64 43.7
Hunter town 2,732 90 30.4
Durham town 2,725 49 55.6
Salem town 2,715 52 52.2
Florida town 2,696 51 52.9
Knox town 2,692 41 65.7
New Berlin town 2,682 46 58.3
Delaware town 2,670 35 76.3
Northampton town 2,670 34 78.5
St. Johnsville town 2,631 17 154.8
Green Island town 2,620 0
Richmondville town 2,610 30 87.0
Russia town 2,587 60 43.1
Sangerfield town 2,561 30 85.4
Brookfield town 2,545 78 32.6
Highland town 2,530 52 48.7
Glen town 2,507 39 64.3
Roxbury town 2,502 87 28.8
Pine Plains town 2,473 31 79.8
Lumberland town 2,468 49 50.4
Laurens town 2,424 42 57.7
Franklin town 2,411 81 29.8
Sanford town 2,407 91 26.5
Johnsburg town 2,395 206 11.6
Richfield town 2,388 32 74.6
Milan town 2,370 36 65.8
Easton town 2,336 63 37.1
Bolton town 2,326 90 25.8
New Lebanon town 2,305 35 65.9
Newport town 2,302 32 71.9
Hartford town 2,269 43 52.8
Stamford town 2,267 48 47.2
Worcester town 2,220 46 48.3
Marshall town 2,131 32 66.6
Grafton town 2,130 45 47.3
Princetown town 2,115 24 88.1
Middlefield town 2,114 63 33.6
Hartwick town 2,110 40 52.8
Stockbridge town 2,103 31 67.8
Winfield town 2,086 23 90.7
Colchester town 2,077 142 14.6
Esperance town 2,076 20 103.8
Hadley town 2,048 41 50.0
Stuyvesant town 2,027 26 78.0
Crown Point town 2,024 81 25.0
Cambridge town 2,021 36 56.1
Augusta town 2,020 27 74.8
Lincoln town 2,012 25 80.5
Providence town 1,995 45 44.3
Nelson town 1,980 44 45.0
Clermont town 1,965 19 103.4
Salisbury town 1,958 108 18.1
Germantown town 1,954 13 150.3
Western town 1,951 54 36.1
Carlisle town 1,948 34 57.3
Remsen town 1,929 36 53.6
Hillsdale town 1,927 48 40.1
Oppenheim town 1,924 56 34.4
Maryland town 1,897 51 37.2
Watson town 1,881 116 16.2
Berlin town 1,880 59 31.9
Morris town 1,878 39 48.2
Hebron town 1,853 56 33.1
Sharon town 1,846 39 47.3
Rensselaerville town 1,843 62 29.7
Edmeston town 1,826 44 41.5
Webb town 1,807 484 3.7
Plymouth town 1,804 42 43.0
Jackson town 1,800 37 48.6
Butternuts town 1,786 53 33.7
Leyden town 1,785 33 54.1
North Norwich town 1,783 28 63.7
Seward town 1,763 36 49.0
Fenner town 1,726 31 55.7
Root town 1,715 51 33.6
Deposit town 1,712 44 38.9
Canaan town 1,710 36 47.5
Windham town 1,703 45 37.8
Ashland town 1,695 25 67.8
Ephratah town 1,682 39 43.1
Kortright town 1,675 62 27.0
Gallatin town 1,668 39 42.8
Coventry town 1,655 48 34.5
Schroon town 1,654 141 11.7
Austerlitz town 1,654 48 34.5
Fairfield town 1,627 41 39.7
DeRuyter town 1,589 31 51.3
Little Falls town 1,587 22 72.1
Columbia town 1,580 35 45.1
Harpersfield town 1,577 42 37.5
Ancram town 1,573 42 37.5
Wright town 1,539 28 55.0
Forestport town 1,535 78 19.7
Meredith town 1,529 58 26.4
Petersburgh town 1,525 41 37.2
West Turin town 1,524 102 14.9
Bridgewater town 1,522 23 66.2
Tusten town 1,515 48 31.6
Litchfield town 1,513 30 50.4
Fulton town 1,442 65 22.2
Jefferson town 1,410 43 32.8
Horicon town 1,389 71 19.6
Lewis town 1,382 65 21.3
Charleston town 1,373 42 32.7
Cochecton town 1,372 37 37.1
Pittsfield town 1,366 38 35.9
Springfield town 1,358 45 30.2
Indian Lake town 1,352 266 5.1
Lebanon town 1,332 43 31.0
Smithville town 1,330 50 26.6
Hamden town 1,323 60 22.1
Masonville town 1,320 54 24.4
Westport town 1,312 66 19.9
Taghkanic town 1,310 40 32.8
Gilboa town 1,307 59 22.2
Andes town 1,301 112 11.6
Smithfield town 1,288 24 53.7
Smyrna town 1,280 42 30.5
Tompkins town 1,247 104 12.0
Lyonsdale town 1,227 70 17.5
Cherry Valley town 1,223 40 30.6
Thurman town 1,219 92 13.3
Edinburg town 1,214 67 18.1
Caroga town 1,205 54 22.3
Greig town 1,199 94 12.8
Elizabethtown town 1,163 83 14.0
Summit town 1,148 37 31.0
Warren town 1,143 38 30.1
Burlington town 1,140 45 25.3
New Lisbon town 1,114 44 25.3
Keene town 1,105 156 7.1
Steuben town 1,100 42 26.2
Otselic town 1,054 38 27.7
Preston town 1,044 35 29.8
Danube town 1,039 29 35.8
Fremont town 1,008 51 19.8
Ohio town 1,002 307 3.3
Exeter town 987 32 30.8
Columbus town 975 37 26.4
Georgetown town 974 40 24.4
Broome town 973 48 20.3
Jewett town 953 50 19.1
Hampton town 938 22 42.6
Plainfield town 915 29 31.6
Kingston town 889 7 127.0
McDonough town 886 39 22.7
Westford town 868 33 26.3
Day town 856 69 12.4
Forestburgh town 819 56 14.6
Minerva town 809 160 5.1
Lexington town 805 79 10.2
Pitcher town 803 28 28.7
Lake Pleasant town 781 198 3.9
Stony Creek town 767 83 9.2
Norway town 762 35 21.8
Stark town 757 31 24.4
Clinton town 737 38 19.4
Conesville town 734 40 18.4
Long Lake town 711 449 1.6
Roseboom town 711 33 21.5
Prattsville town 700 19 36.8
Hague town 699 80 8.7
Ava town 676 37 18.3
Wells town 674 177 3.8
Dresden town 652 54 12.1
Bovina town 633 44 14.4
Stratford town 610 76 8.0
Putnam town 609 35 17.4
Pharsalia town 593 39 15.2
Denning town 551 105 5.2
Bleecker town 533 59 9.0
Newcomb town 436 233 1.9
Hope town 403 41 9.8
Lincklaen town 396 26 15.2
Blenheim town 377 34 11.1
Decatur town 353 20 17.7
Inlet town 333 66 5.0
Arietta town 304 329 0.9
Halcott town 258 23 11.2
North Hudson town 240 185 1.3
Hardenburgh town 238 80 3.0
Benson town 192 83 2.3
Morehouse town 86 194 0.4
Total 2,957,993 21,462 386.0

Pine Cobble

Two weekends ago, I went for a hike up Pine Cobble outside Williamstown, MA. This is the first time I’ve really been hiking in the Berkshires, formally, and not just on the New York-Massachusetts line on the Taconic Crest Trail. That said, the Taconic Crest trails runs on such a high ridge compared to the rest of the Taconics, and is closer to the height of the Berkshires, that it is probably in the Berkshires and not the Taconics, regardless of where the state line may rest.

The Pine Cobble starts off a steep road that has the Pine Cobble private development on it. It’s not a gated community, but as close as one can get to it. The parking is limited here, with a lot for seven cars, so if it’s full, as it was on this beautiful Sunday morning on labor day, you will be forced to park on the shoulder.

There is a six-inch asphalt curb you have to jump to get on the grass sholder, but if you have a truck, it shouldn’t be a problem. They didn’t give me a ticket, and lots other did it, so I guess it’s legal. They do have a sign, just past the parking lot, as you go into the development, that says NO PARKING on ROADWAY and it’s posted, but downhill from the lot, seems okay.

Limited Parking

The trail head is very well signed. The entire trail is well worn, and the occassional Williamstown Trail Blazes makes it easy to follow the trail.

Pine Cobble Trail Entrance

Parts of the trail are either relatively smooth or steep and rocky. It’s called Pine Cobble, so you would expect to be walking on a lot of rock cobble. It’s not nice small stuff, but big enough that you have to keep a careful eye on where you step.

Rough on the Feet

Three quarters of the way to the top there is this oak tree with three shoots up that provides a perfect little pool where water accumulates throughout the year. It’s quite neat looking. Talking to other people, this is actually quite a common occurance with a certain type of oak.

Three Oaks form a Pool

A top Pine Cobble, looking at East Mountain.

East Mountain

You’ve almost made it to the top of Pine Cobble. Once you’ve checked it, make sure to take the trail up East Mountain for a 1/2 mile to get some awesome westerly views.

Trail Up East Mountain

Here is the summit of Pine Cobble. It’s not the most impressive summit, and indeed the best views are along the edges of Pine Cobble, where there are several to be enjoyed.

Summit

Looking down at North Adams from Pine Cobble. The city’s high rises are surrounded by the mountains that form Hoosic Valley where the river runs north through Williamstown, Pownal, Vermont, and ultimately Rensselear County, New York into the Hudson.

North Adams

Here is the Pownal Valley, where the Hoosic River heads up through the corner of Vermont and back into New York State.

Pownal Valley

West from Pine Cobble, you can see the last range of the Taconics / first of Berkshires, where Berlin Mountain and Mount Raimer. Also in the foreground is a little bit of Williamstown.

West

On East Mountain there are these exciting views of that same range, but with the addition of lots of bright white marble rock, cairns, and at least on this blue day, a deep blue sky.

Exciting Views

When you reach the top of East Mountain, there is sections of the Appalachian Trail that remind me a lot of the look of Albany Pine Bush, minus the sandy soils. The Berlin Mountain range in the distance pull some kind of emotion into my heart, just like looking at the Heldebergs from the Albany Pine Bush.

The Applachian Trail sign on East Mountain.

East Mountain at A.T.

At the Massachussets and Vermont (Green Mountain National Forest & Long Trail) border.

A.T. Log Book

A beautiful day for sure.

Looking East off Pine Cobble

Here is a map of the hike.