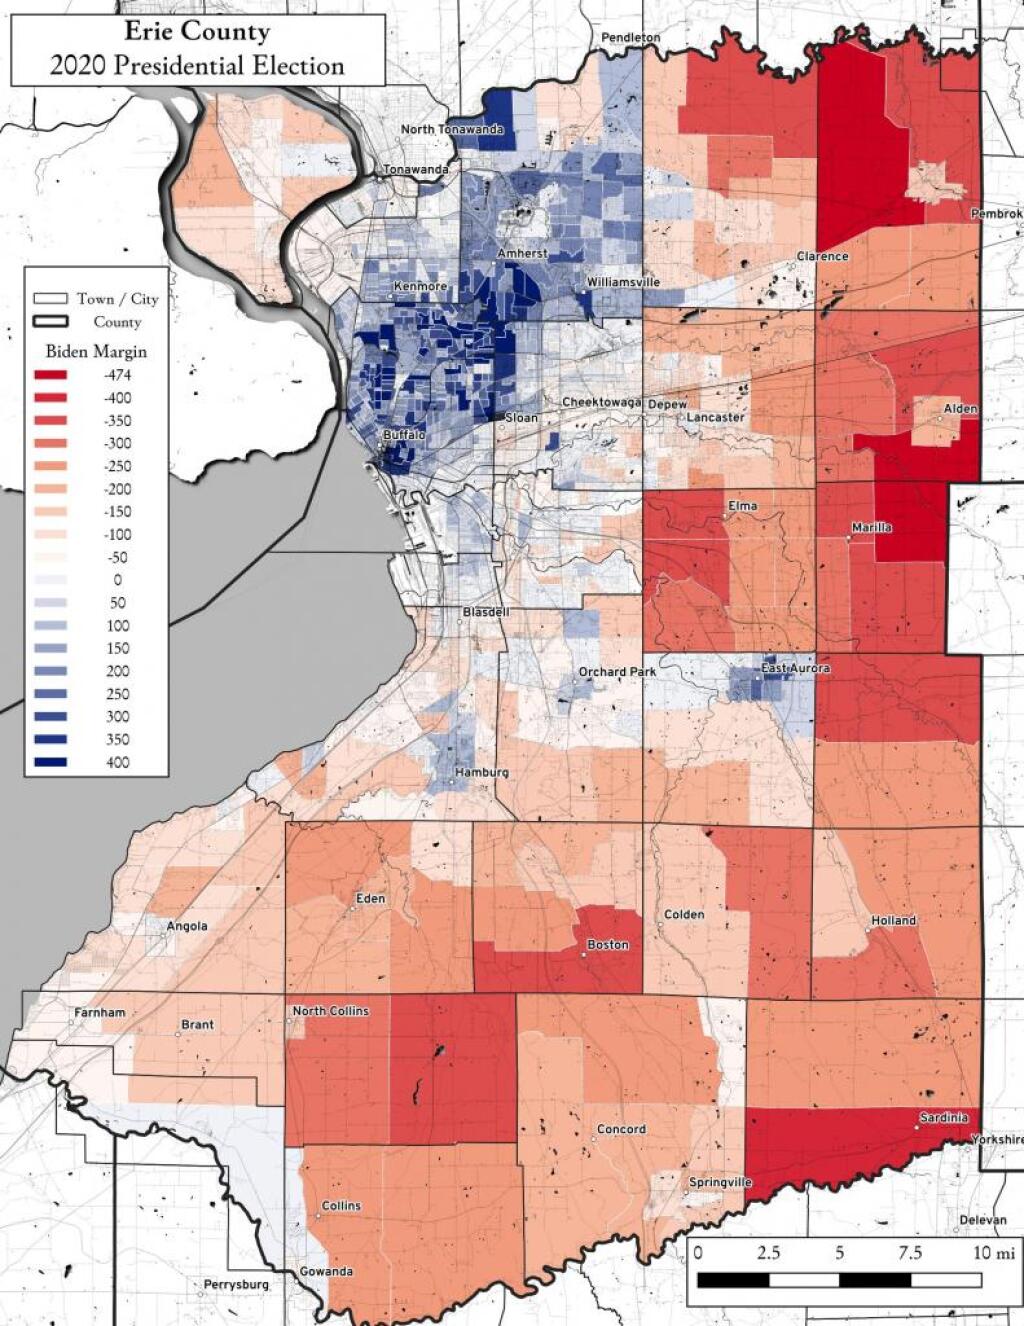
Amherst was pretty solidly blue in this year's presidential election.
Biden preformed quite well in Orchard Park and East Aurora, which shows how flawed of a candidate the previous incumbent was in the White House.
Trump did fairly well in Tonawanda all things considered but that isn't surprising as that area is quite conservative.
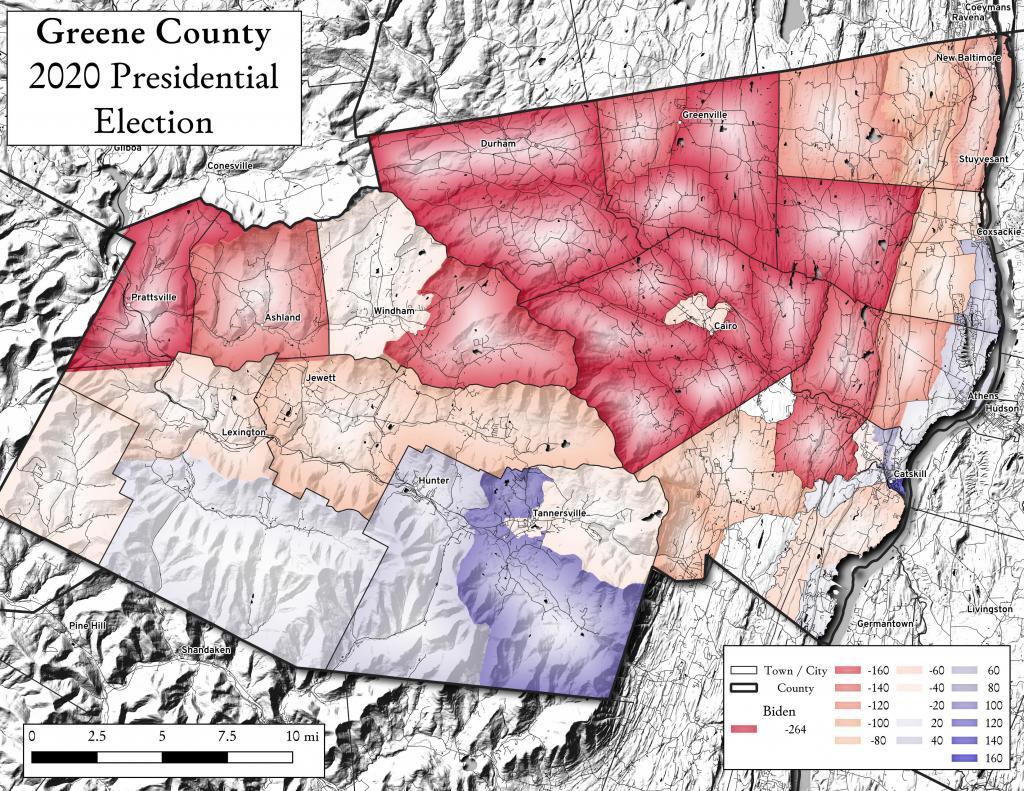
Continuing the ED-by-ED explorations of the 2020 Presidential Election, one can see much of Greene County is Trump Country. Biden did fairly along in Coxscakie and Catskill, along with some of the mountain towns.
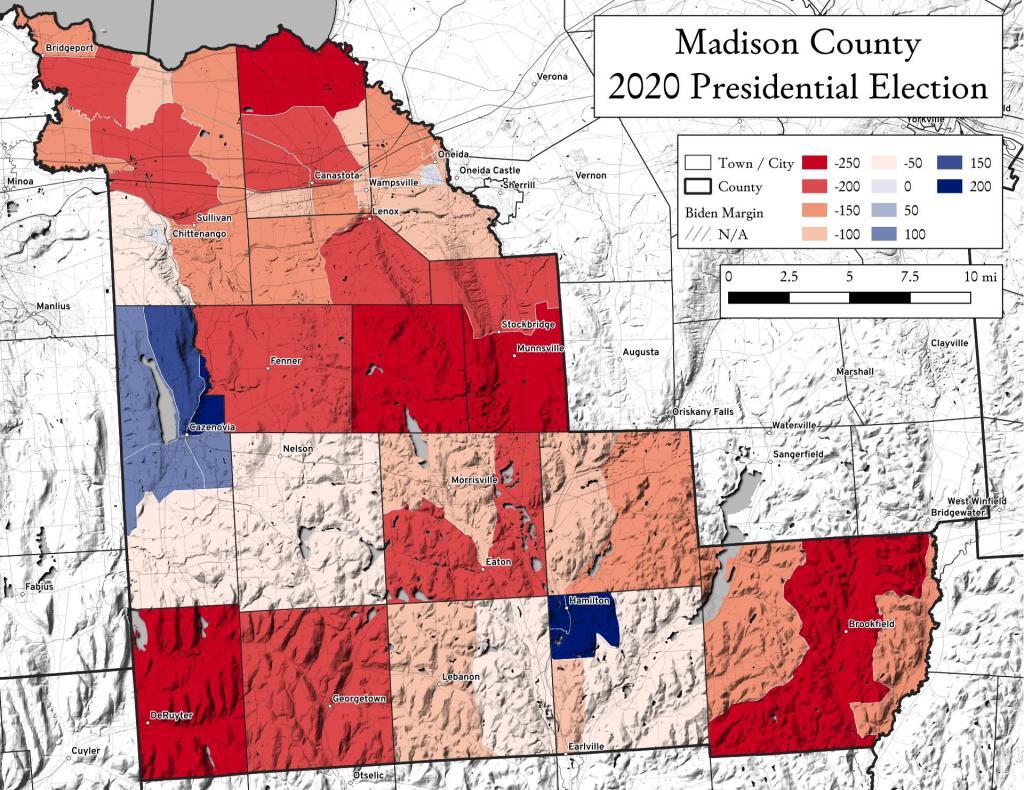
Madison County, NY went pretty red during the 2020 Presidential Election, which is not uncommon for rural counties across America. Notable exceptions is the area around Cazenovia and Hamilton (home to Colgate College) and the newer, wealthier election district on the outskirts of the City of Oneida.
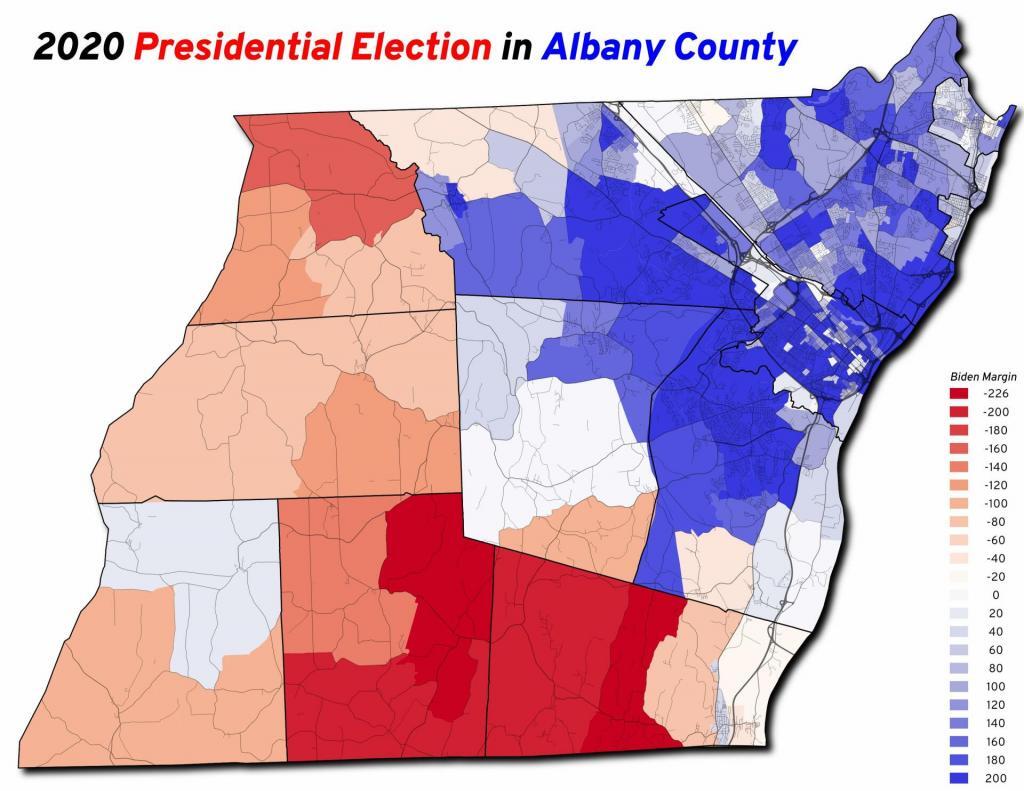
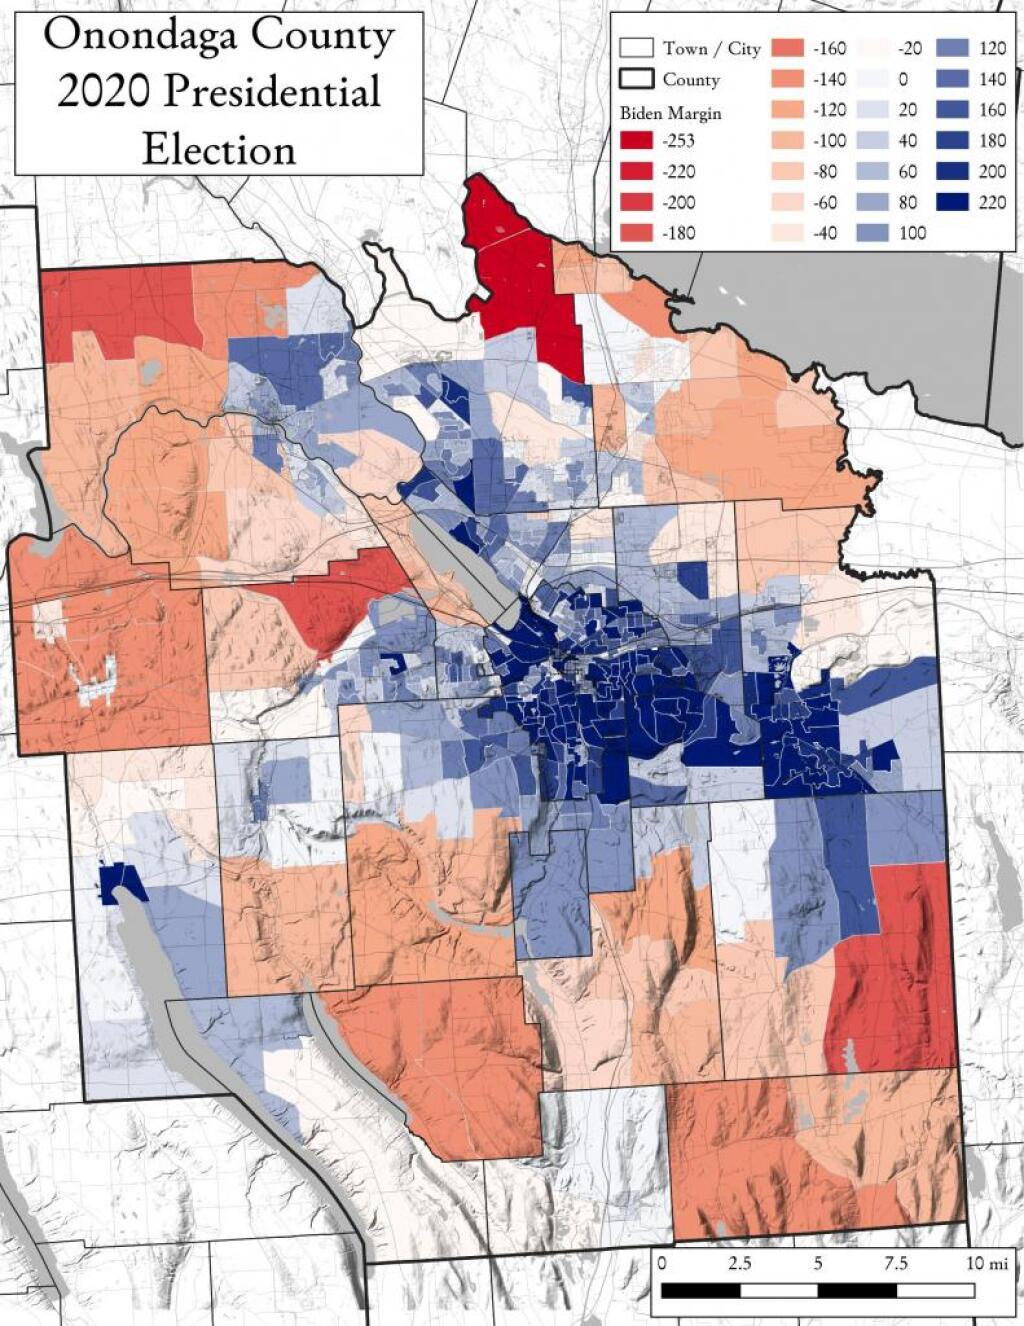
While I have made several maps of presidential and local elections in Albany County, I thought I should take a look at other counties now that I have figured out how to get this data from the Arc MapServer.
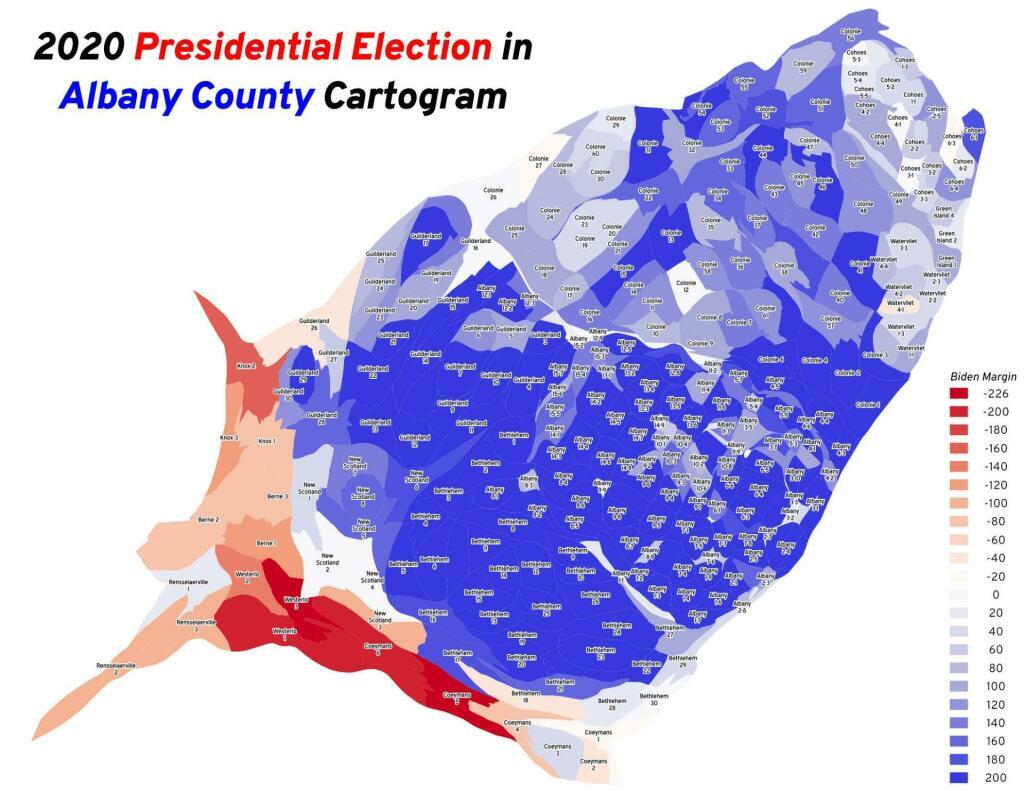
When you look at the map of the election districts that are red, you might think Albany County is redder then it really is. But truth be told, that redness is misleading as the red districts are rural and large in area but have close to the same population as many city election districts.
"How can that be? No one I know voted for Nixon."- Pauline Kael, 1972.
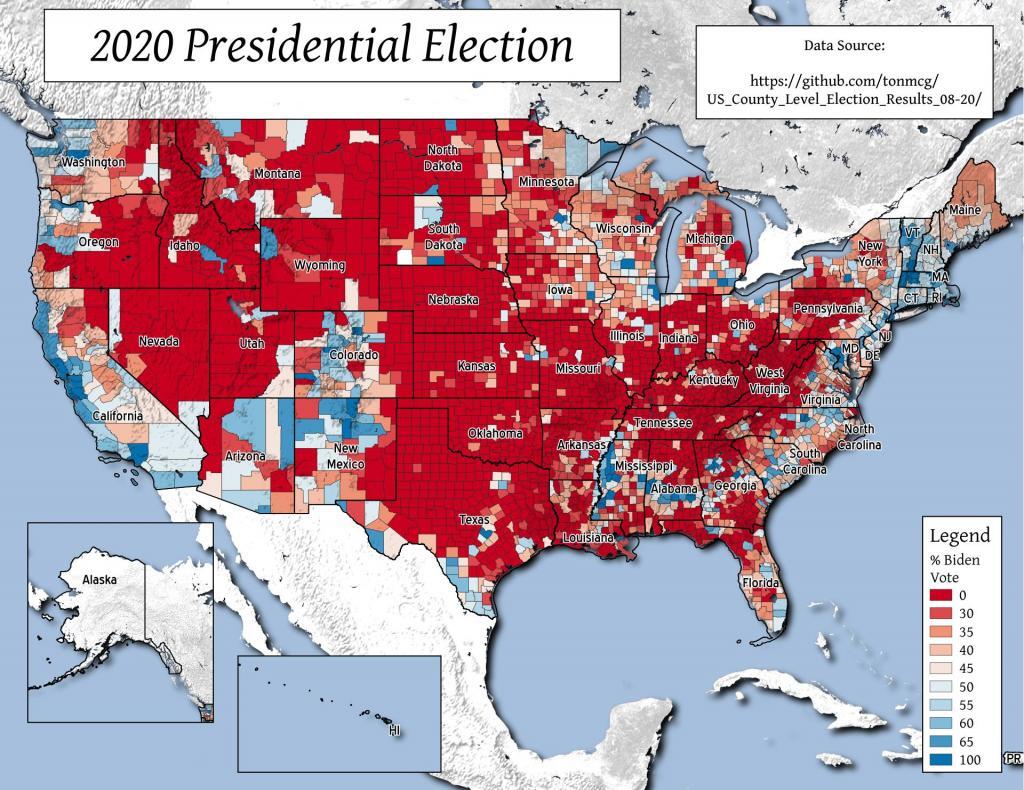
Biden got more then 70 percent of the vote in 85 counties, representing 18.8 million votes, while Trump got more then 70 percent of the vote in 1,418 counties representing 12.6 million votes.
This map would better expressed as a cartogram but it might take a lot of CPU power to make it happen.
Data Source: https://github.com/tonmcg/US_County_Level_Election_Results_08-20/