For sometime I’ve puzzled about what an election district is. If you reside in NY State, you probably live in an election district, and if you volunteer for a political campaign, you probably walked an election district. But you probably have no idea what an election district is.
Defining an Election District.
Article 15 of the Election Law, Section 4-100 defines an election district as:
4-100. Election districts; creation and alteration.
1. The State of New York shall be divided into election districts which shall be the basic political subdivision for purposes of registration and voting as provided in this chapter.
2. The creation, consolidation, division or alteration of election districts shall be done by the board of elections.
3. a. Each election district shall be in compact form and may not be partly within and partly without a ward, town, city, a village which has five thousand or more inhabitants and is wholly within one town, or a county legislative, assembly, senatorial or congressional district. Except as provided in paragraph b of this subdivision, election district boundaries, other than those boundaries which are coterminous with the boundaries of those political subdivisions mentioned in this paragraph, must be streets, rivers, railroad lines or other permanent characteristics of the landscape which are clearly visible to any person without the need to use any technical or mechanical device. An election district shall contain not more than nine hundred fifty registrants (excluding registrants in inactive status) or, with the approval of the county board of elections, not more than eleven hundred fifty registrants (excluding registrants in inactive status), but any election district may be divided for the convenience of the voters.
Simply said an election district is:
Defined by the County Board of Elections
Normally consists of fewer then 950 persons, but not necessarily equal in population
Has to be compact and drawn for the “convenience of the voters”
Must follow blocks, as defined by Census bureau (see below)
Must follow the boundaries of:
Congressional Districts
State Senate Districts
Assembly Districts
County Legislature Districts (in “reformed” county charter counties)
City Ward Districts (in cities)
Municipal Boundaries (city, town, village boundaries)
What is a Census Block?
All political districts in NY State are a series of Census Blocks, the smallest unit of population count by the Federal Government. Census blocks are defined as:
Census Blocks are smallest possible “city” blocks in area, bounded by:
Streets, Roads, Highways
Railroad lines
Water bodies
Rivers, Streams, Creeks
Municipal Boundaries (city, town, village boundaries)
Except for municipal boundaries, which are usually defined by historical surveys in a variety of measures, all other boundaries are clearly visible to anybody who visit the boundary.
What is a “Legislative District”?
A “legislative district”, e.g.
Congressional Districts
State Senate Districts
Assembly Districts
County Legislature Districts (in “reformed” county charter counties)
City Ward Districts (in cities)
… is a district that is defined by a grouping of Census Blocks.
Each legislative district under Reynolds v Simms must have an equal population or relatively close to an equal population. State constitutional and statutory restrictions allow for some variance in population, but differences of population greater then 10% in each district are not allowed.
Each legislative district is drawn based on often very detailed constitutional and statutory restrictions. Compact and contiguous restrictions are well known, but state constitutional and statutory restrictions are less known. State legislative districts are constitutionally prohibited from dividing towns but not cities and villages, except were the town is larger then maximum size of the districts.
Under the Civil Rights Act of 1965, it is unlawful to “draw” legislative districts in a way that reduces racial minority voting opportunities. In other words, it’s unlawful to break up groups of census blocks of a certain race. You can not split up a neighborhood that consists of many census blocks of African Americans or Asian into multiple legislative districts. All legislative districts are subject to review by the US Department of Justice to assure there is no dilution of minority votes.
Often legislative districts are drawn by partisan bodies with ideological agendas in mind. Usually when legislative districts are drawn, there is a lot of consideration of past election results and partisan enrollments. While it’s impossible to know how each census block will vote (as voting enrollment is broken down by election district), and census blocks change every ten years prior to reapportionment, one can make an educated guess on how people in a certain neighborhood will vote in the future.
Legislative districts are simply roughly equal population groupings of census blocks, taking in consideration of legal restrictions and political considerations.
How Election Districts Are Drawn.
After reapportionment of congress, the state legislature, county legislatures, and city wards has been approved by each body, Election Districts are re-drawn. All areas in the same congress, state senate, state assembly, county legislature, city ward, and municipality are grouped together.
If there less then 950 active voters in the resulting districts, then the district consists of those grouping of areas. Active voters are those who have voted in one election since the prior two gubernatorial elections. In 2012, a voter would have to vote once between 2006-2011 to be considered active. If a district consists of more then 950 active voters it must be broken up after the lines are drawn. There is no political advantage by breaking up common districts already drawn, so it’s more done as matter of convenience and simplicity.
Having more then 950 active voters one election district would lead to long lines at polling place, and would not provide for particularly useful election results for further analysis. The election law allows an election district to grow to 1,150 active voters between redistricting of legislative districts, however if it grows beyond that number, it must be split into multiple districts.
Election districts aren’t generally drawn for political purposes. All the potentially controversial work was done in drawing the various legislative districts, so drawing election districts really not that important, even if the results of elections are often used to predict future results.
Geographic Information Services (GIS) – Maps – Cartography
I am an amateur cartographer who designs maps and does a wide variety geospatial analysis using free and open-source geographic information software (GIS) and public sources of data to design quality maps, graphs, charts and datasets. I am looking for new and interesting projects to improve my skills, make connections and expand my portfolio.
Are you looking for my personal blog with it’s hiking, camping and outdoor recreation maps, along with a variety of charts, photos, and stories? Please visit andyarthur.org.
Mapping Avaliable
Tax/Property Mapping
High Resolution Aerial Photography
Recreational Maps – Hunting, Camping, Hiking
Georeference addresses using State Address Mapping service, plot them on a map
Wetlands, Topographic Contours, Land Cover
Compare historical aerial photos or maps to current photography
Web mapping using leaflet (HTML/Javascript file to embed on a website or use at home)
For most projects, there is no fee. I am looking for experience, references, mentors and connections in the geospatial community.
If you have a large project, let’s talk about it. I might be willing to do it for free, if it’s something really interesting or important like fighting suburban sprawl and pollution. I don’t a business or taxes set up, so I can’t really charge at this point.
How to get started?
Please send me an email describing the mapping or data project in as much detail as possible.
US Census – 2019 American Community Survey, 2020 US Census
NYS Tax and Assessment Rolls (2020)
NYSDOT Traffic Counts and Road Data
Historical Aerial Photography (primarily 1952, but earlier and later exist)
ArcGIS REST/Services and WMS Services from state and local agencies
LiDAR Elevation Profiles
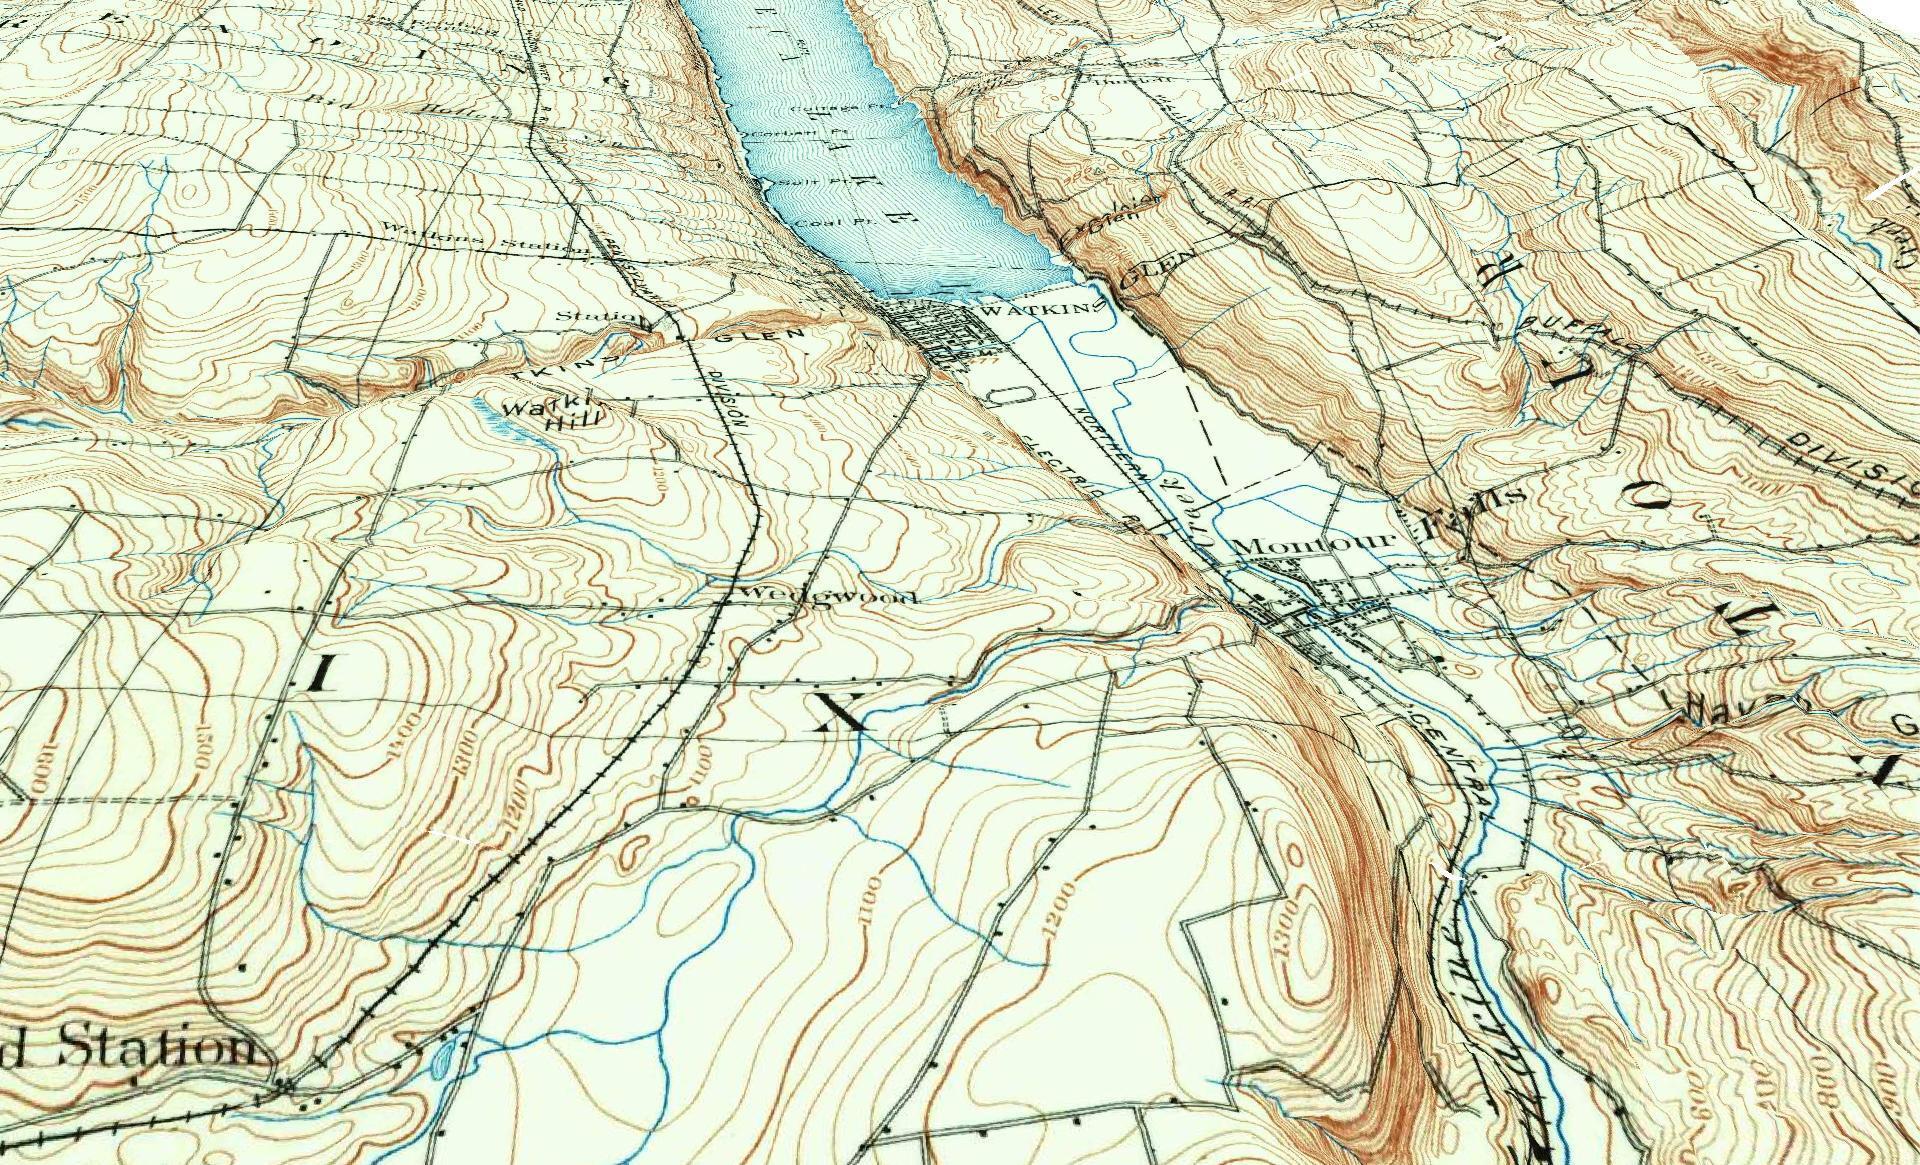
USGS Topographic Maps, historic and modern – with overlays if requested
Data Repositories like CUGIR, DataNY.gov and NYSGIS
Recreation data from NYSDEC
Software Used
Quantum GIS (QGIS) including 3D Mapping
Geodata Abstraction Library (GDAL, ogr2ogr)
Python, including the data-science libraries PANDAS and GeoPANDAS
LeafletJS Web Mapping Services
Geographies Avaliable
Primary Capital Region and also much of New York State, also some for Pennsylvania, Vermont, West Virginia
State, county, municipal, school districts – Most data sets
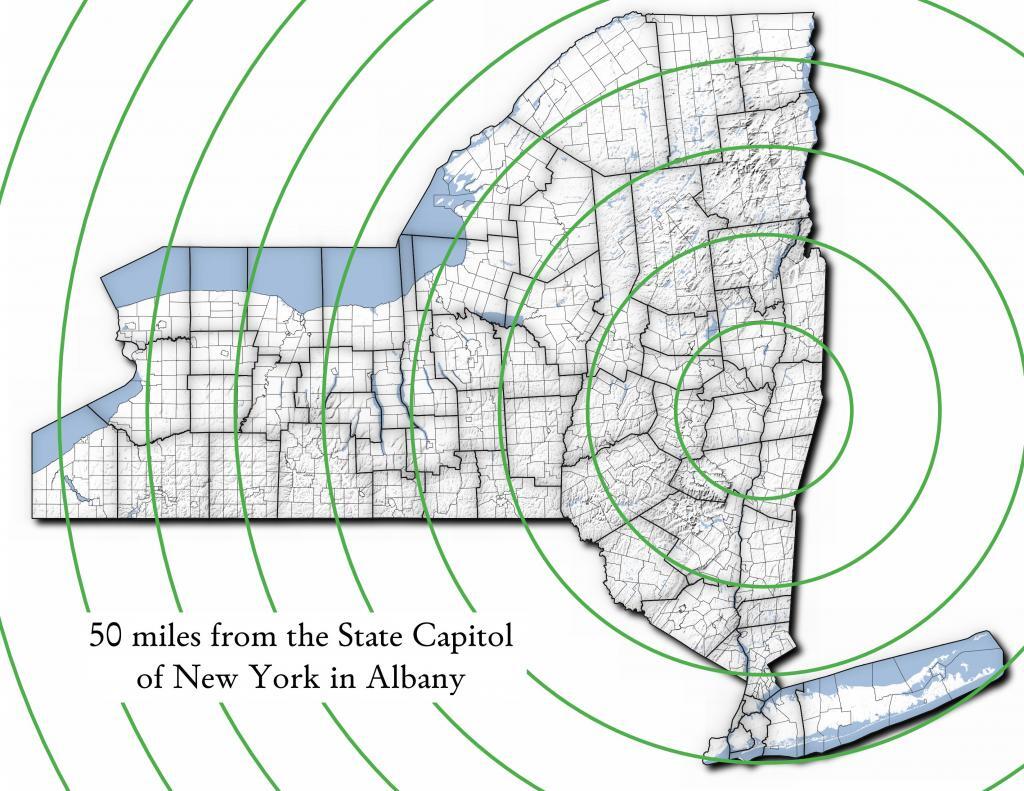
Parks, highways, buffer (distance to) – Most data sets
Election districts – Roughly 75% of NYS counties
Census Tract or Blockgroup – 2019 American Community Survey
Tabulation Block – 2020 US Census
Are printed maps avaliable at this time?
Not currently. I can send you a file based on your specifications to print at your local print shop.
How long do mapping projects take?
Depends on complexity of the project. Many projects only take minutes, however if a project requires georeferencing, data cleaning, or custom shapes or layouts, it might take significantly longer. More revisions lead to better quality output.
Do you make maps professionally?
No! This is just a hobby. But I’m interested in expanding my skills. I do a lot of mapping for my blog and in support of community organizations like Save the Pine Bush.
Are my maps of good quality?
Thats for you to decide. I don’t have formal education in map making, and I don’t have professional tools. But do take a look at the work I’ve done below.
Examples of Maps
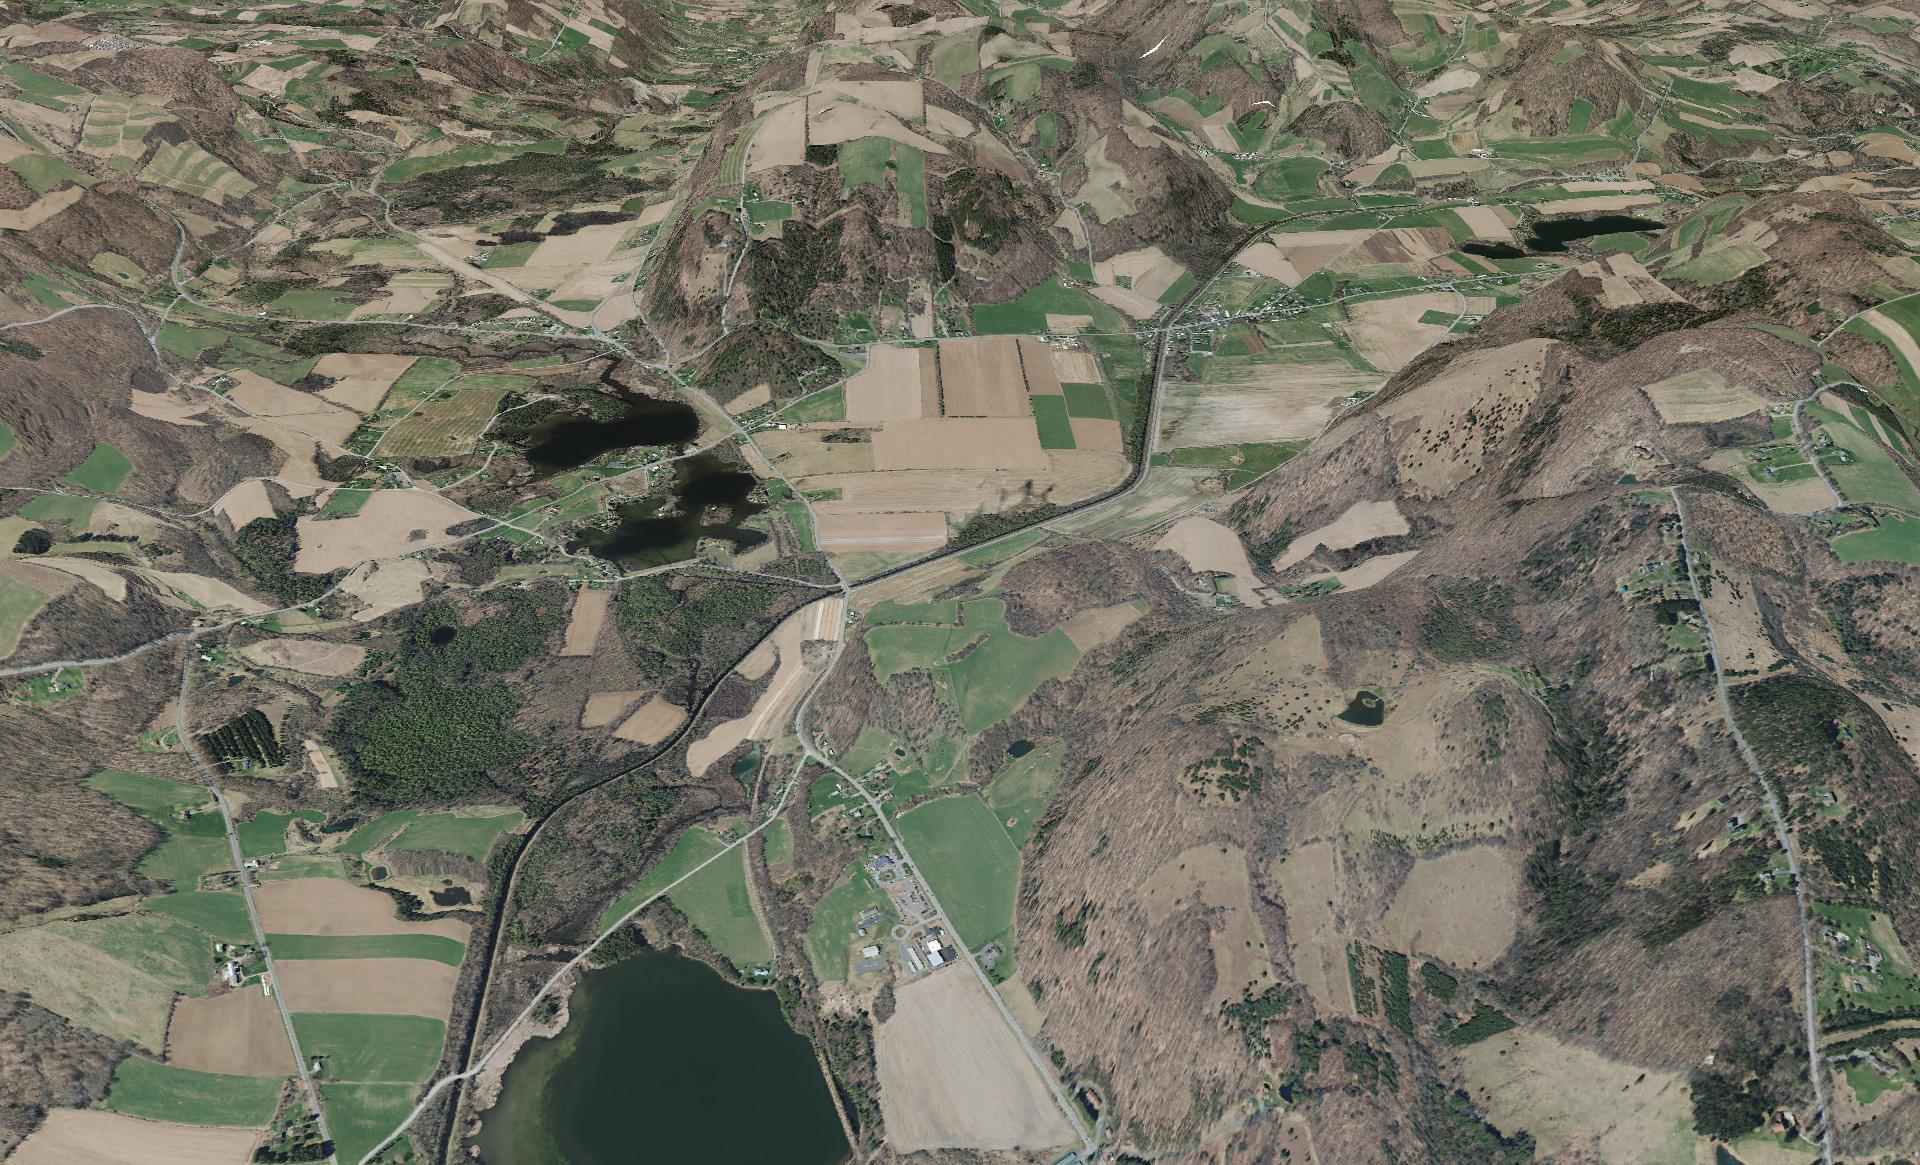
This shows a 3D rendering of the Buckville Canal north of Hamilton
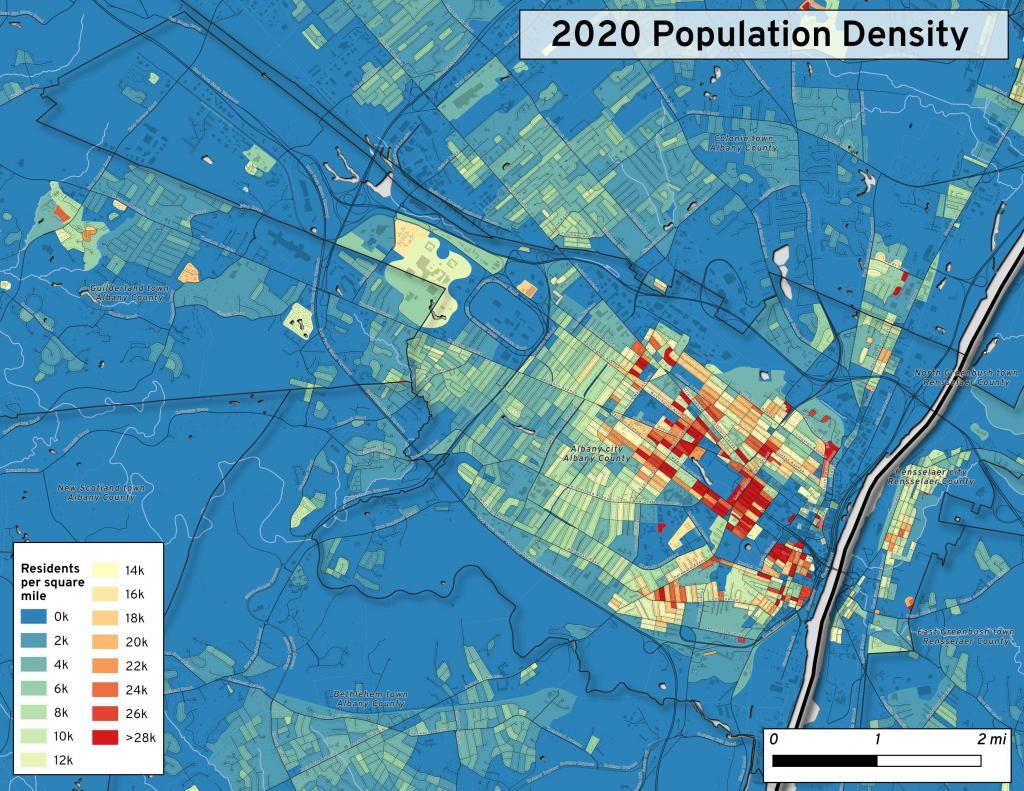
This map shows the use of 2020 PL 94-171 data to calculate population density in City of Albany.
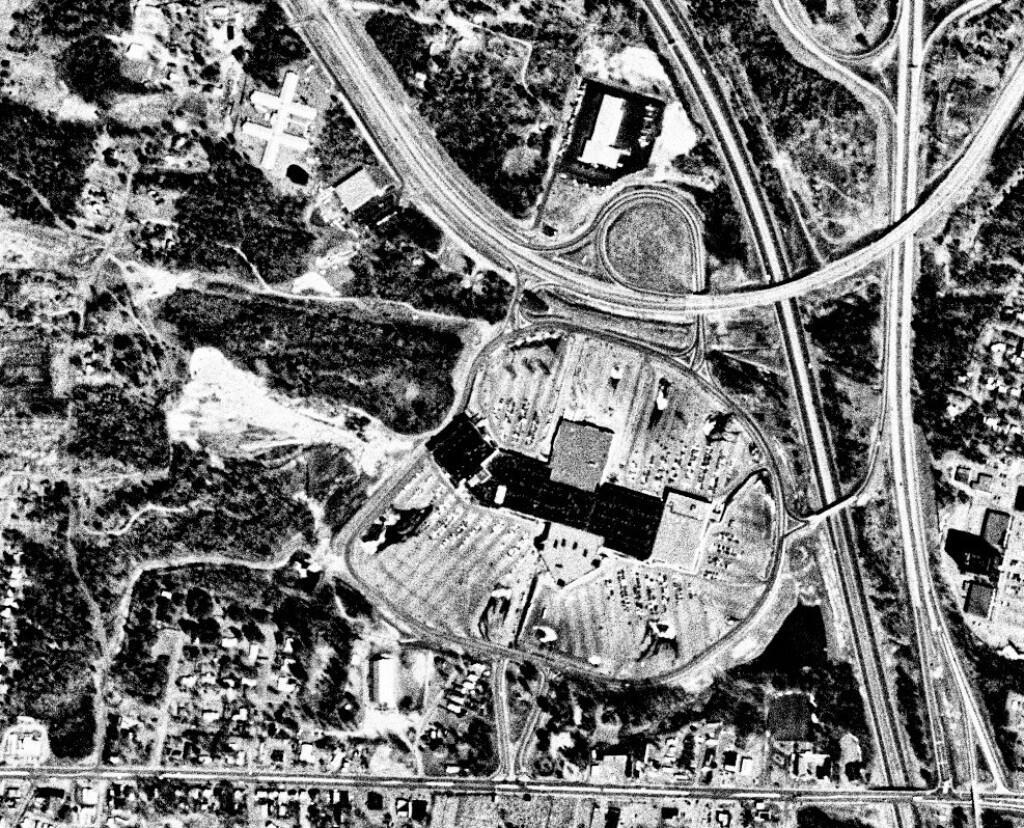
This 1985 aerial photo shows Crossgates Mall prior to it’s expansion.
This GIF image shows the change in unemployment during Coronavirus panademic.
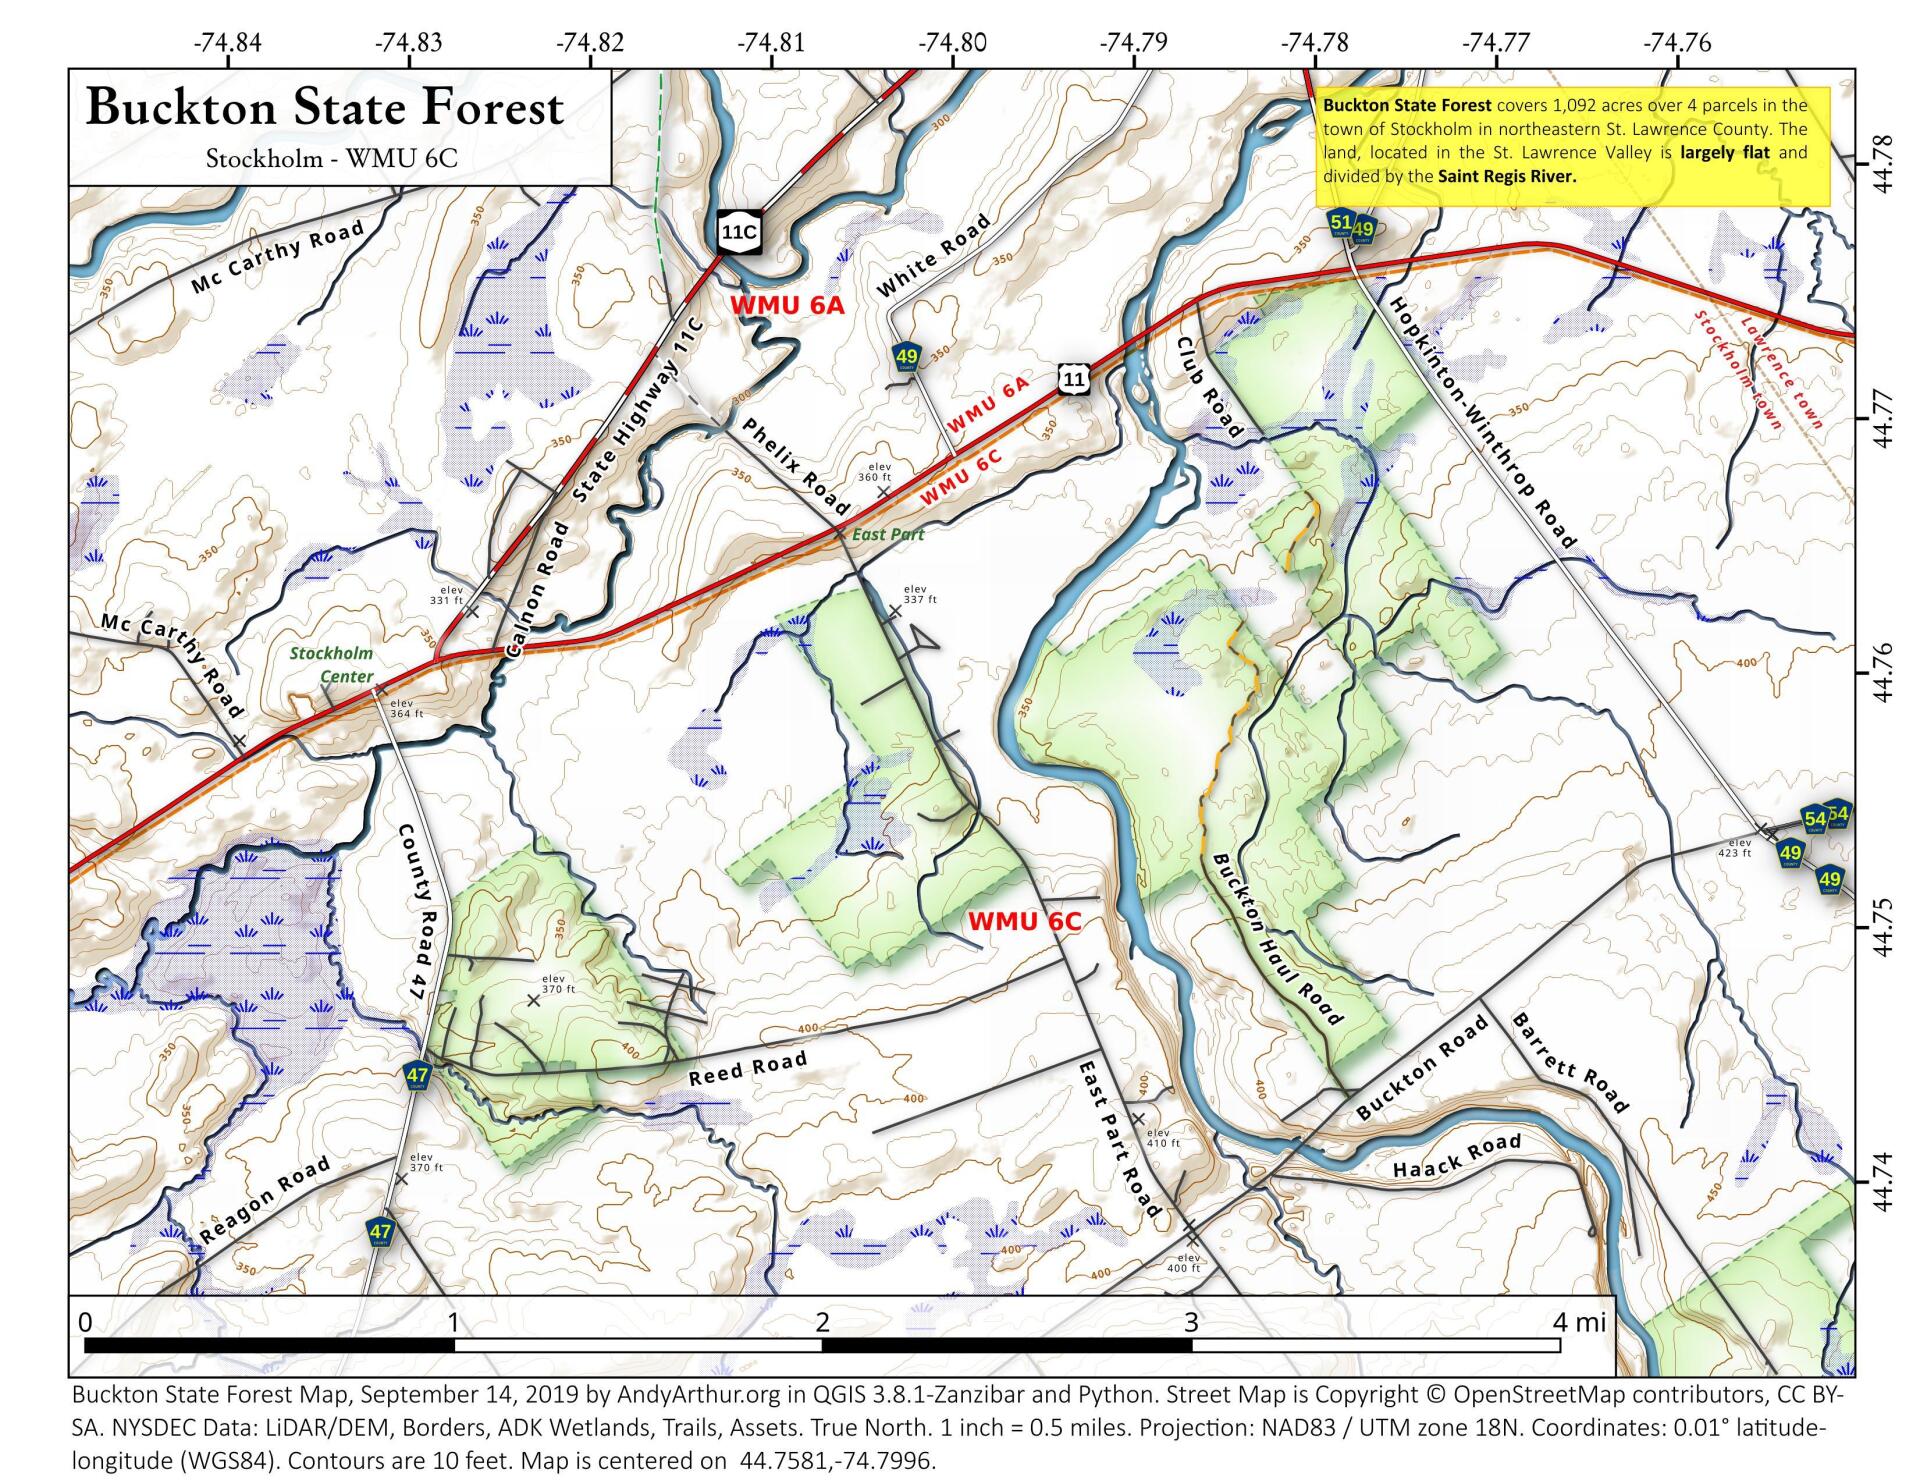
This image shows hiking trails near Brooktrout, Falls Pond and Deep Lake.
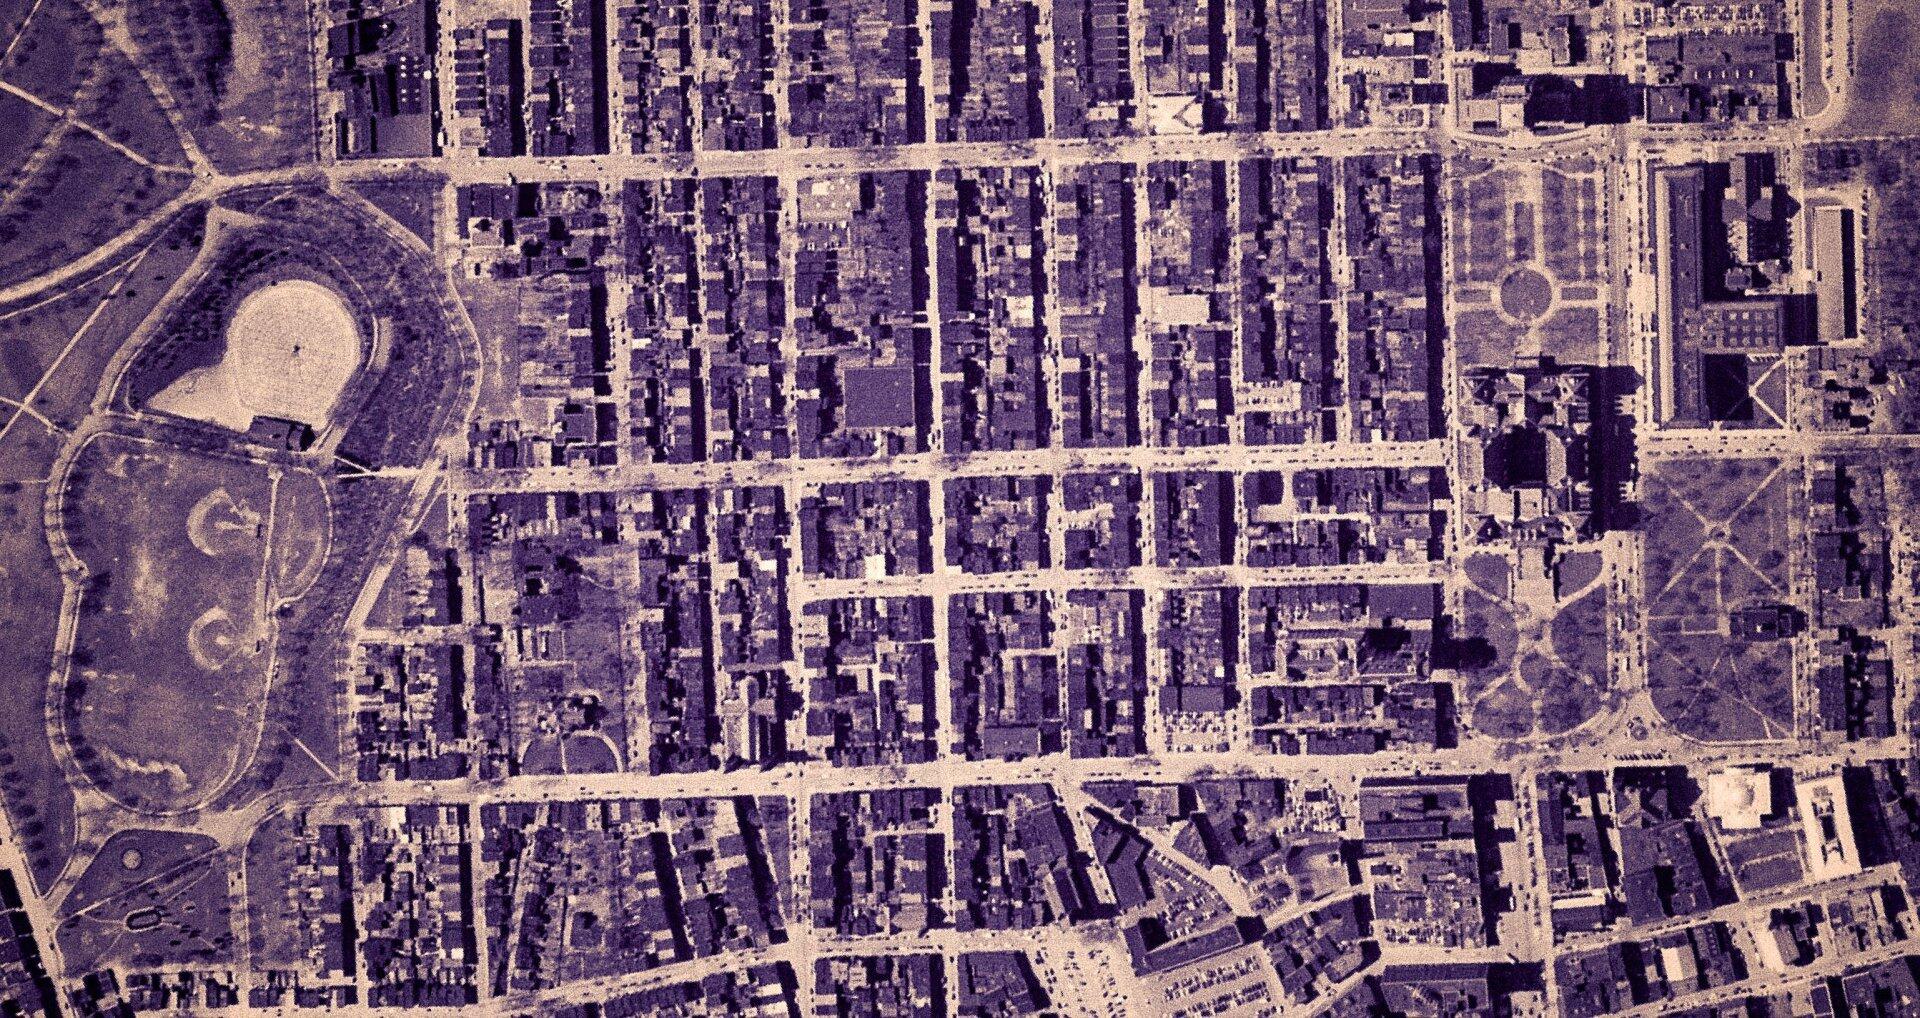
Peebles Island, a Comparison 1952
3D Interactive of campsites at Moose River Plains.
import pandas as pd
import geopandas as gpd

# path to overlay shapefile
overlayshp = r'/tmp/dis_to_albany.gpkg'

# summary level -- 750 is tabulation block, 150 is blockgroup
# large areas over about 50 miles much faster to use bg
summaryLevel = 150
#summaryLevel = 750

# path to block or blockgroup file
if summaryLevel == 150:
    blockshp = r'/home/andy/Documents/GIS.Data/census.tiger/36_New_York/tl_2020_36_bg20.shp.gpkg'
else:
    blockshp = r'/home/andy/Documents/GIS.Data/census.tiger/36_New_York/tl_2020_36_tabblock20.shp.gpkg'

# path to PL 94-171 redistricting geoheader file
pl94171File = '/home/andy/Desktop/nygeo2020.pl'

# field to categorize on (such as Ward -- required!)
catField = 'Name'

# geo header contains 2020 census population in column 90
# per PL 94-171 documentation, low memory chunking disabled
# as it causes issues with the geoid column being mixed types
df=pd.read_csv(pl94171File,delimiter='|',header=None, low_memory=False )

# column 2 is summary level
population=df[(df.iloc[:,2] == summaryLevel)][[9,90]]

# load overlay
overlay = gpd.read_file(overlayshp).to_crs(epsg='3857')

# shapefile of nys 2020 blocks, IMPORTANT (!) mask by output file for speed
blocks = gpd.read_file(blockshp,mask=overlay).to_crs(epsg='3857')

# geoid for linking to shapefile is column 9
joinedBlocks=blocks.set_index('GEOID20').join(population.set_index(9))

# store the size of unbroken blocks
# in case overlay lines break blocks into two
joinedBlocks['area']=joinedBlocks.area

# run union
unionBlocks=gpd.overlay(overlay, joinedBlocks, how='union')

# drop blocks outside of overlay
unionBlocks=unionBlocks.dropna(subset=[catField])

# create population projection when a block crosses
# an overlay line -- avoid double counting -- this isn't perfect
# as we loose a 0.15 percent due to floating point errors
unionBlocks['sublock']=unionBlocks[90]*(unionBlocks.area/unionBlocks['area'])

# sum blocks in category
unionBlocks=pd.DataFrame(unionBlocks.groupby(catField).sum()['sublock'])

# rename columns
unionBlocks=unionBlocks.rename({'sublock': '2020 Census Population'},axis=1)

# calculate cumulative sum as you go out each ring
unionBlocks['millions']=unionBlocks.cumsum(axis=0)['2020 Census Population']/1000000

# each ring is 50 miles
unionBlocks['miles']=unionBlocks.index*50

# output
unionBlocks
Land use in town of Berne (from 2016 National Land Cover Dataset)
Most highly assessed properties in Albany County …
I’m a big of farmers who are essentially Living Off the Earth and think Rednecks are Noble Savages. Dairy Farming are key to our rural landscape. I’d trust a farmer or a hunter in a pile of guts he’s butchered over any ivory-tower scientist.
I finished up the five episodes of NPR’s Embedded podcasts on Coal Stories. 🔊I cried a little bit when the final podcast came to an end as I knew how it would end.
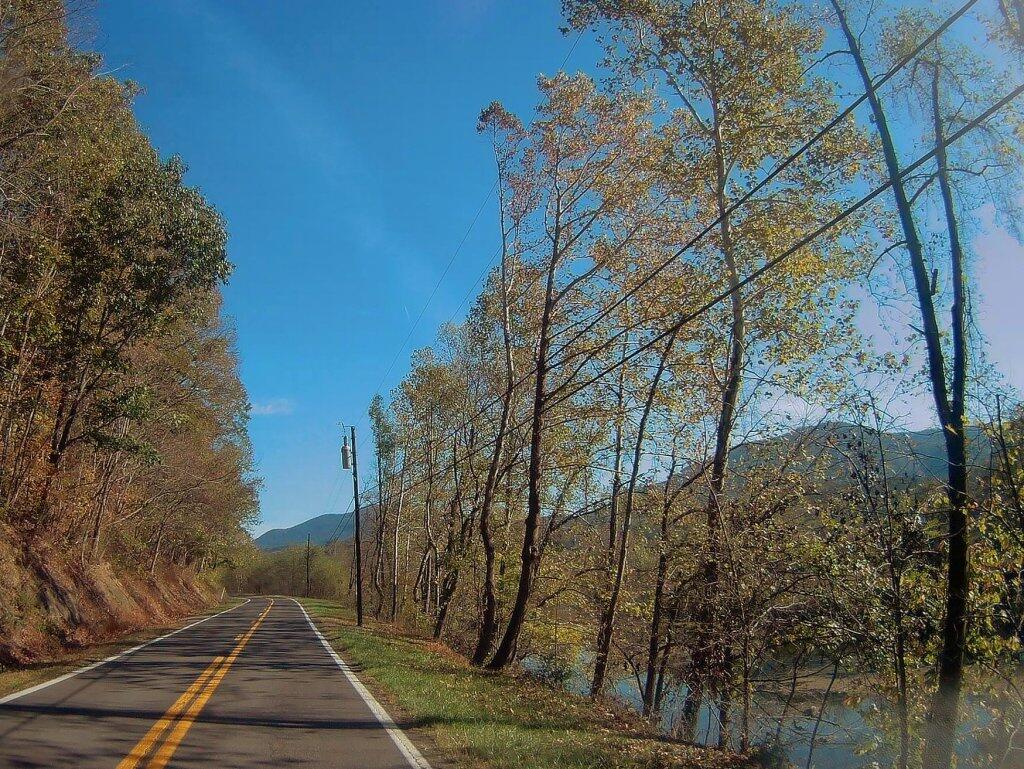
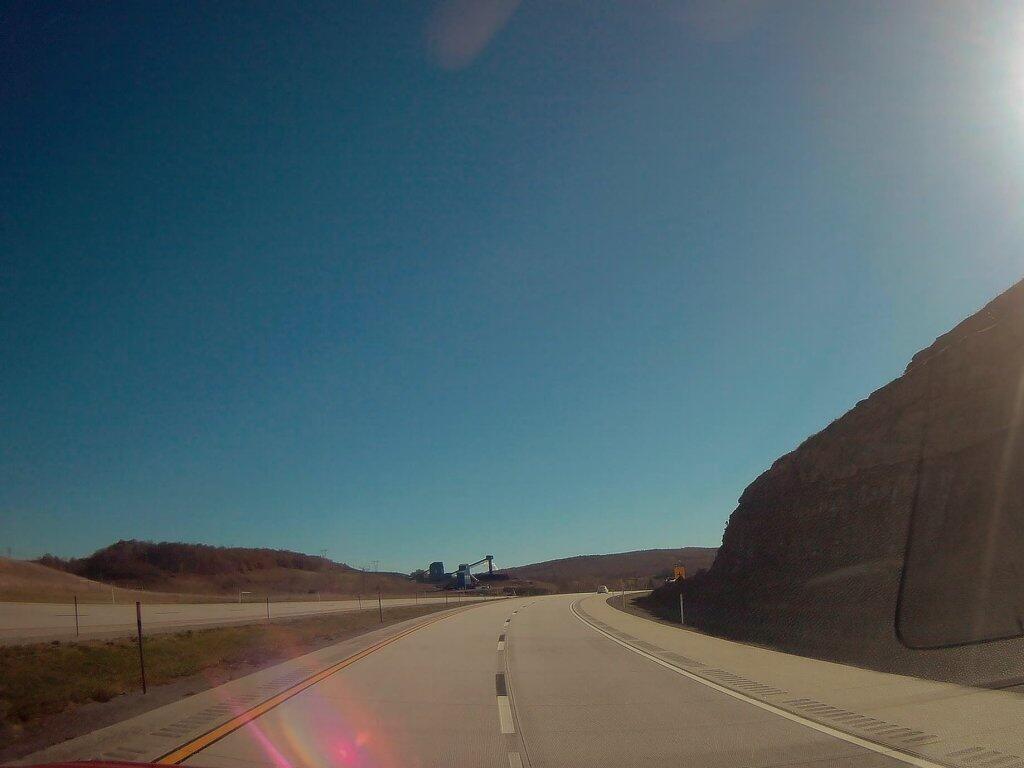
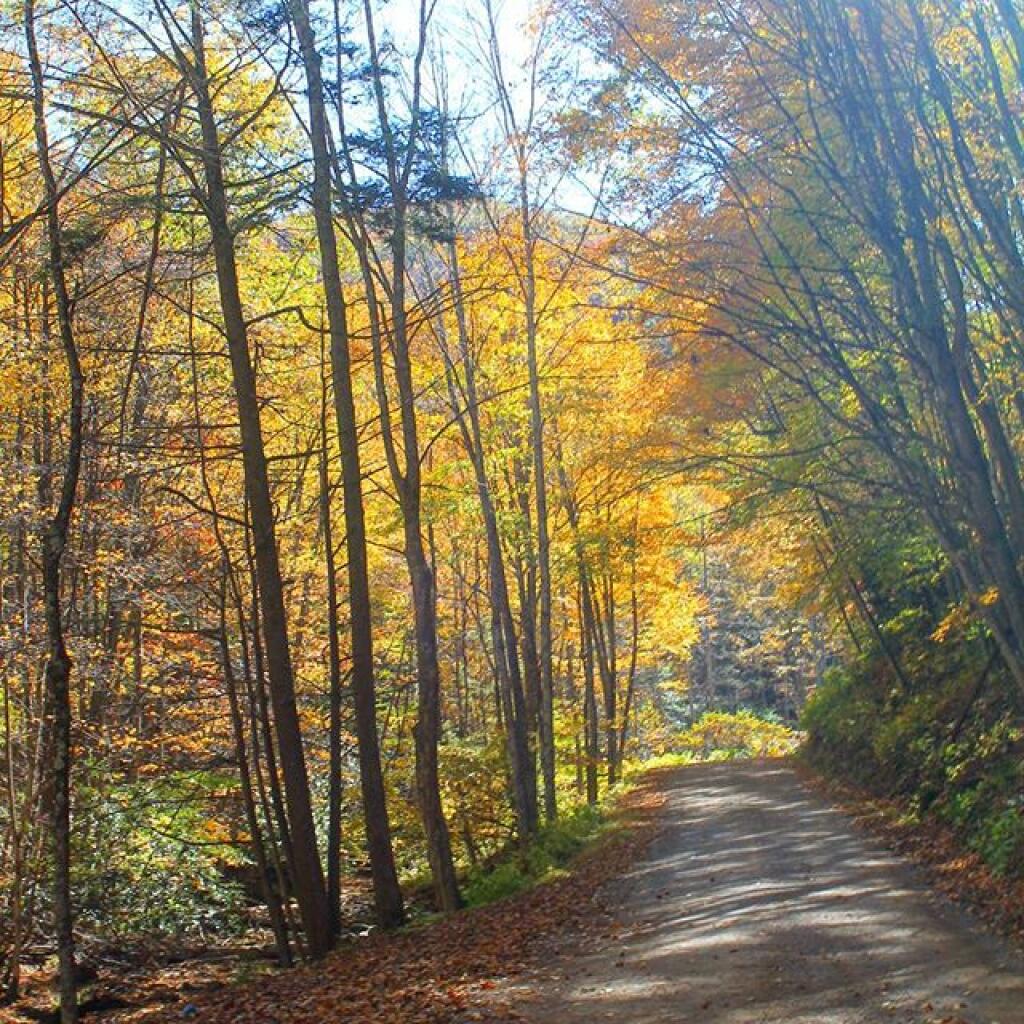
Except for the brave wayward tourist or maybe the backcountry hunter few non local people ever spend much in Appalachia off the beaten path🚧 of the expressway and the tourist trap. It’s hard to fall in love with a land at seventy miles per hour or by staying only in designated locations. Many people believe that the world ends once you pass the last stop light,🚥 descending into a dark place highlighted by Deliverance. Despite what television says, there aren’t people hiding in the woods hoping to make you squeal like a pig 🐷.
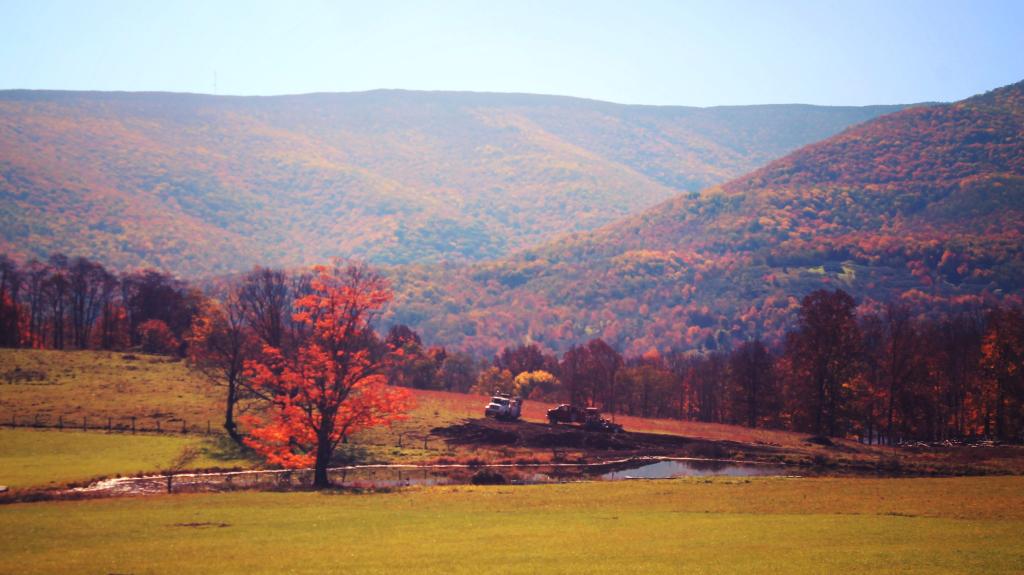
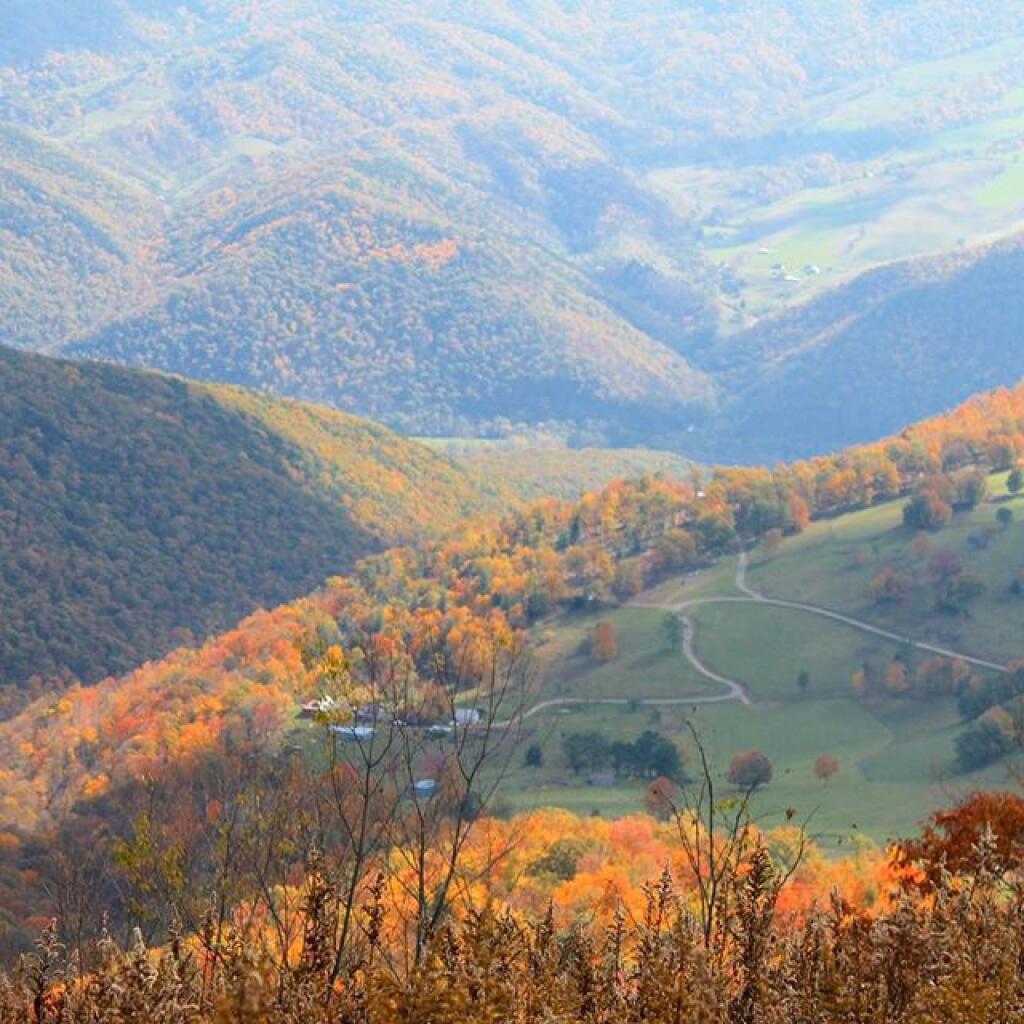
Appalachia with its mighty mountains, 🗻twisty narrow roads with steep decents and quaint villages in the river valleys is a special, wild place in many ways. It’s a place filled with amazing people, spectacular scenery and fascinating accents, traditions and customs. It’s a place of remarkable natural resources like fish and wildlife,🐡 poor farms carved into hillsides and fertile valleys🐮, timber🌲, rock, oil and gas and most importantly coal.
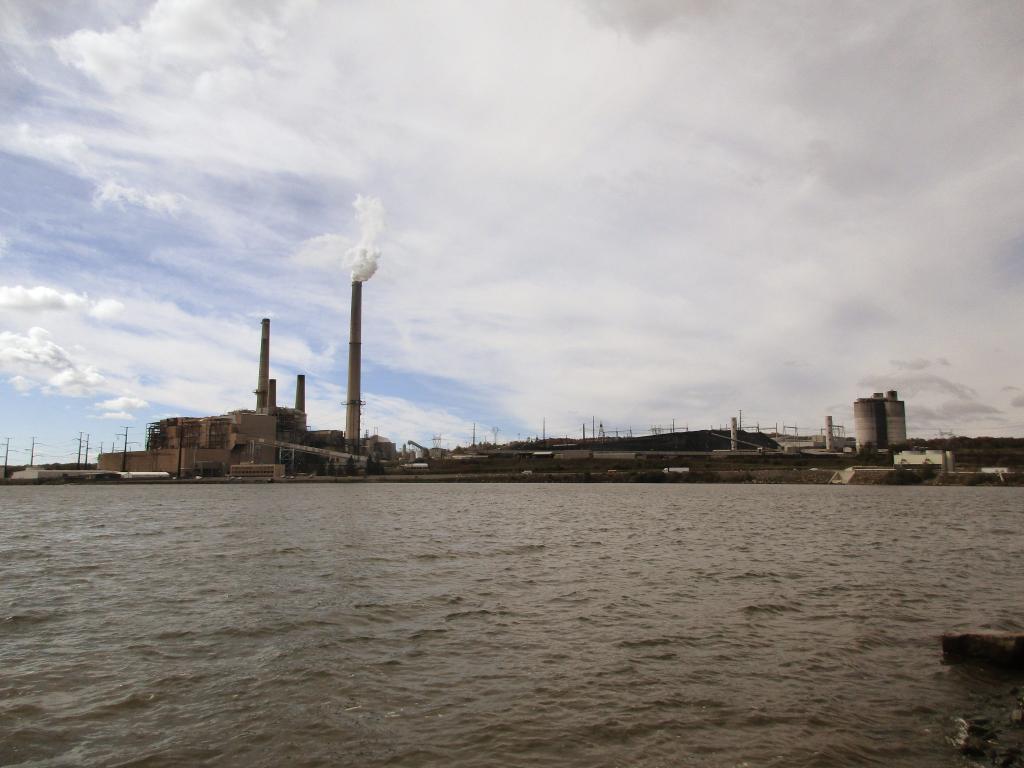
While the best of Appalachia’s coal has long been burned, there are still substantial reserves of this dirty but cheap fuel, especially the low value soft bituminous coal.🏭 Loaded with sulfur and heavy with carbon atoms, mining has provided good paying, if not tough jobs in area where there is few other jobs – as Appalachia is already poor and provides the big bustling metropolitan areas🏢 with cheap, but very dirty electricity.
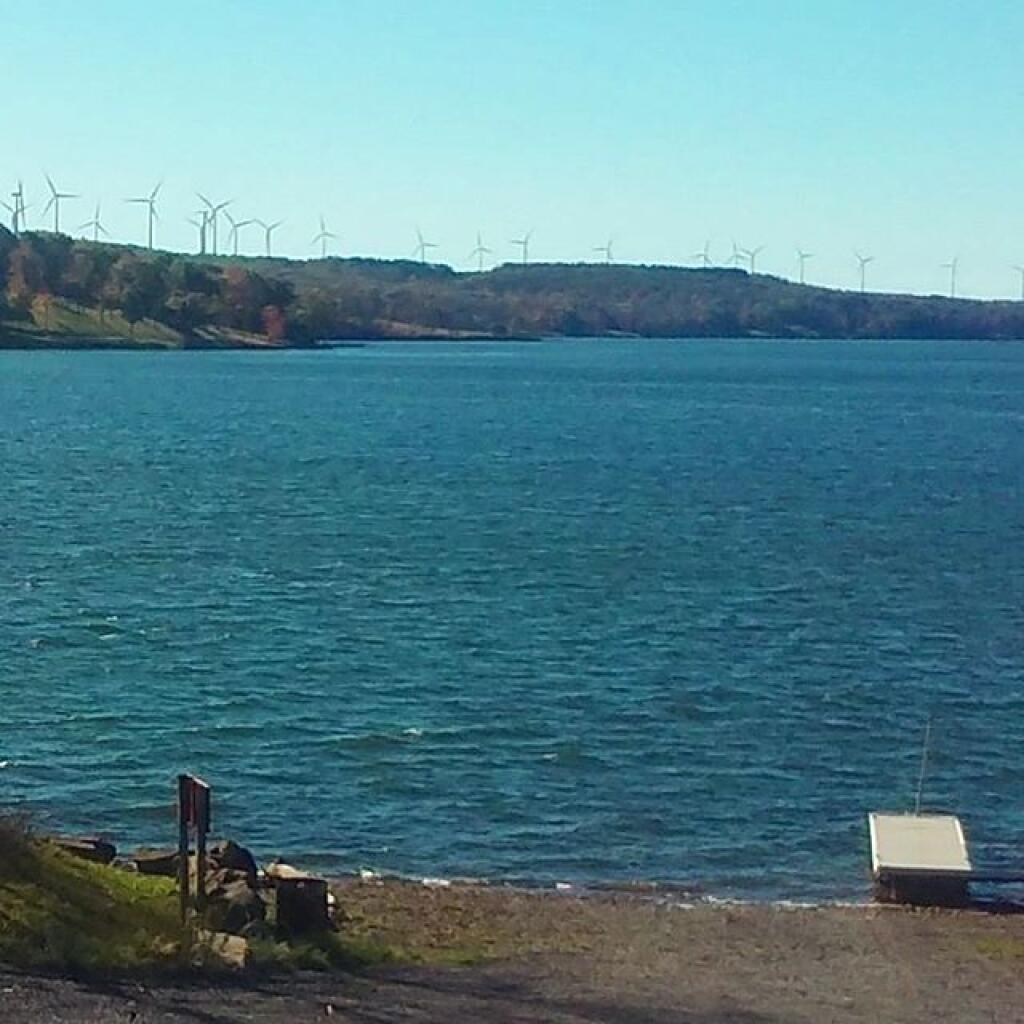
Sure there are other jobs in Appalachia, but for the most part they pay less. Most people, especially those in Appalachia know that coal jobs are disappearing 🌁due cleaner and easier to burn natural gas, greater efficiency, and more renewables. Even in deep Appalachia wind turbines dot the ridges and solar panels cling to hillsides, but nothing pays quite like coal when it comes to natural resource production – despite being an industry that is only becoming more troubled. Coal is not unlike the dairy industry in New York – dairy ain’t the best sector of agriculture in the state but it has steady milk checks year round.
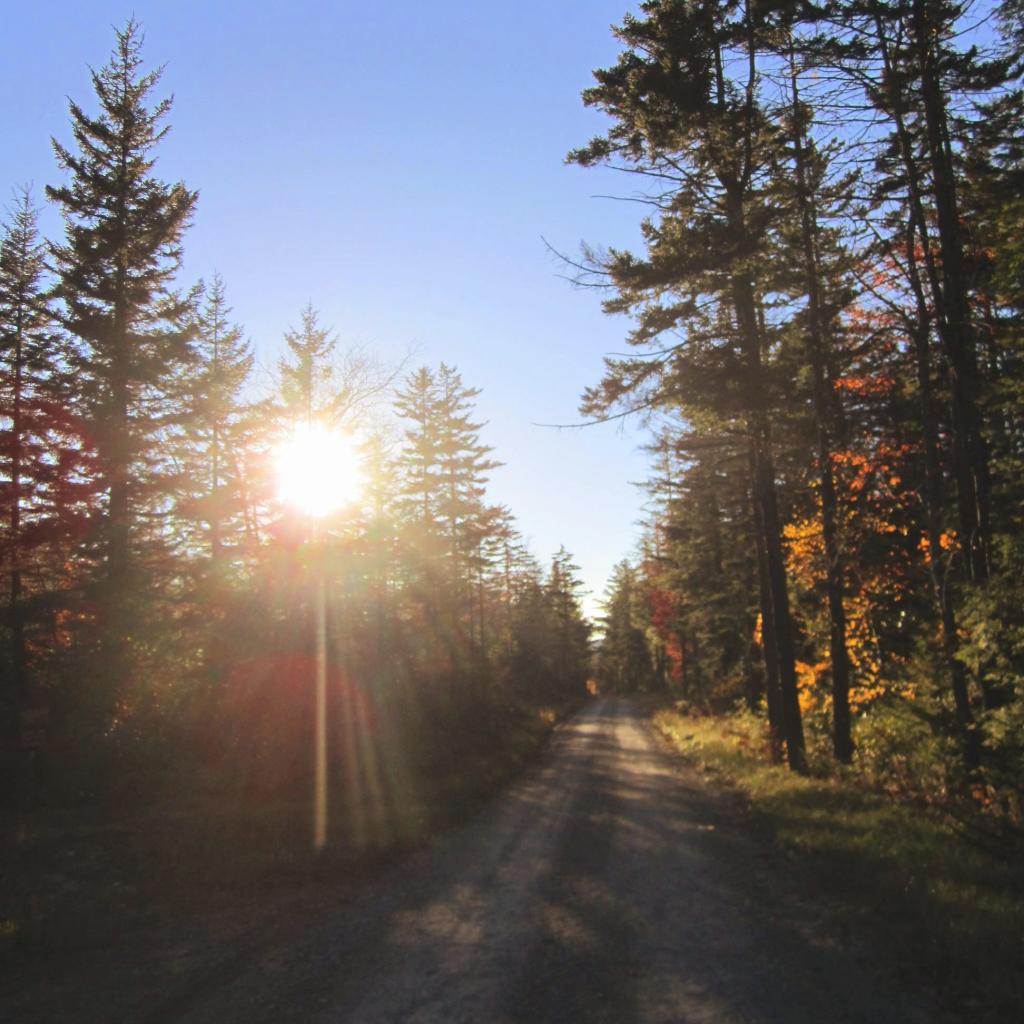
Coal allows people to stay in Appalachia, at least the lucky few that can score the remaining jobs. It’s tough nasty work, an industry that every local knows is poisoning the land but is also putting dinner on the table, paying for a nice house and pickup truck, a deer rifle for hunting season and a four wheeler.🗻 Coal allows people to remain in the land they love, the blessed hills and hollows, the twisty steep roads off the mountains where people hunt and fish, at least where acid mine discharge hasn’t poisoned the steams.
Make no mistake, coal is not an easy industry to break into. Only a few percentage of people in Appalachia are lucky enough to have scored a job in the coal industry. 👷But for the lucky few, it’s a good job in a wonderful community. And that was the whole story of Embedded’s Coal Stories.
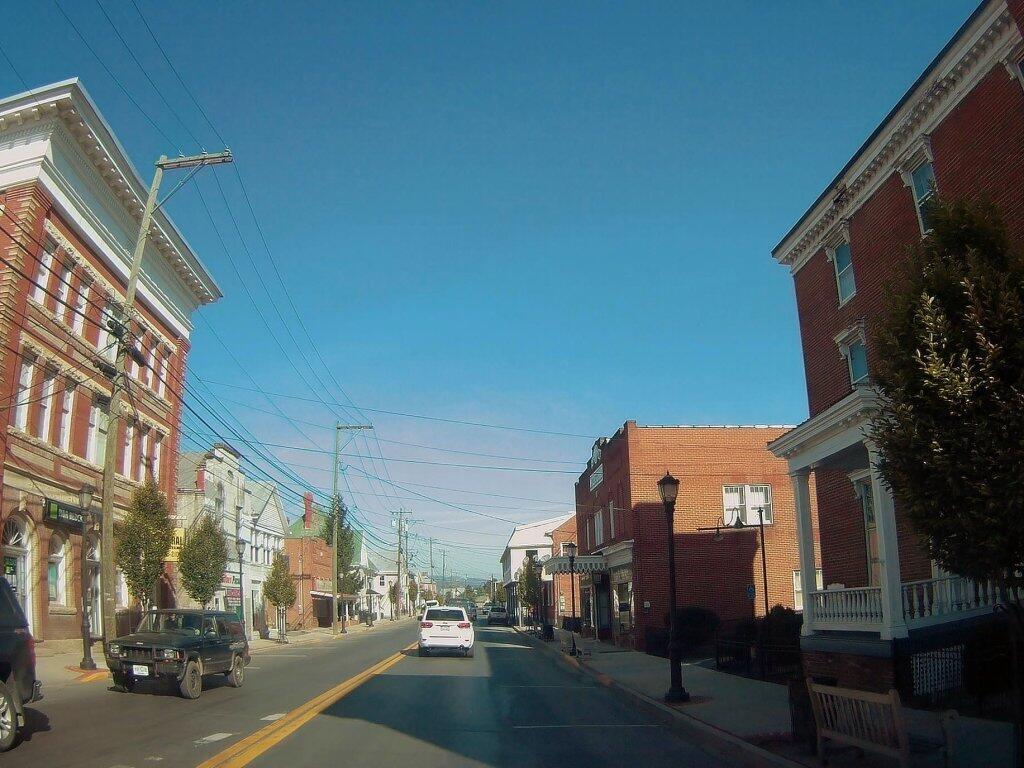
I highly recommend listening to the Embedded Coal Stories. 🎧Don’t be afraid to exit the four lane, explore the quaint villages that time and tourists has forgotten between the mountains,🏰 take many narrow and steep roads through the mountains. Speak jealously about the few people lucky enough to carve a life out of what so little remains of the hills and hollows of Appalachia.


 Bicycle Trails and “Blackie” My Mountain Bike


 Python and Pandas


 Politics

 The Earth


 Saving Money


 Mission Fifty & Being Healthier


 / Enjoying Life


