state

Our Urban State

A while back I showed off the population of New York State in 2010, based on every town’s population. We looked at population density of various towns, and how it’s very dense in a few towns, and very spread out in most of state. Today, let’s look at a map of the developed areas of NY State.

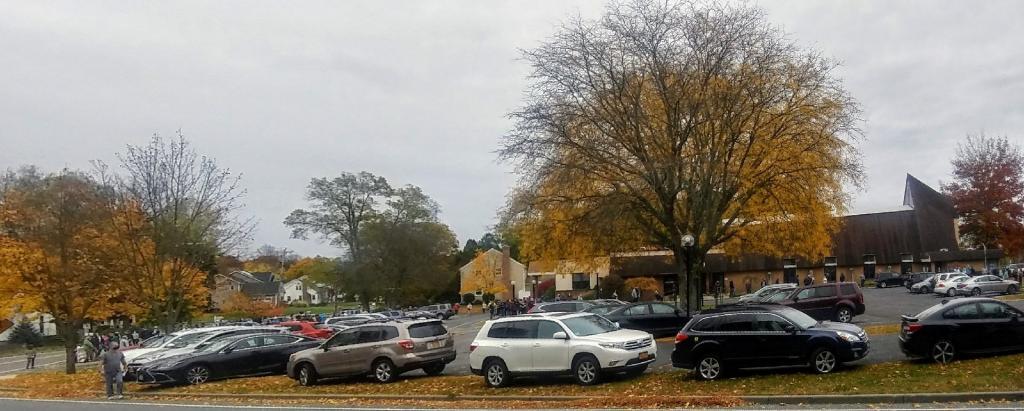
Craziness at the Early Vote place

Roughly 10% of the state is urbanized… the rest of state is rural.

So what goes on in the rest of state? About 24% of the state is farmed — lots of cows, corn, alfalfa and hay, but an even bigger portion is essentially wildlands, covered with water or forest lands.

Distance to State Parks

It’s not to say people don’t live in other areas — they do. But small rural houses and farm steads are just footnotes, in a largely wild, forested or farmed landscape that makes up most of New York.

Can You Sue the State For Failing to Protect Against Pollution?

Article XIV Section 4 states:

The policy of the state shall be to conserve and protect its natural resources and scenic beauty and encourage the development and improvement of its agricultural lands for the production of food and other agricultural products.

The legislature, in implementing this policy, shall include adequate provision for the abatement of air and water pollution and of excessive and unnecessary noise, the protection of agricultural lands, wetlands and shorelines, and the development and regulation of water resources.

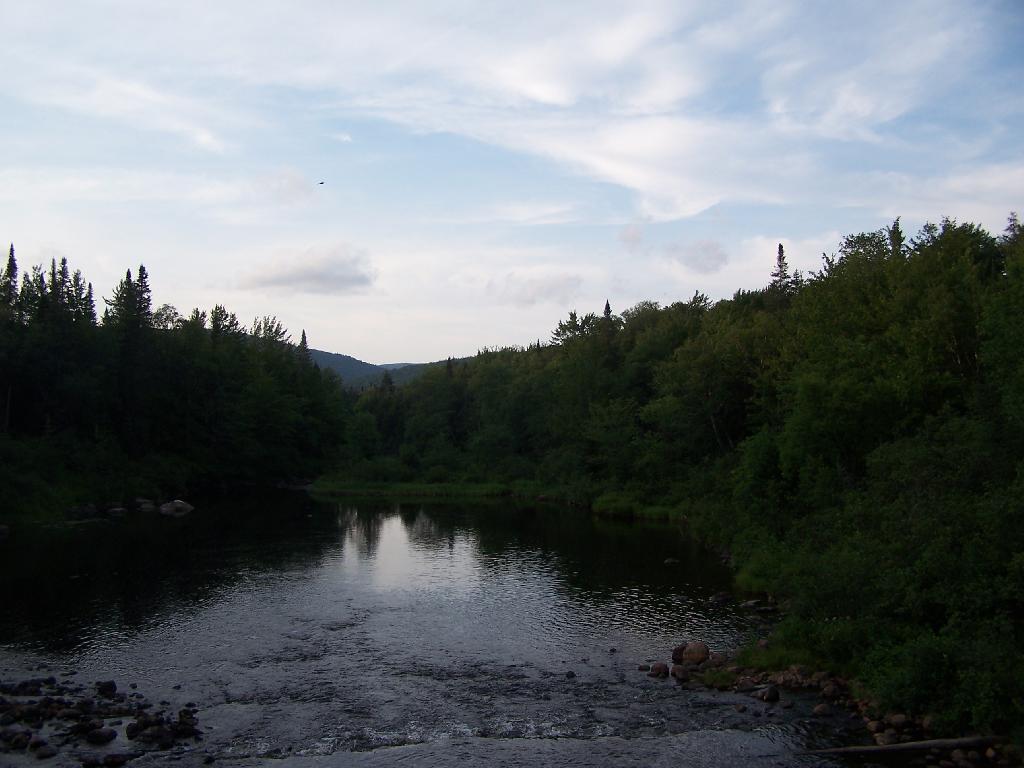
Cedar River Below Dam

While Article XIV Section 5 provides:

A violation of any of the provisions of this article may be restrained at the suit of the people or, with the consent of the supreme court in appellate division, on notice to the attorney-general at the suit of any citizen.

This would state affirmatively that the any citizen may sue the state for failing to “conserve and protect its natural resources and scenic beauty” and “encourage the development and improvement of its agricultural lands for the production of food and other agricultural products.”.

How Much Do I Have Invested in NY State?

Last night I was pondering how much I had invested in NY State, not in form of capital as much as knowledge and connections. You know, over 29 years of living in this state, I’ve learned much, and moving away from it, would seem I would loose a lot.

Things like (in no particular order):

  • Familiarity of the roads and places
  • How state government works (sorta)
  • The general topography of the land
  • General folkways of doing things
  • Community organizations
  • Personal connections

South West

Maybe this is why a lot of people never leave the community they grew up in, and even fewer ever leave the state they were born in. It just seems like moving on is such a daunting task, especially when you’ve come so familiar with the status quo.

I’ve lived in other parts of Upstate New York, from time to time, but somehow any part of New York State your in is kind of structured the same way. Other states, not so much. But maybe I’m over playing the differences.

Then again, the world is always changing. The place I knew a few years back rarely stays the same due to forces of man and nature alike. Time changes everything.

How To Make Maps from Redistricting Block Lists

When a city council, county legislature, or state legislature redistricts itself to reflect changing population, they usually release data in two formats:

  1. Census Block Equivalency – A list of census blocks in each district, generated by the commerical GIS program (such as Mapitude) used for redistricting.
  2. Metes and Bounds – A legal description of each district, used in resolving court disputes over district boundaries, and assisting board of elections on where to put voters whose property might be crossed by a Census block

If you planning on making a map, Metes and Bounds won’t be particularly useful. Computers don’t understand english very well, they need numbers and lists. In contrast, the Census Block Equivalency is very useful for mapping things.

Every year, the Census Bureau puts out series of ERSI Shapefiles known as TIGER/Line. You can download TIGER/Line for any state and county in the United States from their website. They provide many different shapefiles and layers such as a Highway, Faces, Edges, and County Subdivision layers, however the one you will be most interested for making district maps is the Tabulation Block (tabblock) layer.

You can use these files in the free program known as Quantum GIS or QGIS. While this tutorial will not explain the ins and outs of QGIS, this should get you started on making redistricting maps.

The Tabulation Block Layer is the file containing all of the Census Blocks for a particular county. A Census Block is the smallest unit of population gathered by Census Block, and consists of all bordering features (bounds) — roads, rivers, shorelines, along with all imaginary lines (metes) — town lines, village lines, other lines drawn for statisitical purposes.

Each Census Block has a number, that is a subdivision of the Census Block, County ID, and State ID that it resides within. For example, the Governor’s Mansion in Albany is located in Census Block 2000 in Census Track 23.00 (zero padded to 002300) in Albany County (Federal Information Processing Standard — FIPS ID: 01) which is in NY State (FIPS ID: 36). County subdivisions are not applied to Census Tract Numbers, as they may in some cases cross county subdivisions, as is the case of smaller districts.

You put those numbers together to get the GEOID — which is the key used for redistricting block lists and most other block-level census data. The Governor’s Mansion is located at a block with a GEOID 360010023002000.

36 001 002300 2000
State ID County ID Zero Padded Census Tract Number Census Block Number

The block list you get from a redistricting commission typically is in Database Exchange Format (.DBF) or Comma Deliminated Format (.CSV) which are both openable by common spreadsheet applications like Microsoft Excel or OpenOffice Spreadsheet and GIS programs like ArcGIS or Quantum GIS.

This is taken from the LATFOR State Senate Proposed Districts (January 2012) DBF file. It shows you that the Governor resides in Proposed Senate District 44. Across the river in Census Block 4010, Census Tract 524.03, in Rensselear County (FIPS ID 83), NY State (FIPS ID: 36) is located in Proposed Senate District 43.

360010023002000 SD44
360010021002008 SD44
360010021002004 SD44
360010021002001 SD44
360830524034017 SD43
360830524034010 SD43

Download the TIGER/line “Tabulation Block” Shpaefile file for the district you are interested in. You will want the 2010 version. You can download a state-wide tabulation block file, however that is not recommended as the next step will be impossibly slow on most computers. You may also want to open the .CSV or .DBF file in your spreadsheet program and cut out the county you want to speed things up.

You will then want to open up the file in Quantum GIS. You will get a nice map of the county you downloaded, showing all of the Census Blocks.

  • From there, go to the Vector -> Join Attributes submenu.
  • Make sure that the Target vector layer matches the Tabulation Block Shapefile you wish to join against, then set Target join field to GEOID10 .
  • Select click Join dbf table and select the DBF or CSV file you wish to join.
  • Change the Join field to BLOCK or whatever the GEOID is titled in your redistricting block file.
  • Enter in a location to save the Output Shapefile
  • Click okay.

Then wait. A typical county will take 10-40 minutes to join on my 5 year old laptop; your computer may be quicker. If you have a dual processor machine, go on to doing other work in other programs. You will end up with a map that looks like this (stylized for your enjoyment). Each block will be assigned a Senate District (in this example).

Halfway there. Now you need to “dissolve” each Census Block into it’s larger political district. Go to Vector -> Geoprocessing Tools -> Dissolve . Set the Input vector layer to the file you previously joined. Then set the Dissolve field to the field containing the district number — such as DISTRICTID or whatever it is named. Enter a name to safe the file. Click Dissolve.

Outputed will be a Shapefile containing all the political districts in the county you joined and dissolved. This will take 5-20 minutes on my laptop. Other data may exist in that file, such as Census Block number, however at this point that data will be invalid, as only the district number is accurately preserved in such a join. All other data will be picked at random, so delete those columns.

I hope this is helpful. If you just want the Proposed State Senate or State Assembly Districts you can download them from Center for Urban Research. These are the same data, joined using the above process by somebody with a much faster computer. I have also made up a Shapefile containing the Albany County Legislative Districts using this process.

Map: Harrisburg Roadside Camping
Map: Fishbrook Pond

State Land Acreage By Classification

All figures are in acres except where noted. Table updated April 2011. Reprinted from the DEC Website.

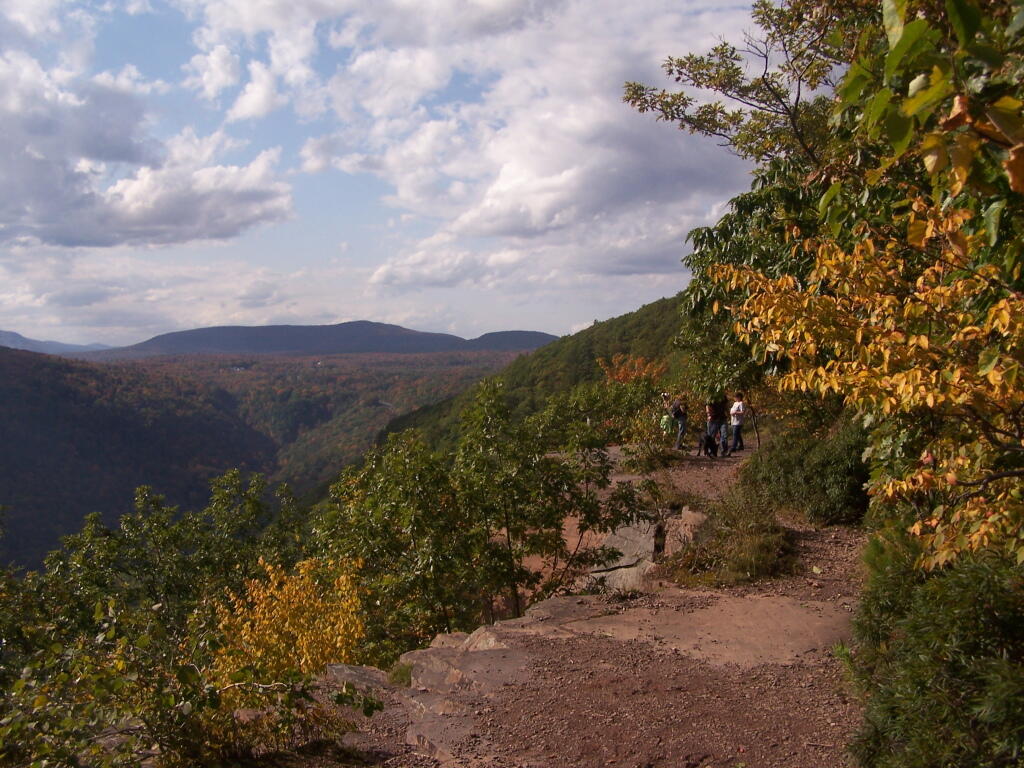
Inspiration Point

Land Classification Region
1
Region
2
Region
3
Region
4
Region
5
Region
6
Region
7
Region
8
Region
9
Catskill
Park Total
Adirondack
Park Total
State
Total
Percent of Total
State Land and
Conservation
Easements
State Forest 16,056 758 31,763 102,248 58,354 221,924 200,419 55,581 99,121 16,264 ** 786,224 17%
Forest
Preserve
Wilderness 89,352 53,482 954,601 206,151 142,834 1,160,752 1,303,586 28%
Wild Forest 75,588 60,368 938,664 ** 367,123 135,956 1,305,787 1,441,743 31%
Primitive 31,309 15,704 47,013 47,013 1%
Primitive Bicycle
Corridor
15 283 298 298 0.006%
Canoe 18,989 18,989 18,989 0.4%
Intensive Use 4,104 1,542 21,591 1,828 5,646 23,419 29,065 0.6%
Administrative 392 0 *** 384 7 392 391 783 0.02%
Historic 531 531 531 0.01%
Pending
Classification
259 111 370 370 0.007%
Under Water*
(Unclassified)
17,395 6,534 23,929 23,929 0.5%
Detached
Parcel
1,382 4,141 1,441 4,318 11,282 0.2%
Total Forest Preserve 170,833 119,816 2,001,313 601,776 285,126 2,597,267 2,893,738 61%
Wildlife Management Area 6,007 12,021 18,518 6,524 ** 46,371 49,562 41,462 17,178 407 *** 2,755 ** 197,643 4%
Conservation Easement 108 21 7,264 7,286 488,463 336,783 436 10 9,437 769,579 840,371 18%
TOTALS: 22,171 779 221,881 247,868 2,554,654 1,206,854 250,417 97,043 116,309 294,970 3,385,865 4,717,976 100%

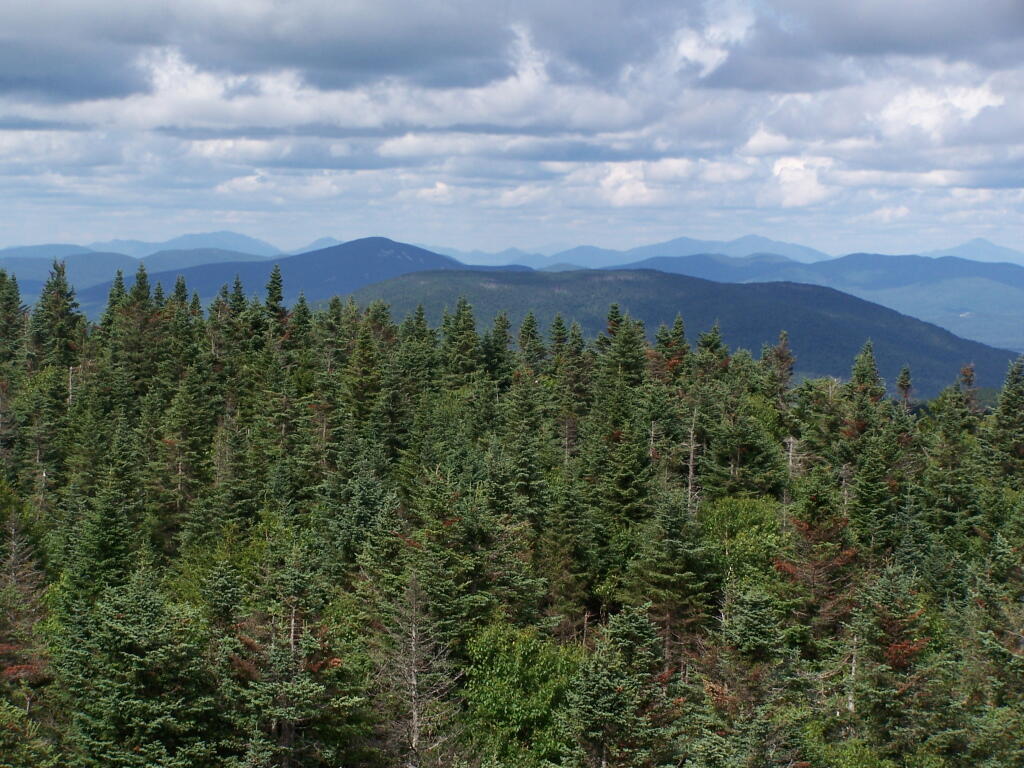
Blue Ridge and Blue Mountain

Notes from the DEC.

* Certain lake beds are considered Forest Preserve, despite some level of private ownership adjacent to the lakes. These underwater lands are not classified. For the purposes of this table, however, lakes and ponds that are completely surrounded by Forest Preserve have been classified the same as the adjacent land.

** Where State Forests and Wildlife Management Areas exist within the Adirondack Park, the Adirondack Park State Land Master Plan also classifies these lands as Wild Forest. However, since these lands are not Forest Preserve, State Forest and Wildlife Management Area acreages within the Adirondack Park were NOT included in the Wild Forest category.

*** Where Wildlife Management Areas exist within the Catskill Park, the Catskill Park State Land Master Plan also classifies these lands as Administrative. For calculation purposes in this table, however, Wildlife Management Area acreage within the Catskill Park was NOT also included in the Administrative category.

Map: Floodwood Mountain Trail
Map: Otter Brook Road at Horseshoe Lake Wild Forest