Day: February 24, 2025💾

🗺️ Maps 🖼️ Photos 📽️ Videos

Finding the right balance on ads 💰️

I’ve been experimenting more with Google Ads. Where to place them, how to have them without interfering too much with my blog’s messaging and content. While the Google Auto Ads would splash them all over, including over content and pop-ups, that’s a bit much too me. I was hoping to keep them all in the sidebar, but the occasional one stuck in the middle brings in surprisingly a lot of revenue, as does the end of page ads, even though it’s not all that common that people scroll al the way to bottom, but they’re big and therefore valuable to advertisers..

Blogs ads aren’t getting me rich, but they do cover the cost of the domain and hosting and provide a little extra spending cash in the summer. They give me an incentive to develop new and interesting content including maps, knowing every two months or so I’ll be getting a hundred or so dollar deposit in my checking account. And I think placed in the right location, they can bring in revenue without being too commercial. I don’t like advertising, but I think I can live with it for now.

North Adams, Mass 1995 vs. 2020

LEFT - Circa 2020
RIGHT - Circa 1995

In the past quarter century, there hasn't been that many changes to North Adams, Massachusetts although some of the mill buildings have been demolished and a large solar farm has been installed on a logged wooded area outside of the city.

Map: Green Mountain National Forest North
SVGZ Graphic: Greene County, NY - Change in Grasslands and Pasture, 2001 to 2021
Thematic Map: Active Gas Wells in NY

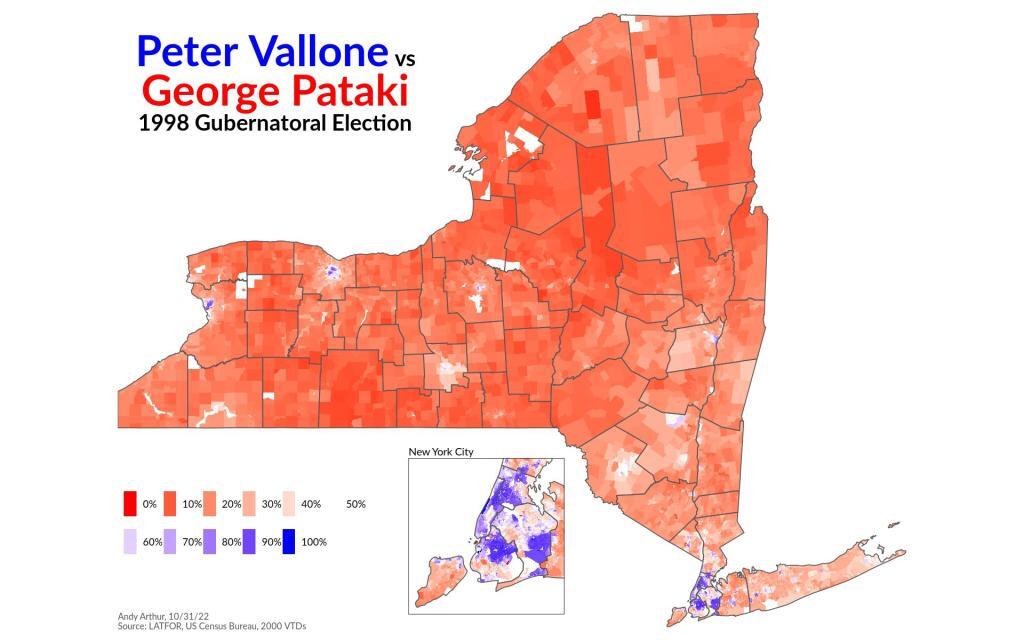
Peter Vallone vs George Pataki (1998)

24 years ago, a very red year at least for the Governor's race, with George Pataki receiving 54.3% of the vote to Peter Vallone's 33.2%. This was a three-way race, with Tom Golisano getting 7.7% of the vote, but for sake of mapping I ignored that. Peter Vallone really didn't win much outside of New York City, and the bluest of blue areas in Upstate cities.

With this I learned a lot about how to read fixed width files into R. It's actually not hard if you have the separate header files, and use the read_fwf to set the widths based on the header file. Which is good because a lot of old data is in fixed width format, especially things from the 1960s and 1970s but also later decades too for big datasets. You can get the R code for making the map: https://github.com/AndyArthur/r_maps_and_graphs/blob/main/pataki_v_vallone_1998_map.R

Peter Vallone vs George Pataki (1998)

Map: Wakely Mountain Firetower Views