Day: October 22, 2021💾

🗺️ Maps 🖼️ Photos 📽️ Videos

Wind Transforms Landscapes

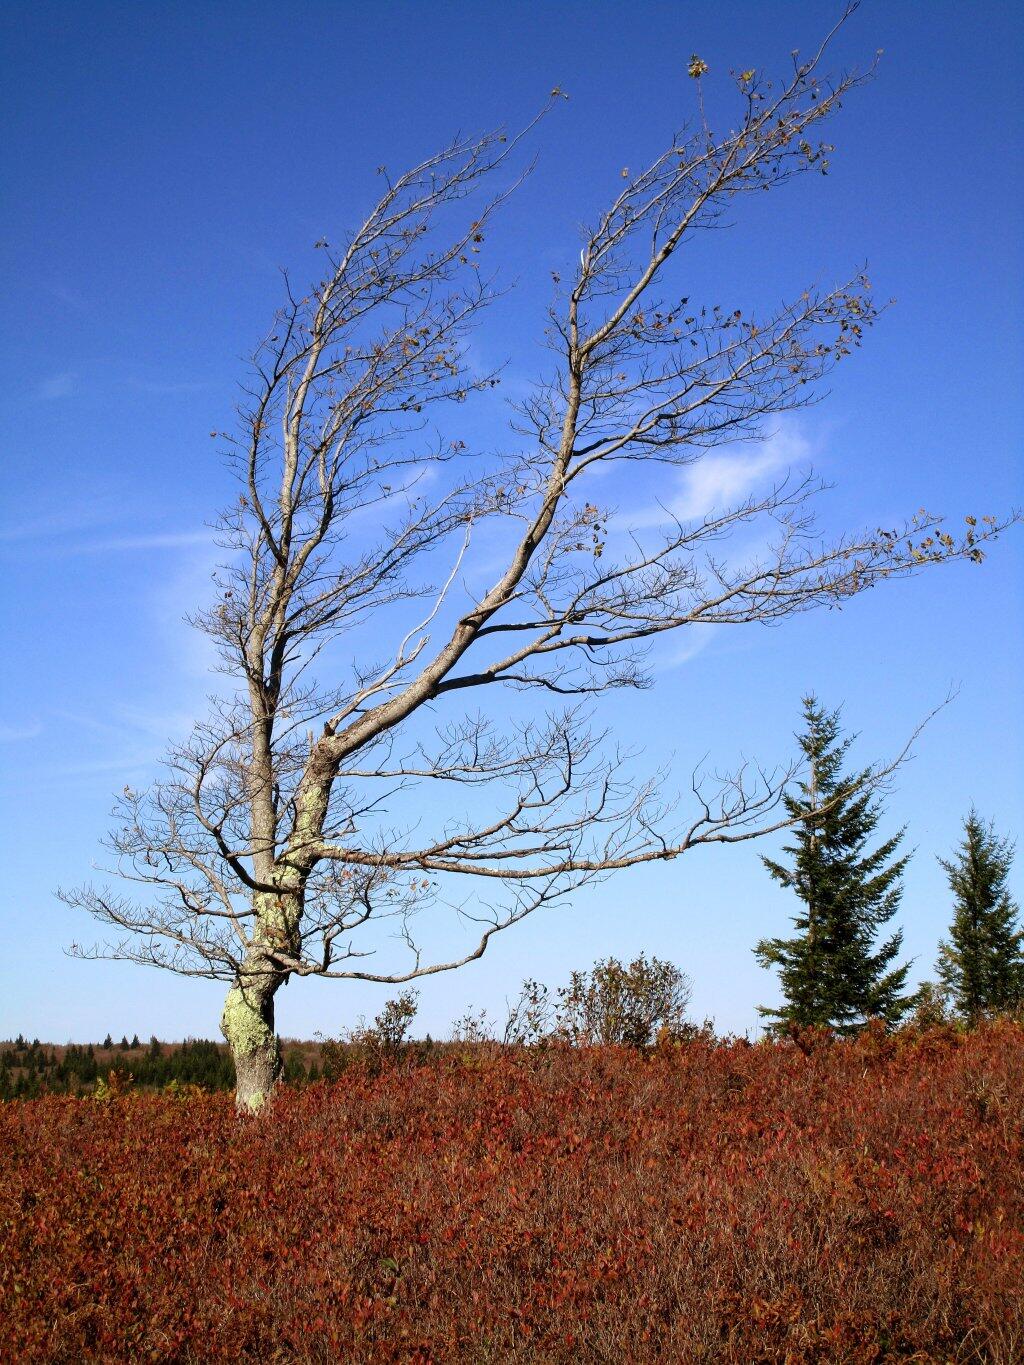
The few trees that can survive in the harsh conditions of the western-facing slopes of Allegheny Front show the changes brought on by the strong winds that sweep the sods during much of the year.

Friday October 11, 2019 — Delmar, NYBonner Lake State Forest 🗺Granger State Forest 🗺Peter Scott Swamp Freshwater Wetlands 🗺Point Peninsula Wildlife Management Area 🗺South Hill State Forest 🗺Urbana And Pigtail Hollow State Forests 🗺PDF with All Maps 📚
Map: Berrymill Pond Trail From North

Changes

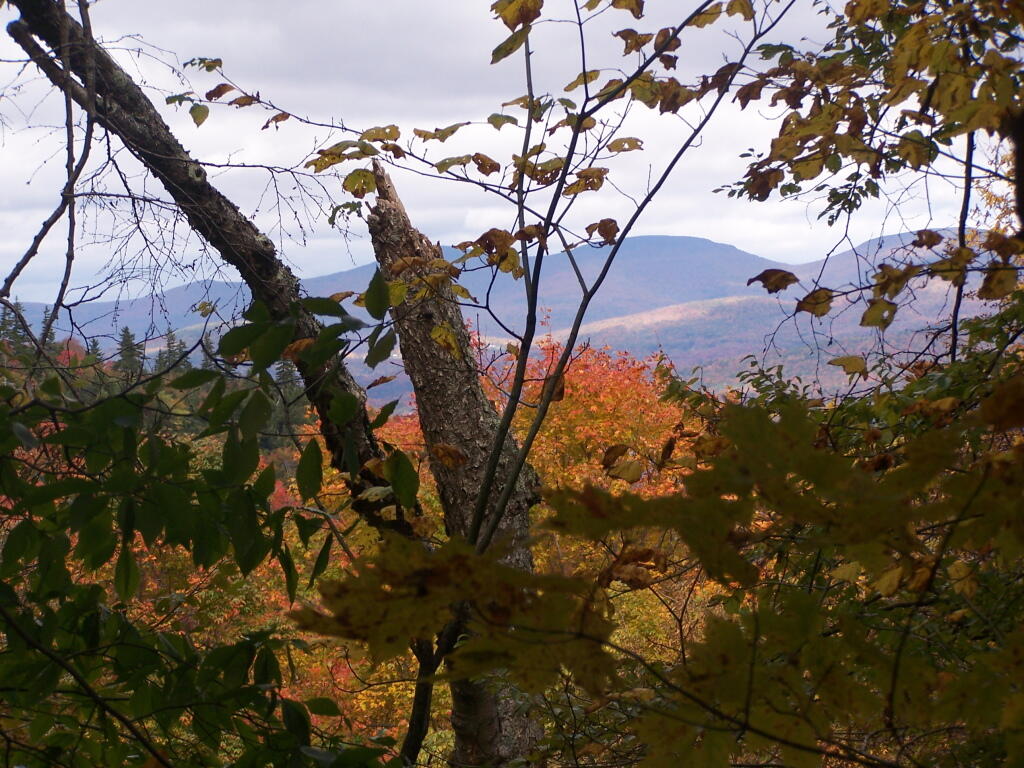
The palette of colors in the Albany Pine Bush Preserve is always changing, and the autumn season is no different.

Saturday October 19, 2019 — Albany Pine Bush
Map: Wilcox Lake - Willis Lake Trail

Shots – Health News : NPR

How The Ivermectin Culture Wars Took Off : Shots – Health News : NPR

U.S. health authorities and most doctors do not recommend using it to prevent or treat COVID-19, citing a lack of clear evidence on whether the drug works. Yet myths and beliefs around the drug have taken on a life of their own, fueled by a small group of doctors whose views diverge from the medical consensus, by right-wing commentators and by internet groups where people share tips on sourcing and dosing.

The thing about Ivermectin cultural wars, is not the stupid people who are making themselves sick taking it, but all the farmers and homesteaders with sick livestock that can't get an essential  dewormer for their livestock. Folks goats, sheep and other stock are literally dying because of idiots buying up the supply of this essential pesticide.

I noticed the Overpass Mono and Nimbus Sans fonts I used in the SVG exports from ggplot2 charts I posted yesterday don’t render correctly on machines without the fonts installed, as they are not embedded in the SVG file unlike charts I’ve made with MatplotLib

REVISED 10/22, fixed code

The code I posted earlier in the week ago didn’t work correctly. New code works.

I noticed the Overpass Mono and Nimbus Sans fonts I used in the SVG exports from ggplot2 charts I posted yesterday don’t render correctly on machines without the fonts installed, as they are not embedded in the SVG file unlike charts I’ve made with MatplotLib. It turns out there is a simple solution –just use grDevices::svg as the export device. The earlier code seemed to produce broken SVG files.

ggsave('filename.svg', width=1920, height=1080, units='px', dpi=150, device = grDevices::svg )
Map: Canadaway Creek Wildlife Management Area