US Census 📍
📽️ Videos

How many households made less then $20,000 in 2024?
The most recent Census data available in May 2026 is from 2024. $20,000 a year even two years was pretty darn poor for household to live on, though many households do especially in the south.
| Rank | State | Households Making Under $20,000 |
|---|---|---|
| 1 | Puerto Rico | 40.18% |
| 2 | Mississippi | 18.08% |
| 3 | Louisiana | 17.45% |
| 4 | West Virginia | 16.26% |
| 5 | New Mexico | 15.95% |
| 6 | Kentucky | 15.41% |
| 7 | Arkansas | 15.27% |
| 8 | Alabama | 15.13% |
| 9 | Oklahoma | 13.56% |
| 10 | South Carolina | 13.21% |
| 11 | District of Columbia | 12.91% |
| 12 | New York | 12.78% |
| 13 | Tennessee | 12.74% |
| 14 | Ohio | 12.55% |
| 15 | Michigan | 12.23% |
| 16 | North Carolina | 12.20% |
| 17 | Missouri | 12.08% |
| 18 | Rhode Island | 12.08% |
| 19 | Georgia | 11.94% |
| 20 | Pennsylvania | 11.54% |
| 21 | Florida | 11.48% |
| 22 | Illinois | 11.46% |
| 23 | Indiana | 11.38% |
| 24 | Texas | 11.29% |
| 25 | Maine | 11.29% |
| 26 | North Dakota | 11.16% |
| 27 | Montana | 11.12% |
| 28 | Wyoming | 10.90% |
| 29 | Oregon | 10.75% |
| 30 | Nevada | 10.62% |
| 31 | Nebraska | 10.54% |
| 32 | Kansas | 10.52% |
| 33 | South Dakota | 10.49% |
| 34 | Massachusetts | 10.48% |
| 35 | Iowa | 10.46% |
| 36 | Arizona | 10.38% |
| 37 | Connecticut | 10.11% |
| 38 | Wisconsin | 9.96% |
| 39 | Vermont | 9.94% |
| 40 | California | 9.77% |
| 41 | Virginia | 9.46% |
| 42 | Delaware | 9.17% |
| 43 | Idaho | 9.12% |
| 44 | New Jersey | 9.04% |
| 45 | Minnesota | 9.03% |
| 46 | Hawaii | 8.97% |
| 47 | Maryland | 8.96% |
| 48 | Washington | 8.69% |
| 49 | Alaska | 8.69% |
| 50 | Colorado | 8.62% |
| 51 | New Hampshire | 7.86% |
| 52 | Utah | 6.97% |
Here is the simple R code to make this table using tidycensus and gt:
library(tidyverse)
library(tidycensus)
library(gt)

income <- get_acs(
  geography = "state",
  table = "B19001",
  year = 2024,
  output = "wide",
  survey = "acs5",
  geometry = FALSE);

income  |>
  select(ends_with('E'), -ends_with('001E')) |>
  rowwise()|>
  mutate(total = sum(across(matches('\\dE')))) |>
  mutate(across(matches('\\dE'), \(x) x/total)) |>
  transmute(State=NAME, `Households Making Under $20,000` = sum(across(c(B19001_002E, B19001_003E, B19001_004E)))) |>
  ungroup() |>
  arrange(desc(`Households Making Under $20,000`)) |>
  mutate(Rank = row_number(), .before=1) |>
  gt() |>
  fmt_percent(3)


The Rich Men North of Richmond (Median Household Income)
I'd say they probably live in either Fairfax County VA or Bethesda CDP, MD.
For those playing along at home, here is the code for making this map up and interpolating the missing data: https://github.com/AndyArthur/r_maps_and_graphs/blob/main/Richmen North of Richmond Map.R
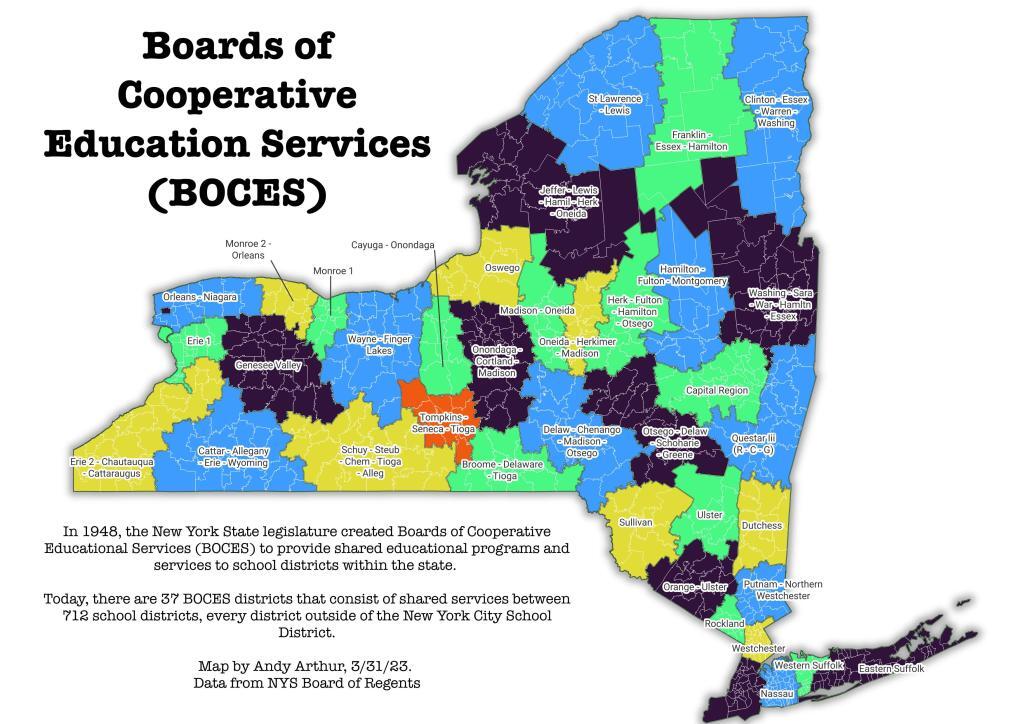
BOCES Districts
In 1948, the New York State legislature created Boards of Cooperative Educational Services (BOCES) to provide shared educational programs and services to school districts within the state. Today, there are 37 BOCES districts that consist of shared services between 712 school districts, every district outside of the New York City School District.