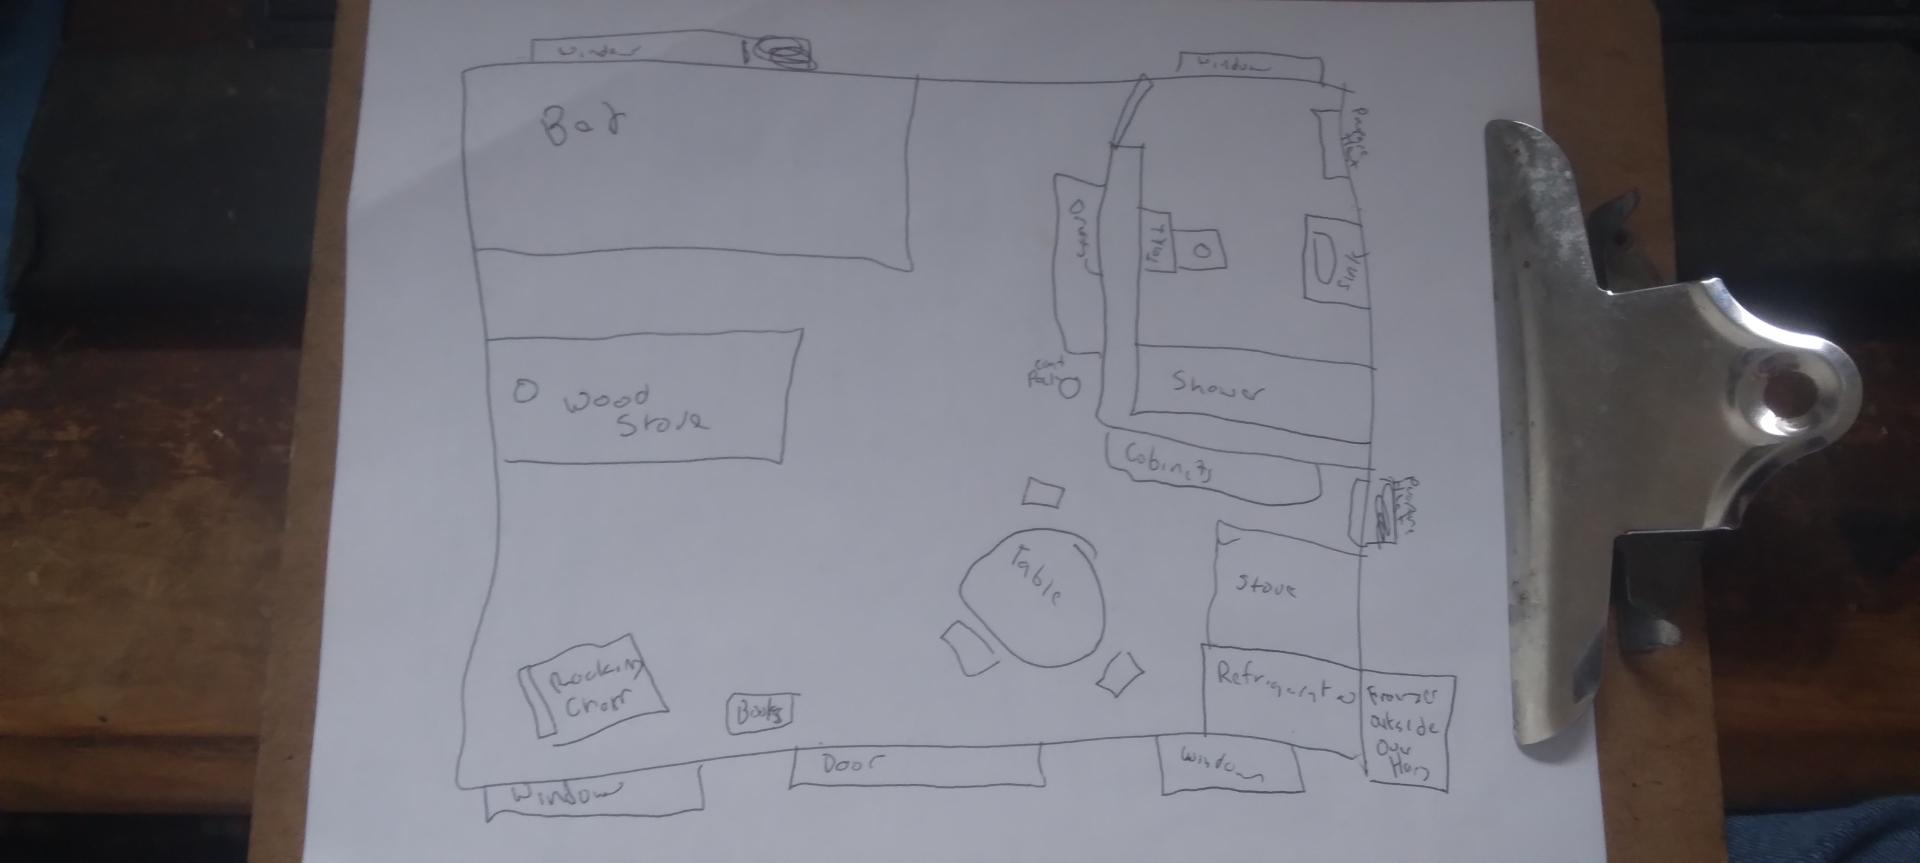
A first draft of what my dream home would look like  🖼️

Download a High Resolution JPEG Image of the A first draft of what my dream home would look like or an Adobe Acrobat Printable PDF of the A first draft of what my dream home would look like.

A first draft of what my dream home would look like ...

Simple, small and cozy, different from the large suburban homes of today. By no means a tiny home which is defined as under 500 square feet but probably in the ratio of what would be considered a small house - 900 or so square feet which is roughly 30 feet by feet. I'm teaching myself CAD to see if I can design something a bit better looking before actively seeking out architectural and design services and reading up to learn about all things on building your own house.

Taken on Saturday March 2, 2024 at Work.

Location: 42.6143, -73.8517 📌

SVGZ Graphic: West Virginia Population Density

More about Work...

Map: Cowee State Forest
Map: New York State Manufacturing Employee Salary
SVGZ Graphic: 2022 Percentage of Workers that are Union Members
SVGZ Graphic: Average Wage in New York State
SVGZ Graphic: Change in the Number of Jobs, April 2022 vs April 2012
SVGZ Graphic: Change in Union Membership, 2020 to 2021
SVGZ Graphic: Computer System Anaylsts Median Annual Wage
SVGZ Graphic: Largest Major Employment Sector
SVGZ Graphic: LAUS - Peak Year of Employment by County
SVGZ Graphic: Managers Median Annual Wage
SVGZ Graphic: Manufacturing Median Wage
SVGZ Graphic: Median Average Wage of Foresters
SVGZ Graphic: Median Average Wage of Tax Preparers
SVGZ Graphic: New York State Unemployment Rate - 2011 through 2024
SVGZ Graphic: Number of Babies Born in the United States
SVGZ Graphic: NYS Labor Force, Changes 2011-2022
SVGZ Graphic: Office of Lawyers Median Wage
SVGZ Graphic: Percent Change in Jobs, 1990 vs 2019
SVGZ Graphic: Percent Change in Total Employed, April 2022 vs April 2012
SVGZ Graphic: Percent of Employees that are Cashiers
SVGZ Graphic: Percent of Population that Works in Construction
SVGZ Graphic: Percentage Change in Jobs
SVGZ Graphic: Persons who Walk to Work
SVGZ Graphic: State Minimum Wage, 1968-2022
SVGZ Graphic: unemployment-rate2025-09-01
SVGZ Graphic: Year of Peak Employment by County
Thematic Map: Median Yearly Wages
Thematic Map: Percent of Employment as Fast Food Workers
Photo: Got my new aerial photo hung up in the office
Photo: Darn it's raining out
Photo: Just another day in the office ...

Leave a Reply

Your email address will not be published. Required fields are marked *