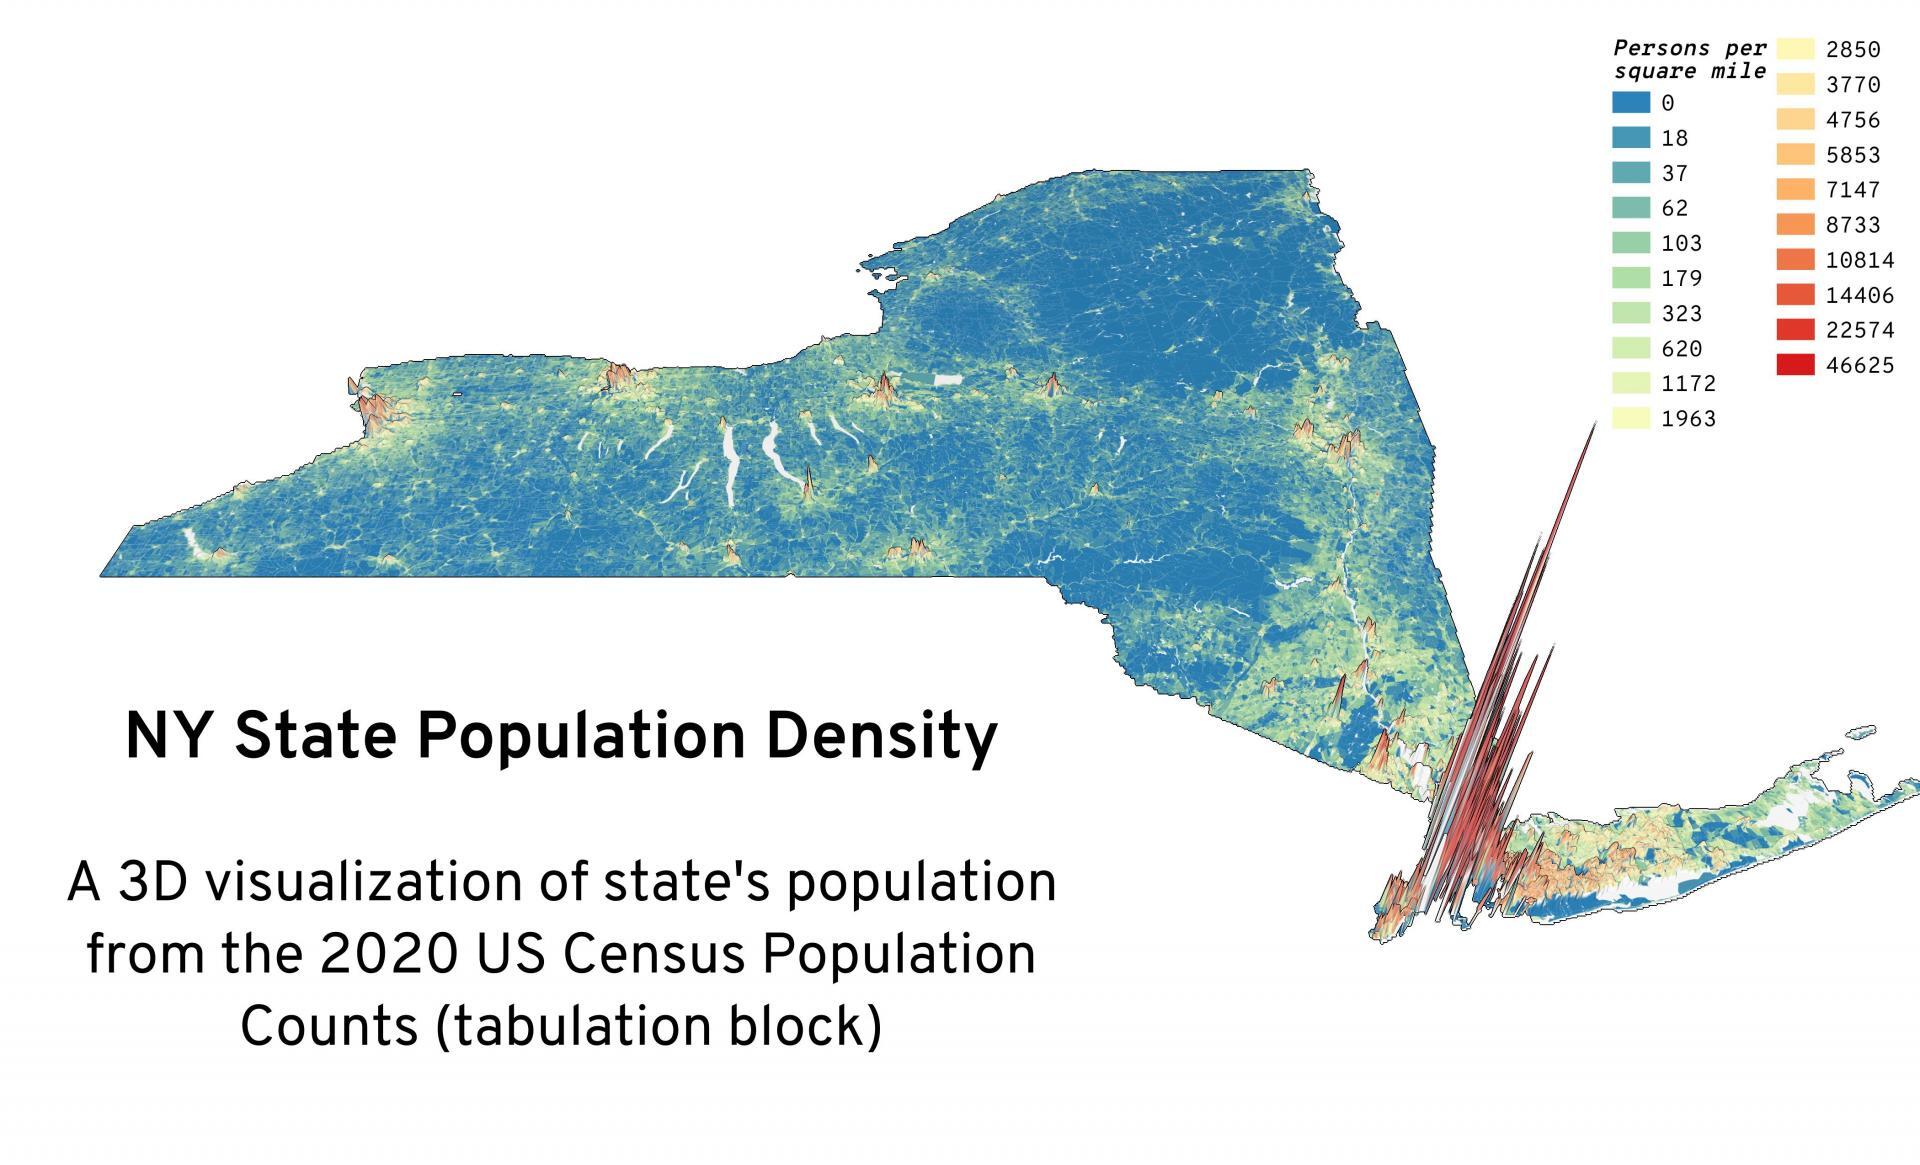
New York State Population Density 🗺️

Download a High Resolution JPEG Image of the New York State Population Density or an Adobe Acrobat Printable PDF of the Thematic New York State Population Density.
About New York State Population Density ....
A 3D Map I was inspired to create where mountains represent densely populated parts of the state where there are many people residing per square mile.

More about New York State...
New York is a state in the Northeastern region of the United States. New York is the 27th-most extensive, the 3rd-most populous, and the 7th-most densely populated of the 50 United States. New York is bordered by New Jersey and Pennsylvania to the south, and by Connecticut, Massachusetts and Vermont to the east. The state has a maritime border with Rhode Island east of Long Island, as well as an international border with the Canadian provinces of Ontario to the west and north, and Quebec to the north. The state of New York is often referred to as New York State to distinguish it from New York City.


No Comments
Hi! I was wondering how you went about creating this map and if you had any other tips — I’m a researcher at Columbia Med and trying to utilize residential/population density in a research project. If you have any time, please reach out to me! Thanks so much.
I would recommend using R and the tidycenus library for getting and processing the Census data. That is the easier and most flexible way to work with Census data, especially if you need to process a lot of it.
https://walker-data.com/census-r/
To get the raster population density as a tiff file to read into your GIS program to make the 3D, you could use tidycensus, terra, sf:
library(tidyverse)

library(tidycensus)

library(raster)

library(sf)
# get tract level population from 2020 census
pop <- get_decennial(year = 2020, geography = 'tract', variables = 'P1_001N', state='ny', geometry = T) pop <- pop %>% st_transform(26918)
# create a blank raster based on the shape of nys
r <- rast(pop, nrows=10000, ncols=10000) # calculate population density then covert vector to a raster pop %>%
mutate(density = value / (st_area(.) %>% units::set_units('mi^2'))) %>%
rasterize(r, field='density') %>% writeRaster('/tmp/output.tif', overwrite=T)
I used QGIS to do the 3D rendering.
Can you do a dot density map of New York State? (I mean with each dot representing x amount of people. I have no idea if there are other types of dot density maps!)
Here you go … https://andyarthur.org/thematic-map-each-dot-represents-a-census-block-with-100-new-yorkers.html