Building Shadow Analysis Program
Earlier this week I wrote a small PHP script for analysis of the shadow cast by buildings on the surrounding landscape. To obtain sun position and altitude, it relies on SunCalc PHP which must be included in the script. It goes throughout the year, churning out how much of a shadow a building will produce each hour, in feet and direction. Additionally, the script will calculate the maximum point the shadow will be cast as a set of coordinates.
<?php
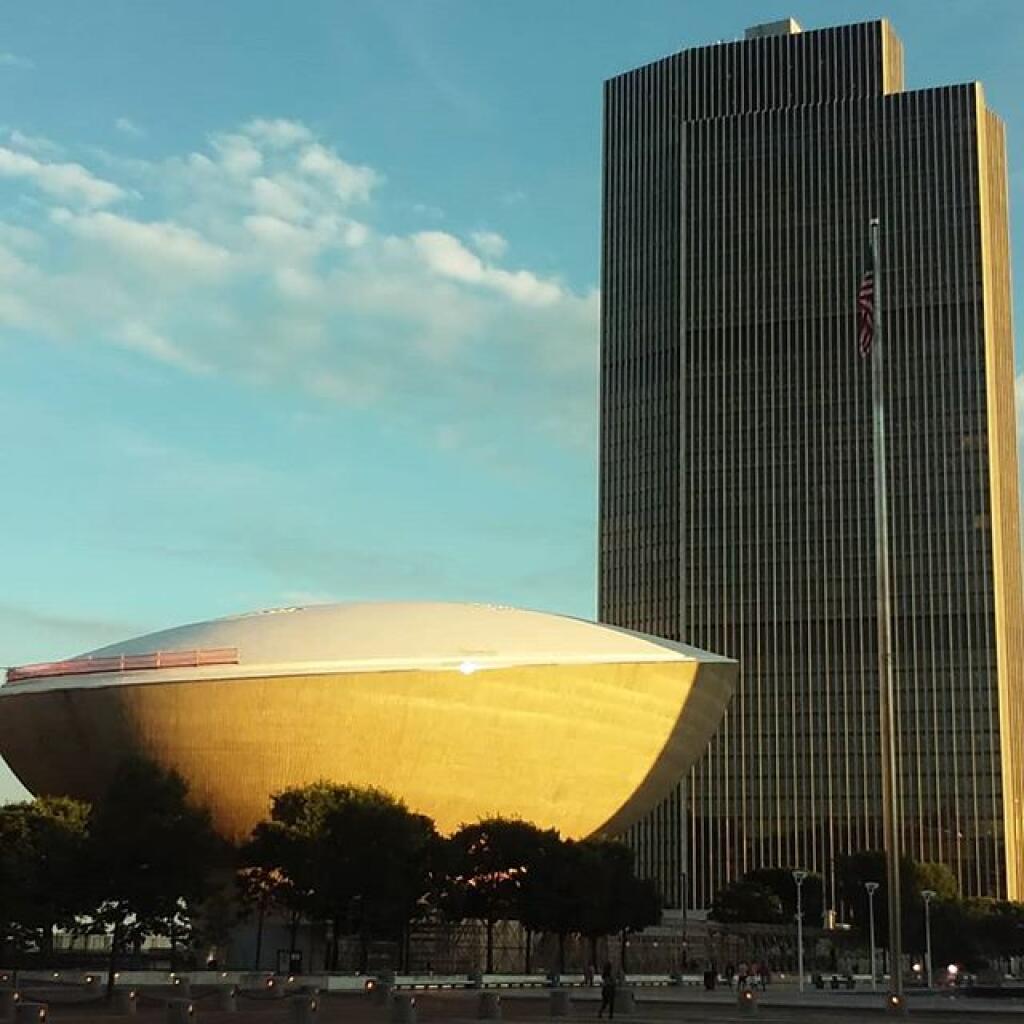
// The current values entered into this script currently are for the Empire Plaza.
$latitude = 42.64915;
$longitude = -73.75950;
$height = 610;
$start = strtotime("January 1, 2020 12 AM");
$end = strtotime("December 31, 2020 11 PM");
include("suncalc.php");
// Compass as a Reference
$compass = array(
'north', 'north-northeast', 'northeast',
'east-northeast', 'east', 'east-southeast',
'southeast', 'south-southeast', 'south',
'south-southwest', 'southwest',
'west-southwest', 'west', 'west-northwest',
'northwest', 'north-northwest');
function newPos($lat, $lng, $dist, $dir) {
// Earth Radius in KM
$R = 6378.14;
// distance in feet to KM
$d = (($dist * 0.3048) / 1000);
// Degree to Radian
$lat1 = $lat * (M_PI/180);
$lng1 = $lng * (M_PI/180);
$brng = $dir * (M_PI/180);
// Really Complicated Math (TM) that works based on the HAVERSINE formula from
// https://stackoverflow.com/questions/7222382/get-lat-long-given-current-point-distance-and-bearing
$lat2 = asin(sin($lat1)*cos($d/$R) + cos($lat1)*sin($d/$R)*cos($brng));
$lng2 = $lng1 + atan2(sin($brng)*sin($d/$R)*cos($lat1),cos($d/$R)-sin($lat1)*sin($lat2));
# back to degrees
$lat2 = $lat2 * (180/M_PI);
$lng2 = $lng2 * (180/M_PI);
return "$lat2,$lng2";
}
$output = "Month,Day,Hour,Sun Angle,Sun Position,Sun Pos Name,Shadow Length,Shadow Direction,Shadow Dir Name,Orginal Lat, Original Lng, Maximum Shadow Lat, Maximum Shadow Lng\n";
for ($time = $start; $time &lt; $end; $time += 60*60) { // get sun position for time $timeObj = new DateTime(); $timeObj-&gt;setTimestamp($time);
$sc = new AurorasLive\SunCalc($timeObj, $latitude, $longitude);
$sunPos = $sc-&gt;getSunPosition($timeObj);
// don't include any time when sun is below the horizon
if ($sunPos-&gt;altitude*(180/M_PI) &lt; 0) continue; // add month, day, hour $output .= date('n,j,G,',$time); // get sun altitude $output .= $sunPos-&gt;altitude*(180/M_PI).',';
// get sun position
$output .= 180+$sunPos-&gt;azimuth*(180/M_PI).',';
$output .= $compass[round((180+$sunPos-&gt;azimuth*(180/M_PI))/ 22.5) % 16].',';
// shadow length
$output .= $height/tan(deg2rad($sunPos-&gt;altitude*(180/M_PI))).',';
// shadow direction
$shadowDir = $sunPos-&gt;azimuth*(180/M_PI) + 360;
if ($shadowDir &gt; 360) $shadowDir -= 360;
$output .= $shadowDir.',';
$output .= $compass[round($shadowDir/ 22.5) % 16].',';
// building latitude and longitude
$output .= "$latitude, $longitude,";
// maximum extent of shadow
$output .= newPos($latitude, $longitude, $height/tan(deg2rad($sunPos-&gt;altitude*(180/M_PI))), $shadowDir).",";
$output .= "\n";
}
echo $output;
Here is an example output:
Month,Day,Hour,Sun Angle,Sun Position,Sun Pos Name,Shadow Length,Shadow Direction,Shadow Dir Name,Orginal Lat, Original Lng, Maximum Shadow Lat, Maximum Shadow Lng
1,1,8,4.370562595888,127.16997476055,southeast,7981.2630997694,307.16997476055,northwest,42.64915, -73.7595,42.662350867593,-73.783180446551,
1,1,9,12.464234785715,138.47001937172,southeast,2759.6833421566,318.47001937172,northwest,42.64915, -73.7595,42.654806428356,-73.766311948646,
1,1,10,18.826346377511,151.18871989968,south-southeast,1789.1660233981,331.18871989968,north-northwest,42.64915, -73.7595,42.653442385927,-73.762710054908,
1,1,11,22.92597731207,165.29270254371,south-southeast,1442.2476816852,345.29270254371,north-northwest,42.64915, -73.7595,42.652969571748,-73.76086316453,
1,1,12,24.317973645092,180.27827074558,south,1349.8710413416,0.27827074557518,north,42.64915, -73.7595,42.652845989302,-73.7594755931,
1,1,13,22.827705402895,195.24737437252,south-southwest,1449.1706789769,15.247374372522,north-northeast,42.64915, -73.7595,42.652978239559,-73.758081165062,
1,1,14,18.641667869753,209.31025239405,south-southwest,1808.2272087538,29.310252394054,north-northeast,42.64915, -73.7595,42.653467170112,-73.756204500047,
1,1,15,12.211118961179,221.98033545934,southwest,2818.7133569306,41.980335459338,northeast,42.64915, -73.7595,42.654887013398,-73.752480800429,
1,1,16,4.0670753820534,233.23837174035,southwest,8579.0650125467,53.238371740354,northeast,42.64915, -73.7595,42.663205632648,-73.733908619093,
1,2,8,4.3645441749857,127.03353849744,southeast,7992.3115188513,307.03353849744,northwest,42.64915, -73.7595,42.662327567958,-73.783255965565,
1,2,9,12.476443037614,138.33095911417,southeast,2756.8958218911,318.33095911417,northwest,42.64915, -73.7595,42.654788550435,-73.766323694576,
1,2,10,18.860737296743,151.04916237459,south-southeast,1785.6561891219,331.04916237459,north-northwest,42.64915, -73.7595,42.653428213262,-73.762717935368,
1,2,11,22.985140372821,165.15894624042,south-southeast,1438.1068136859,345.15894624042,north-northwest,42.64915, -73.7595,42.652956261035,-73.760871335783,
1,2,12,24.401639825801,180.15947237405,south,1344.6352402431,0.15947237405339,north,42.64915, -73.7595,42.652831682677,-73.759486067027,
1,2,13,22.932215921968,195.15131682951,south-southwest,1441.810083379,15.151316829514,north-northeast,42.64915, -73.7595,42.652960530629,-73.7580970562,
1,2,14,18.761308368827,209.23956034287,south-southwest,1795.8375075952,29.239560342872,north-northeast,42.64915, -73.7595,42.653440556697,-73.756234277101,
1,2,15,12.340240887742,221.93268535805,southwest,2788.302504508,41.932685358049,northeast,42.64915, -73.7595,42.654829364851,-73.752562956502,
1,2,16,4.2013827926665,233.20922777897,southwest,8303.8756666826,53.209227778967,northeast,42.64915, -73.7595,42.662764126188,-73.734739101558,