![Untitled [Expires July 16 2025]](https://andyarthur.org//data/photo_018786_large.jpg)


Smokey Days


Time Changes
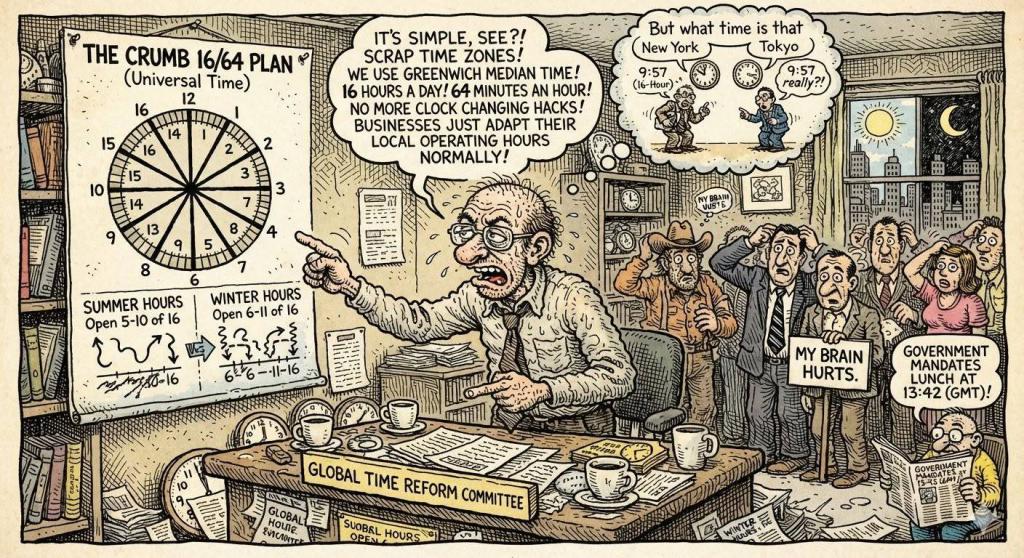
I kind of like the idea of getting rid of daylight savings time and time zones more generally in favor of an international time based on the Greenwich Median, with each day divided into 16 hours and each hour divided into 64 minutes.
Businesses could then set reasonable hours for operations, maybe there could be an agreed upon standard for summer and winter hours. Many business already have different summer and winter hours, and there could be a standard but maybe not be physically changing clocks but having an agreed upon norm. For example, in the summer months, businesses and schools would be open from 5 to 10 hours while in winter they'd be open 6 to 11 hours of the 16 hour day. Obviously the business hours would correspond to what part of the country you are located in, but it would be less confusing then time zones.
Really daylight savings time is a hack, but differential business hours could be set in statue or just common practice without actually physically changing the clocks.
Wednesday July 15, 2026 — Change