Day: December 9, 2021💾
📽️ Videos

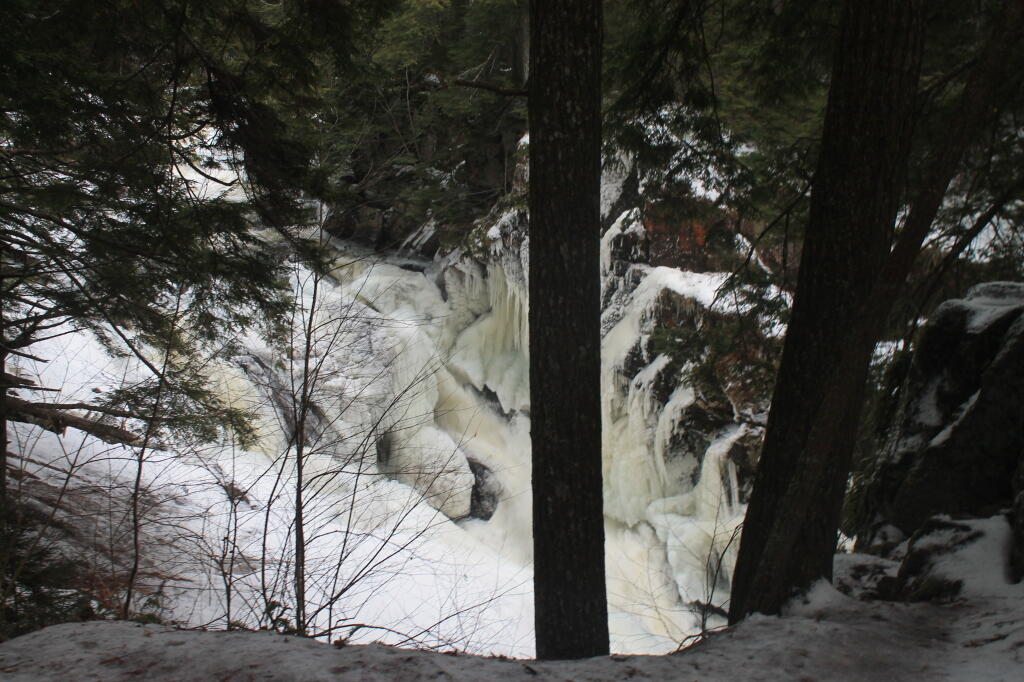
Auger Falls

Jenks breaks and ggplot
Here is how to create Jenks breaks classification for maps with ggplot2 with class labels that show only the top number in the class.
classes <- classIntervals(joined$Value, n = 9, style = "fisher")

joined <- joined %>% mutate(percent_class = cut(joined$Value, breaks=classes$brks, include.lowest = T,
labels=scales::comma(classes$brks[2:length(classes$brks)]),0) )
Tuesday after work I’ve scheduled my COVID-19 booster and TDAP booster
Tuesday after work I’ve scheduled my COVID-19 booster and TDAP booster. Mom has been urging me for years to get tetanus booster and I honestly don’t have much of an interest in getting the actual COVID or whooping cough either. Neither sounds like much fun.
Terra – December 9, 2021
A clear morning shows the snow that has fallen over the land overnight.
