
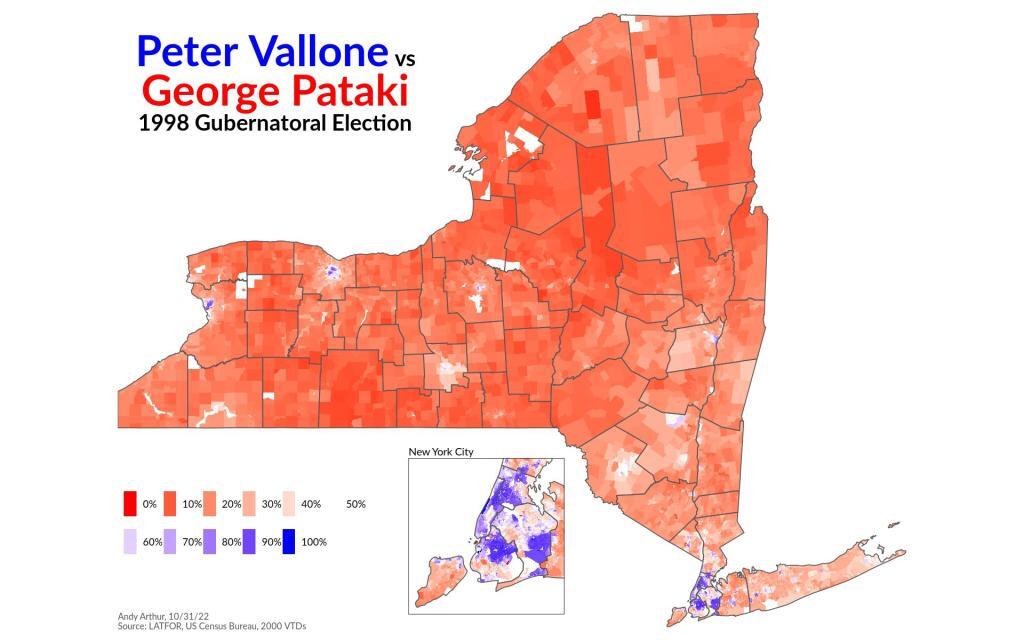
Peter Vallone vs George Pataki (1998)
24 years ago, a very red year at least for the Governor's race, with George Pataki receiving 54.3% of the vote to Peter Vallone's 33.2%. This was a three-way race, with Tom Golisano getting 7.7% of the vote, but for sake of mapping I ignored that. Peter Vallone really didn't win much outside of New York City, and the bluest of blue areas in Upstate cities.
With this I learned a lot about how to read fixed width files into R. It's actually not hard if you have the separate header files, and use the read_fwf to set the widths based on the header file. Which is good because a lot of old data is in fixed width format, especially things from the 1960s and 1970s but also later decades too for big datasets. You can get the R code for making the map: https://github.com/AndyArthur/r_maps_and_graphs/blob/main/pataki_v_vallone_1998_map.R
