Animated maps

I wrote a plugin to create animated maps – usually over time but it could represent something else if I wanted. The code addresses the weaknesses of the QGIS’ built in time feature which has potential but is quite under developed at this point.

While my plug in is rough around the corners, often crashes and relies heavily on iterating through shapefiles and the ffmpeg program externally, the output is pretty stunning – see Facebook posts below for details. At some point I might release the code but it’s embarrassingly crude and buggy right now even if the output is high quality when it works.

Map: Alma Pond
Map: Dobbins Memorial State Forest
Map: Little John Wildlife Management Area
Map: Otter Lake
Map: South Hill State Forest (Oneida 23)
Map: Summer Hill State Forest
Map: West Parishville State Forest
SVGZ Graphic: albany-snow-depth
SVGZ Graphic: college-rate
SVGZ Graphic: december-holidays
SVGZ Graphic: ht2025
SVGZ Graphic: lt2025
SVGZ Graphic: Places Named Bethlehem
SVGZ Graphic: Towns with Most Similiar Land Cover to the Town of Bethlehem
Terrain Map: Happy World Milk Day!
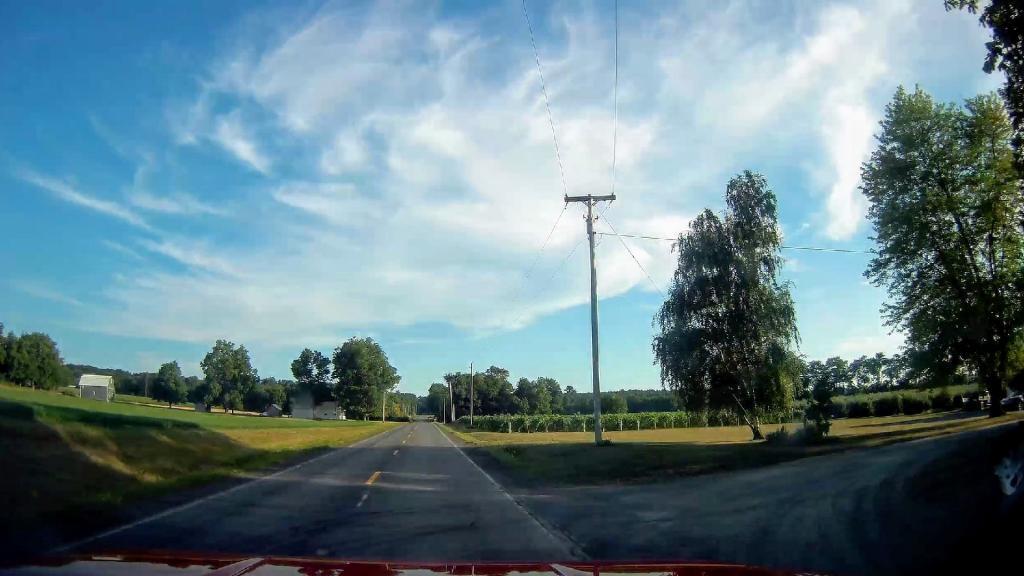
Photo: Wine Country 🍷
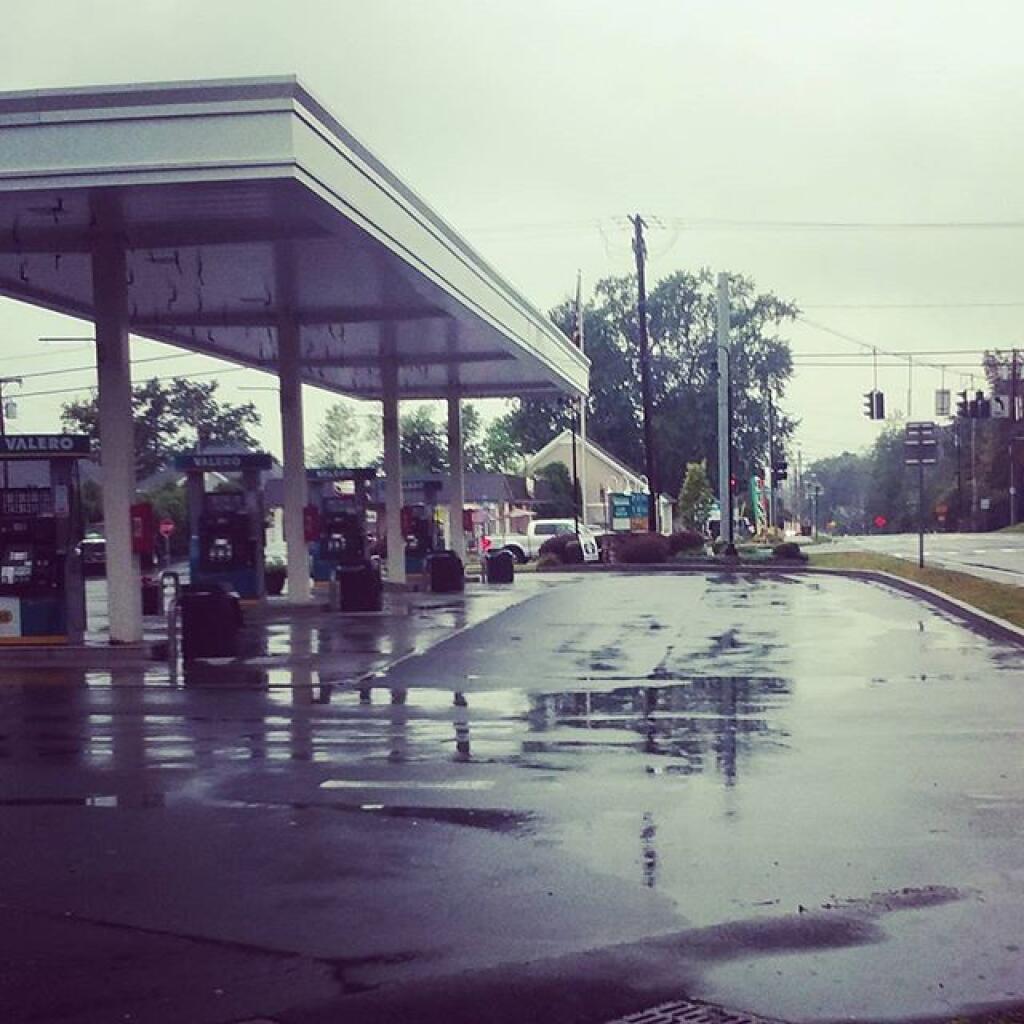
Photo: Rainy day
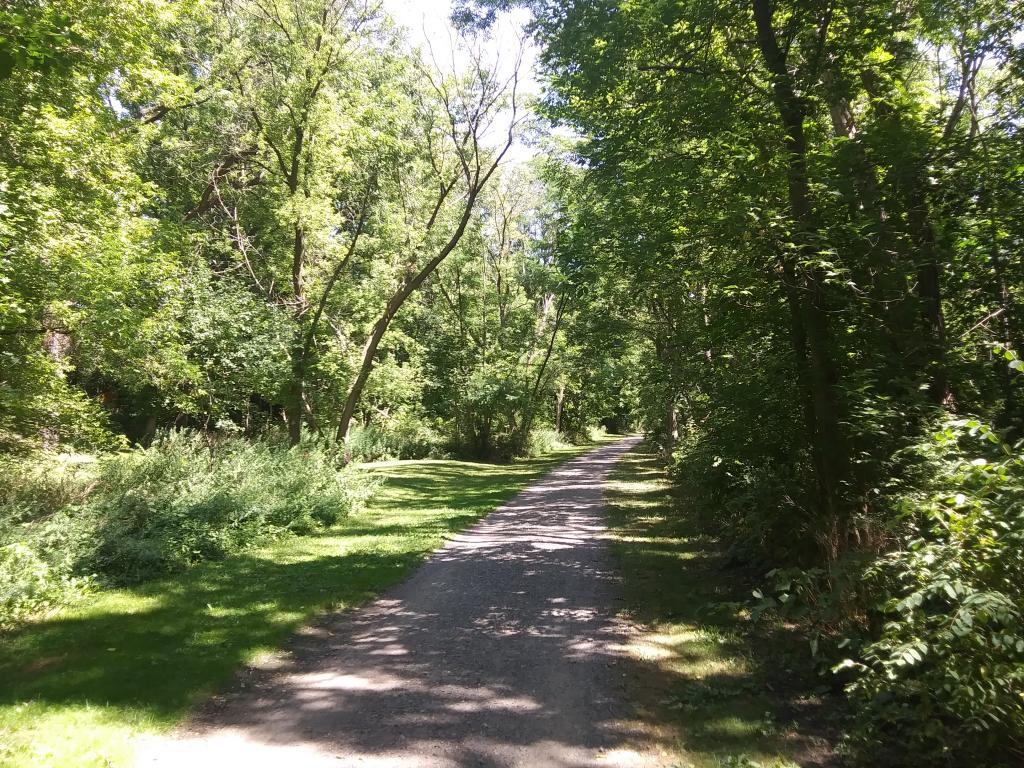
Photo: Nice quiet trail along the creek
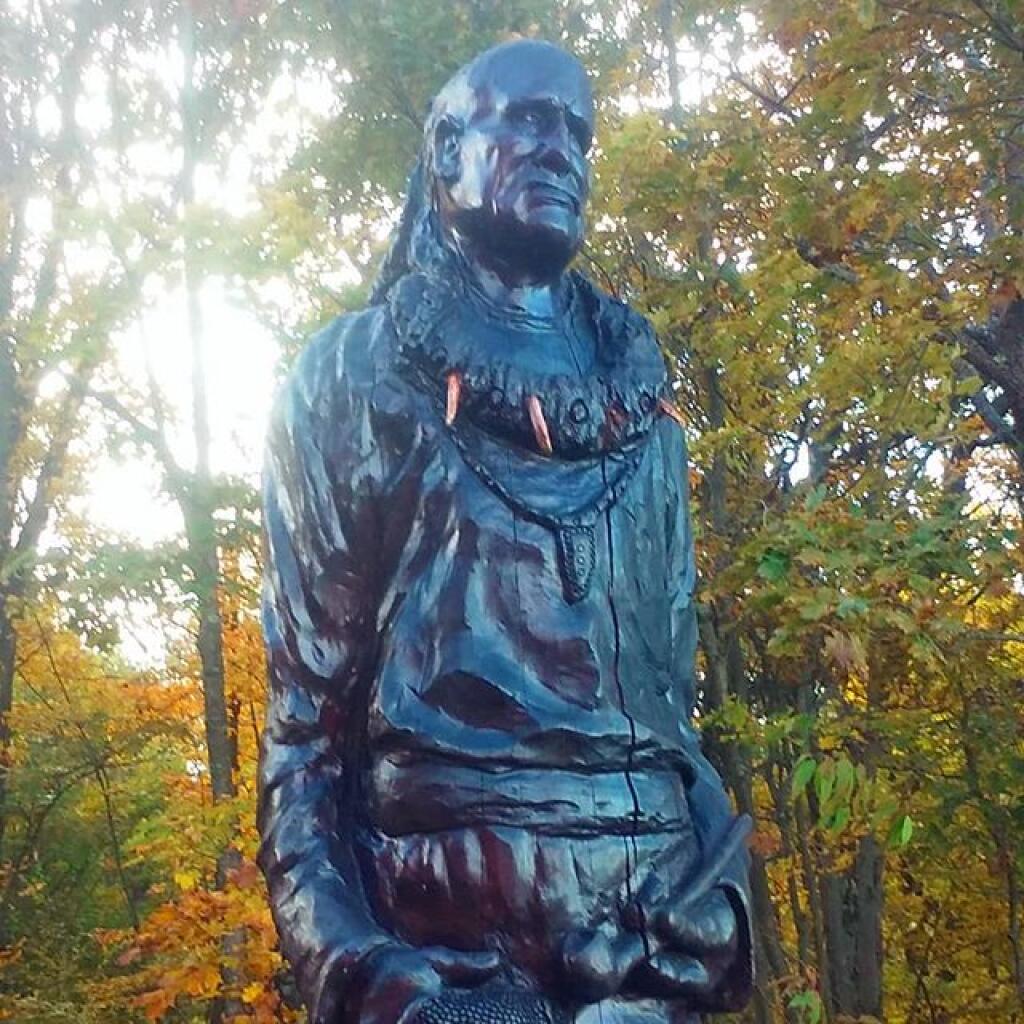
Photo: Cheif Watonagh
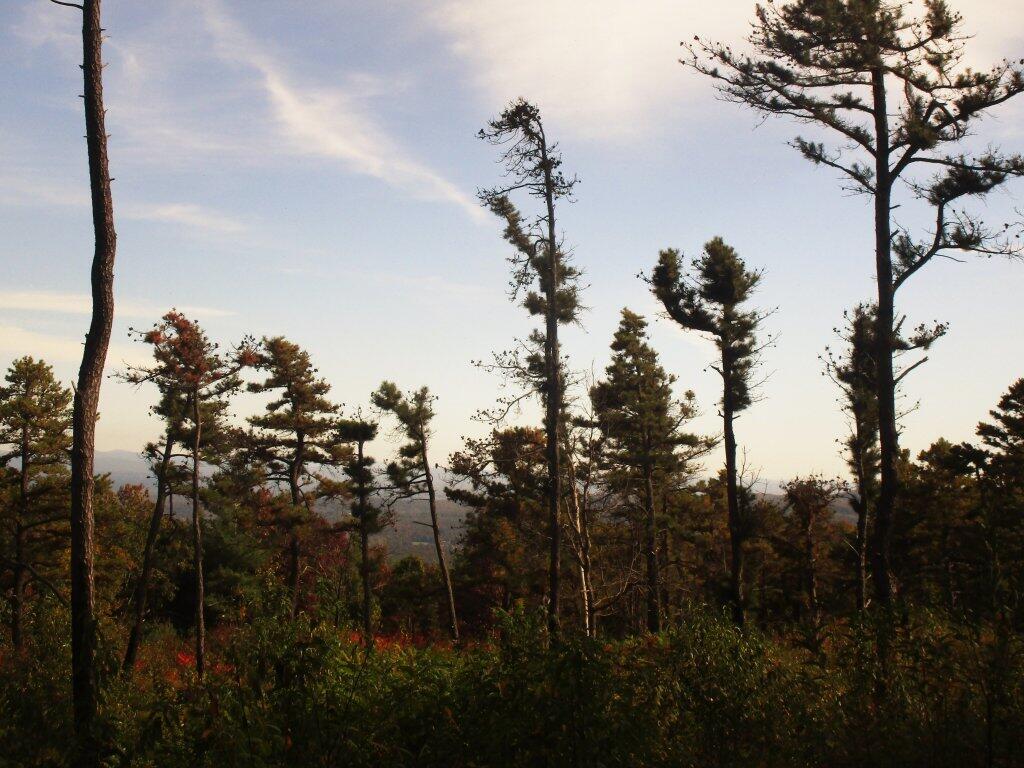
Photo: Mountain View
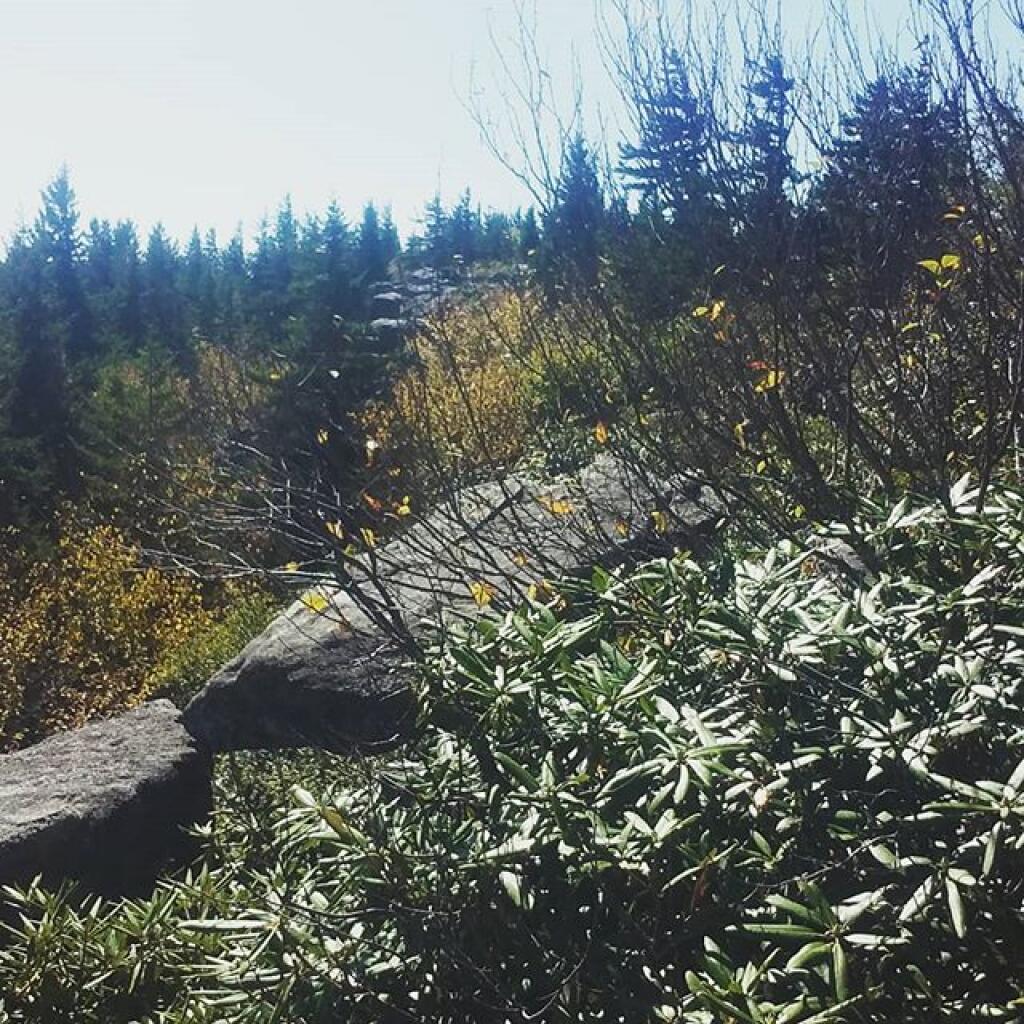
Photo: Mountain Laurel
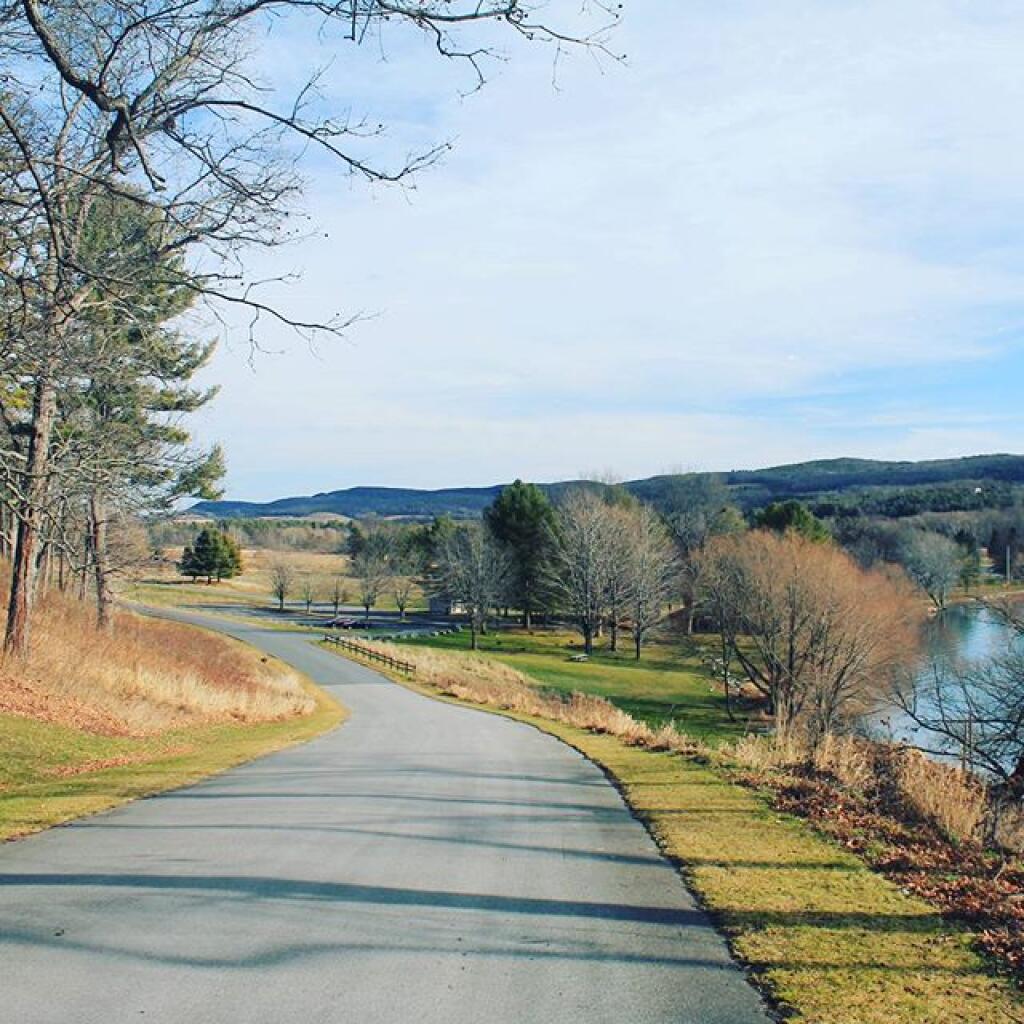
Photo: Roadway at Glimmerglass
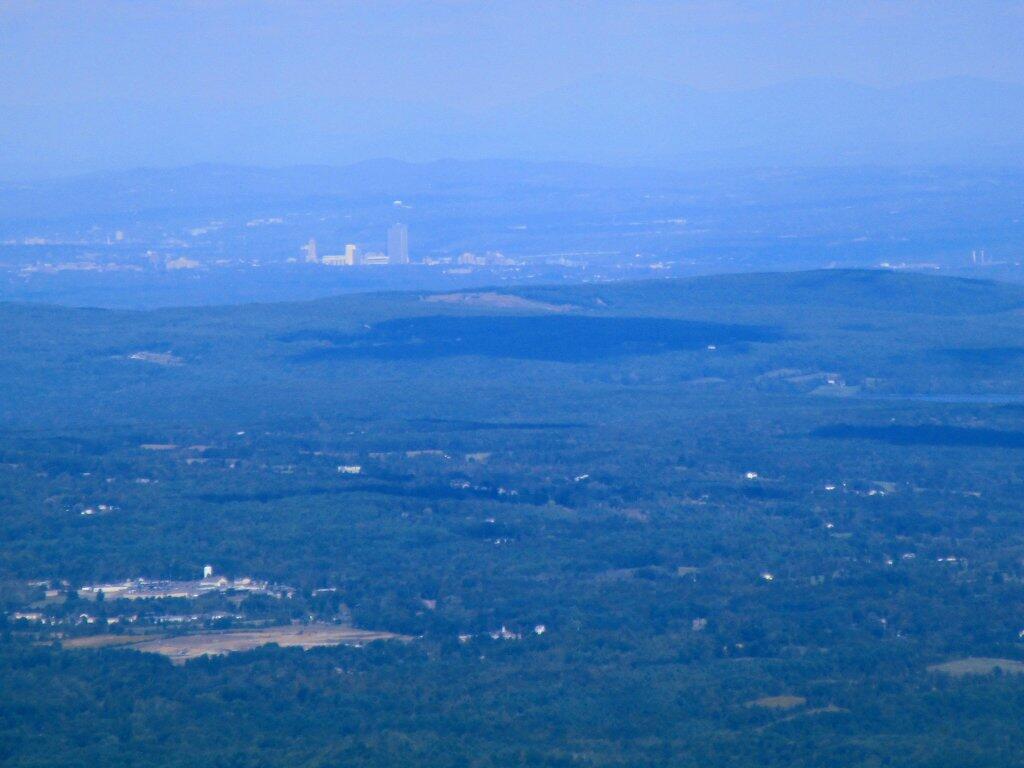
Photo: Albany From Windham High Peak
Photo: Happy Pride Month 🏳️‍🌈
Photo: Before Unionville Hill

Leave a Reply

Your email address will not be published. Required fields are marked *