Geographic Information Services (GIS) – Maps – Cartography 
I am an amateur cartographer who designs maps and does a wide variety geospatial analysis using free and open-source geographic information software (GIS) and public sources of data to design quality maps, graphs, charts and datasets. I am looking for new and interesting projects to improve my skills, make connections and expand my portfolio.
Mapping Avaliable
- Tax/Property Mapping
- High Resolution Aerial Photography
- Recreational Maps – Hunting, Camping, Hiking
- Georeference addresses using State Address Mapping service, plot them on a map
- Wetlands, Topographic Contours, Land Cover
- Compare historical aerial photos or maps to current photography
- Web mapping using leaflet (HTML/Javascript file to embed on a website or use at home)
Example maps can found below.
Services Available
- A list of property owners within 1,000 feet of a proposed development
- How many cars per day pass a business?
- How many people who live within 5 miles of a business or park?
- How many African Americans and Hispanics live within 10 miles of Albany Pine Bush?
- What are wealthiest election districts?
- How many people ride public transit in a neighborhood?
- How much of an area is wetland or farm field?
- How big an interchange?
- What is the average slope and elevation of an area or trail?
Example data can found below.
Pricing and Cost
For most projects, there is no fee. I am looking for experience, references, mentors and connections in the geospatial community.
If you have a large project, let’s talk about it. I might be willing to do it for free, if it’s something really interesting
or important like fighting suburban sprawl and pollution. I don’t a business or taxes set up, so I can’t really charge at this point.
How to get started?
Please send me an email describing the mapping or data project in as much detail as possible.
My email is andy@andyarthur.org
Data Avaliable
- US Census – 2019 American Community Survey, 2020 US Census
- NYS Tax and Assessment Rolls (2020)
- NYSDOT Traffic Counts and Road Data
- Historical Aerial Photography (primarily 1952, but earlier and later exist)
- ArcGIS REST/Services and WMS Services from state and local agencies
- LiDAR Elevation Profiles
- USGS Topographic Maps, historic and modern – with overlays if requested
- Data Repositories like CUGIR, DataNY.gov and NYSGIS
- Recreation data from NYSDEC
Software Used
- Quantum GIS (QGIS) including 3D Mapping
- Geodata Abstraction Library (GDAL, ogr2ogr)
- Python, including the data-science libraries PANDAS and GeoPANDAS
- LeafletJS Web Mapping Services
Geographies Avaliable
- Primary Capital Region and also much of New York State, also some for Pennsylvania, Vermont, West Virginia
- State, county, municipal, school districts – Most data sets
- Parks, highways, buffer (distance to) – Most data sets
- Election districts – Roughly 75% of NYS counties
- Census Tract or Blockgroup – 2019 American Community Survey
- Tabulation Block – 2020 US Census
Are printed maps avaliable at this time?
Not currently. I can send you a file based on your specifications to print at your local print shop.
How long do mapping projects take?
Depends on complexity of the project. Many projects only take minutes, however if a project requires georeferencing, data cleaning, or custom shapes or layouts, it might take significantly longer. More revisions lead to better quality output.
Do you make maps professionally?
No! This is just a hobby. But I’m interested in expanding my skills. I do a lot of mapping for my blog and in support of community organizations like Save the Pine Bush.
Are my maps of good quality?
Thats for you to decide. I don’t have formal education in map making, and I don’t have professional tools. But do take a look at the work I’ve done below.
Examples of Maps
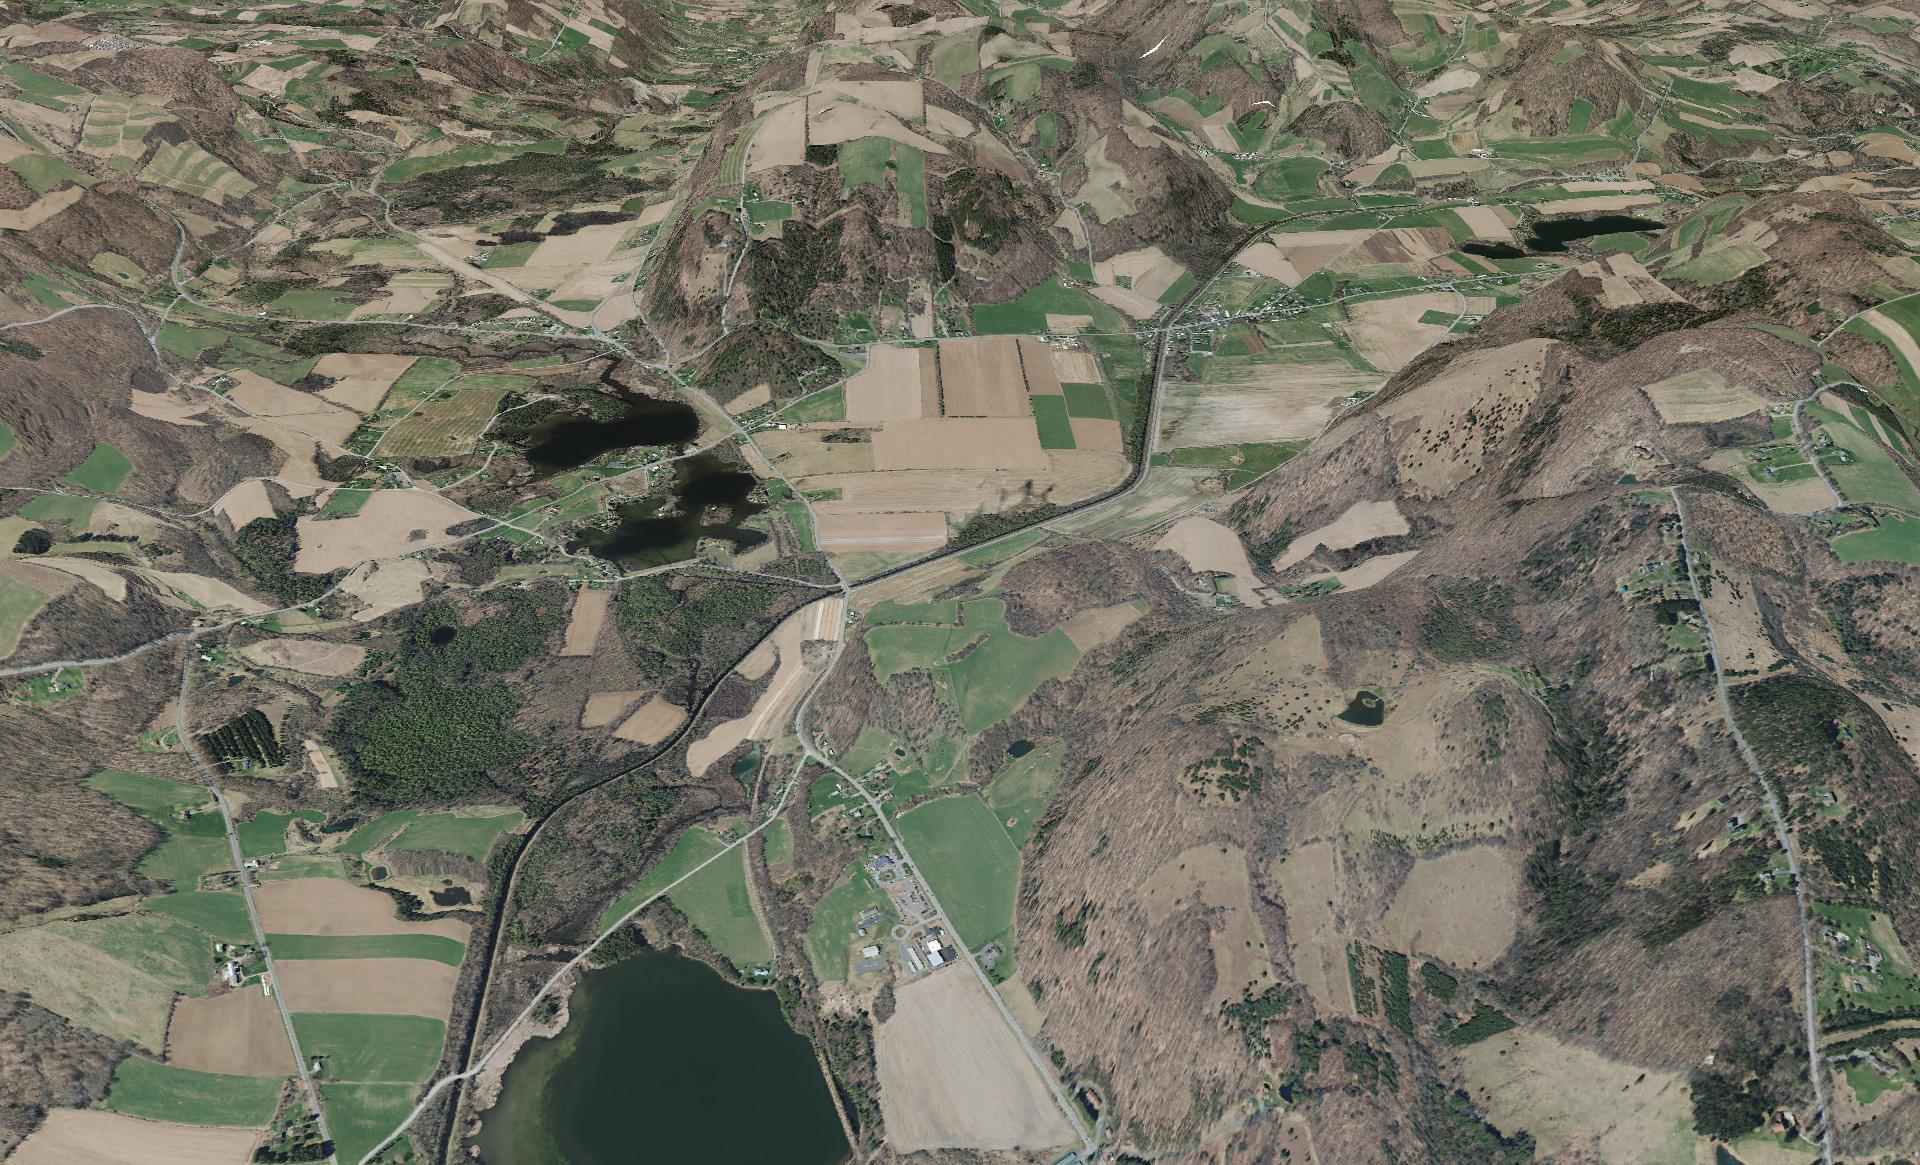
This shows a 3D rendering of the Buckville Canal north of Hamilton
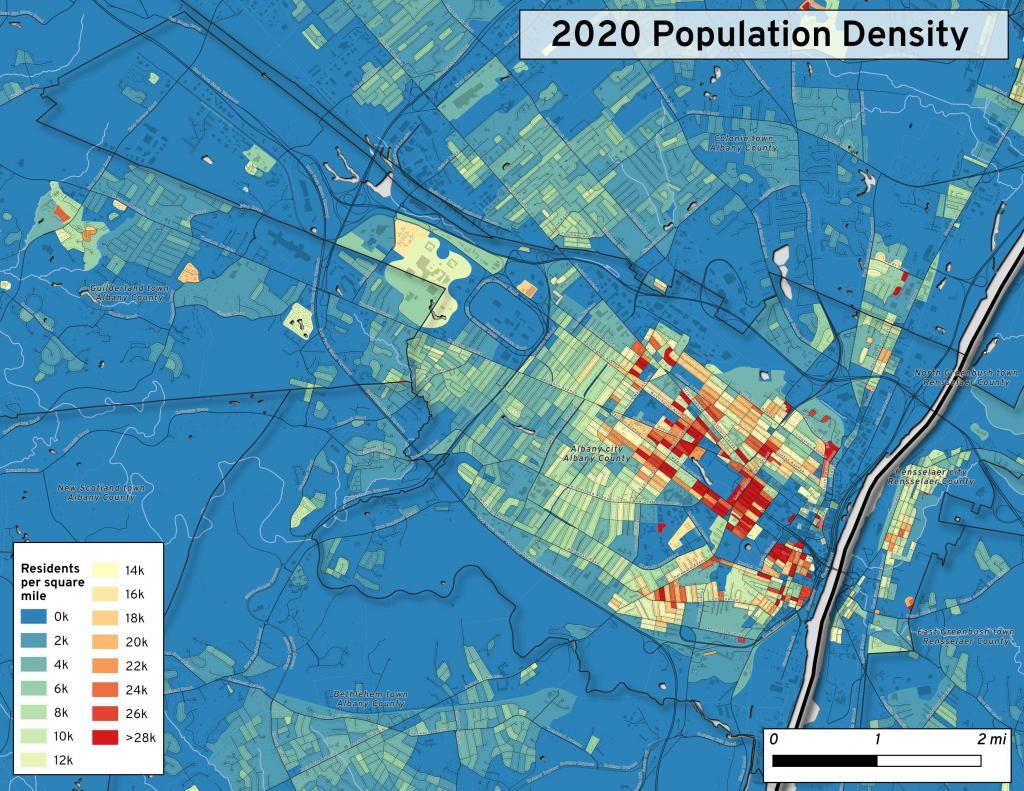
This map shows the use of 2020 PL 94-171 data to calculate population density in City of Albany.
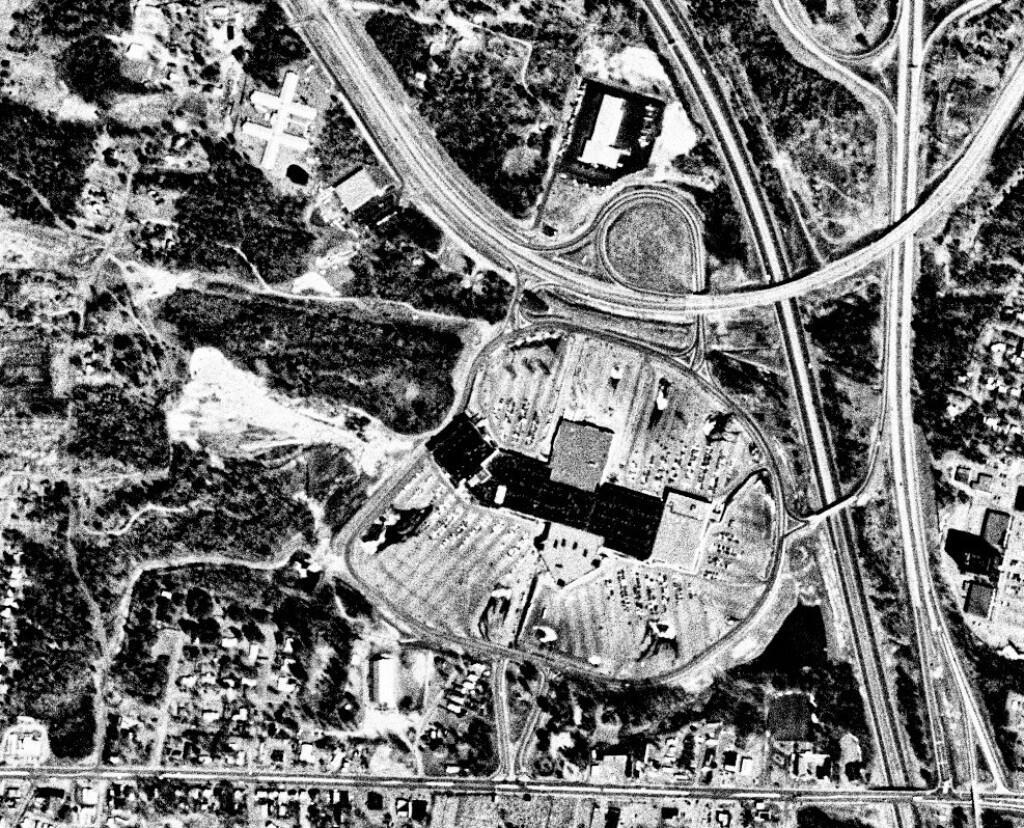
This 1985 aerial photo shows Crossgates Mall prior to it’s expansion.

This GIF image shows the change in unemployment during Coronavirus panademic.
This image shows hiking trails near Brooktrout, Falls Pond and Deep Lake.
Peebles Island, a Comparison 1952
3D Interactive of campsites at Moose River Plains.

Sample tax map in Albany.

Election results – 2020 Presidential Election, Onondoga County.

Map showing where sparklers are legally sold in New York.
Downtown Plattsburgh 1866 Beers (1866 Beers vs. 2020 OSM)
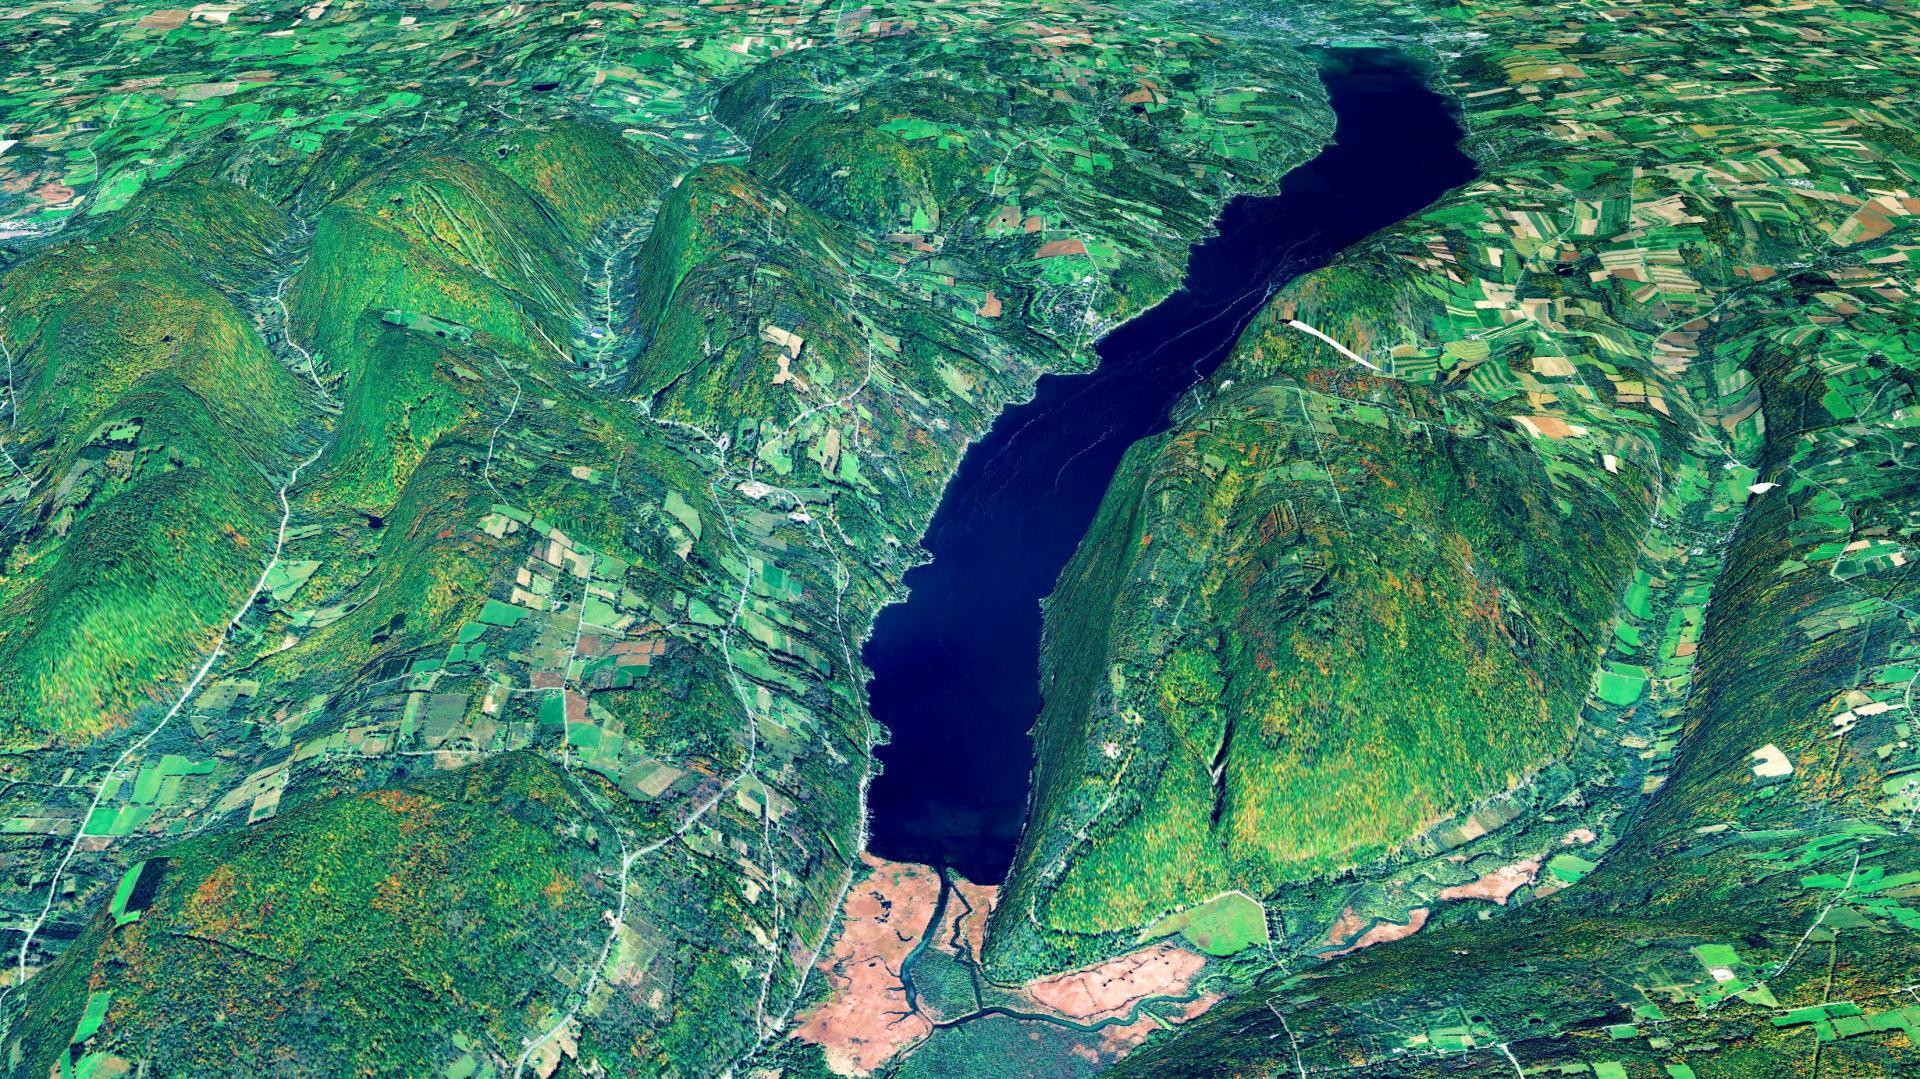
3D Rendering of Canandaigua Lake
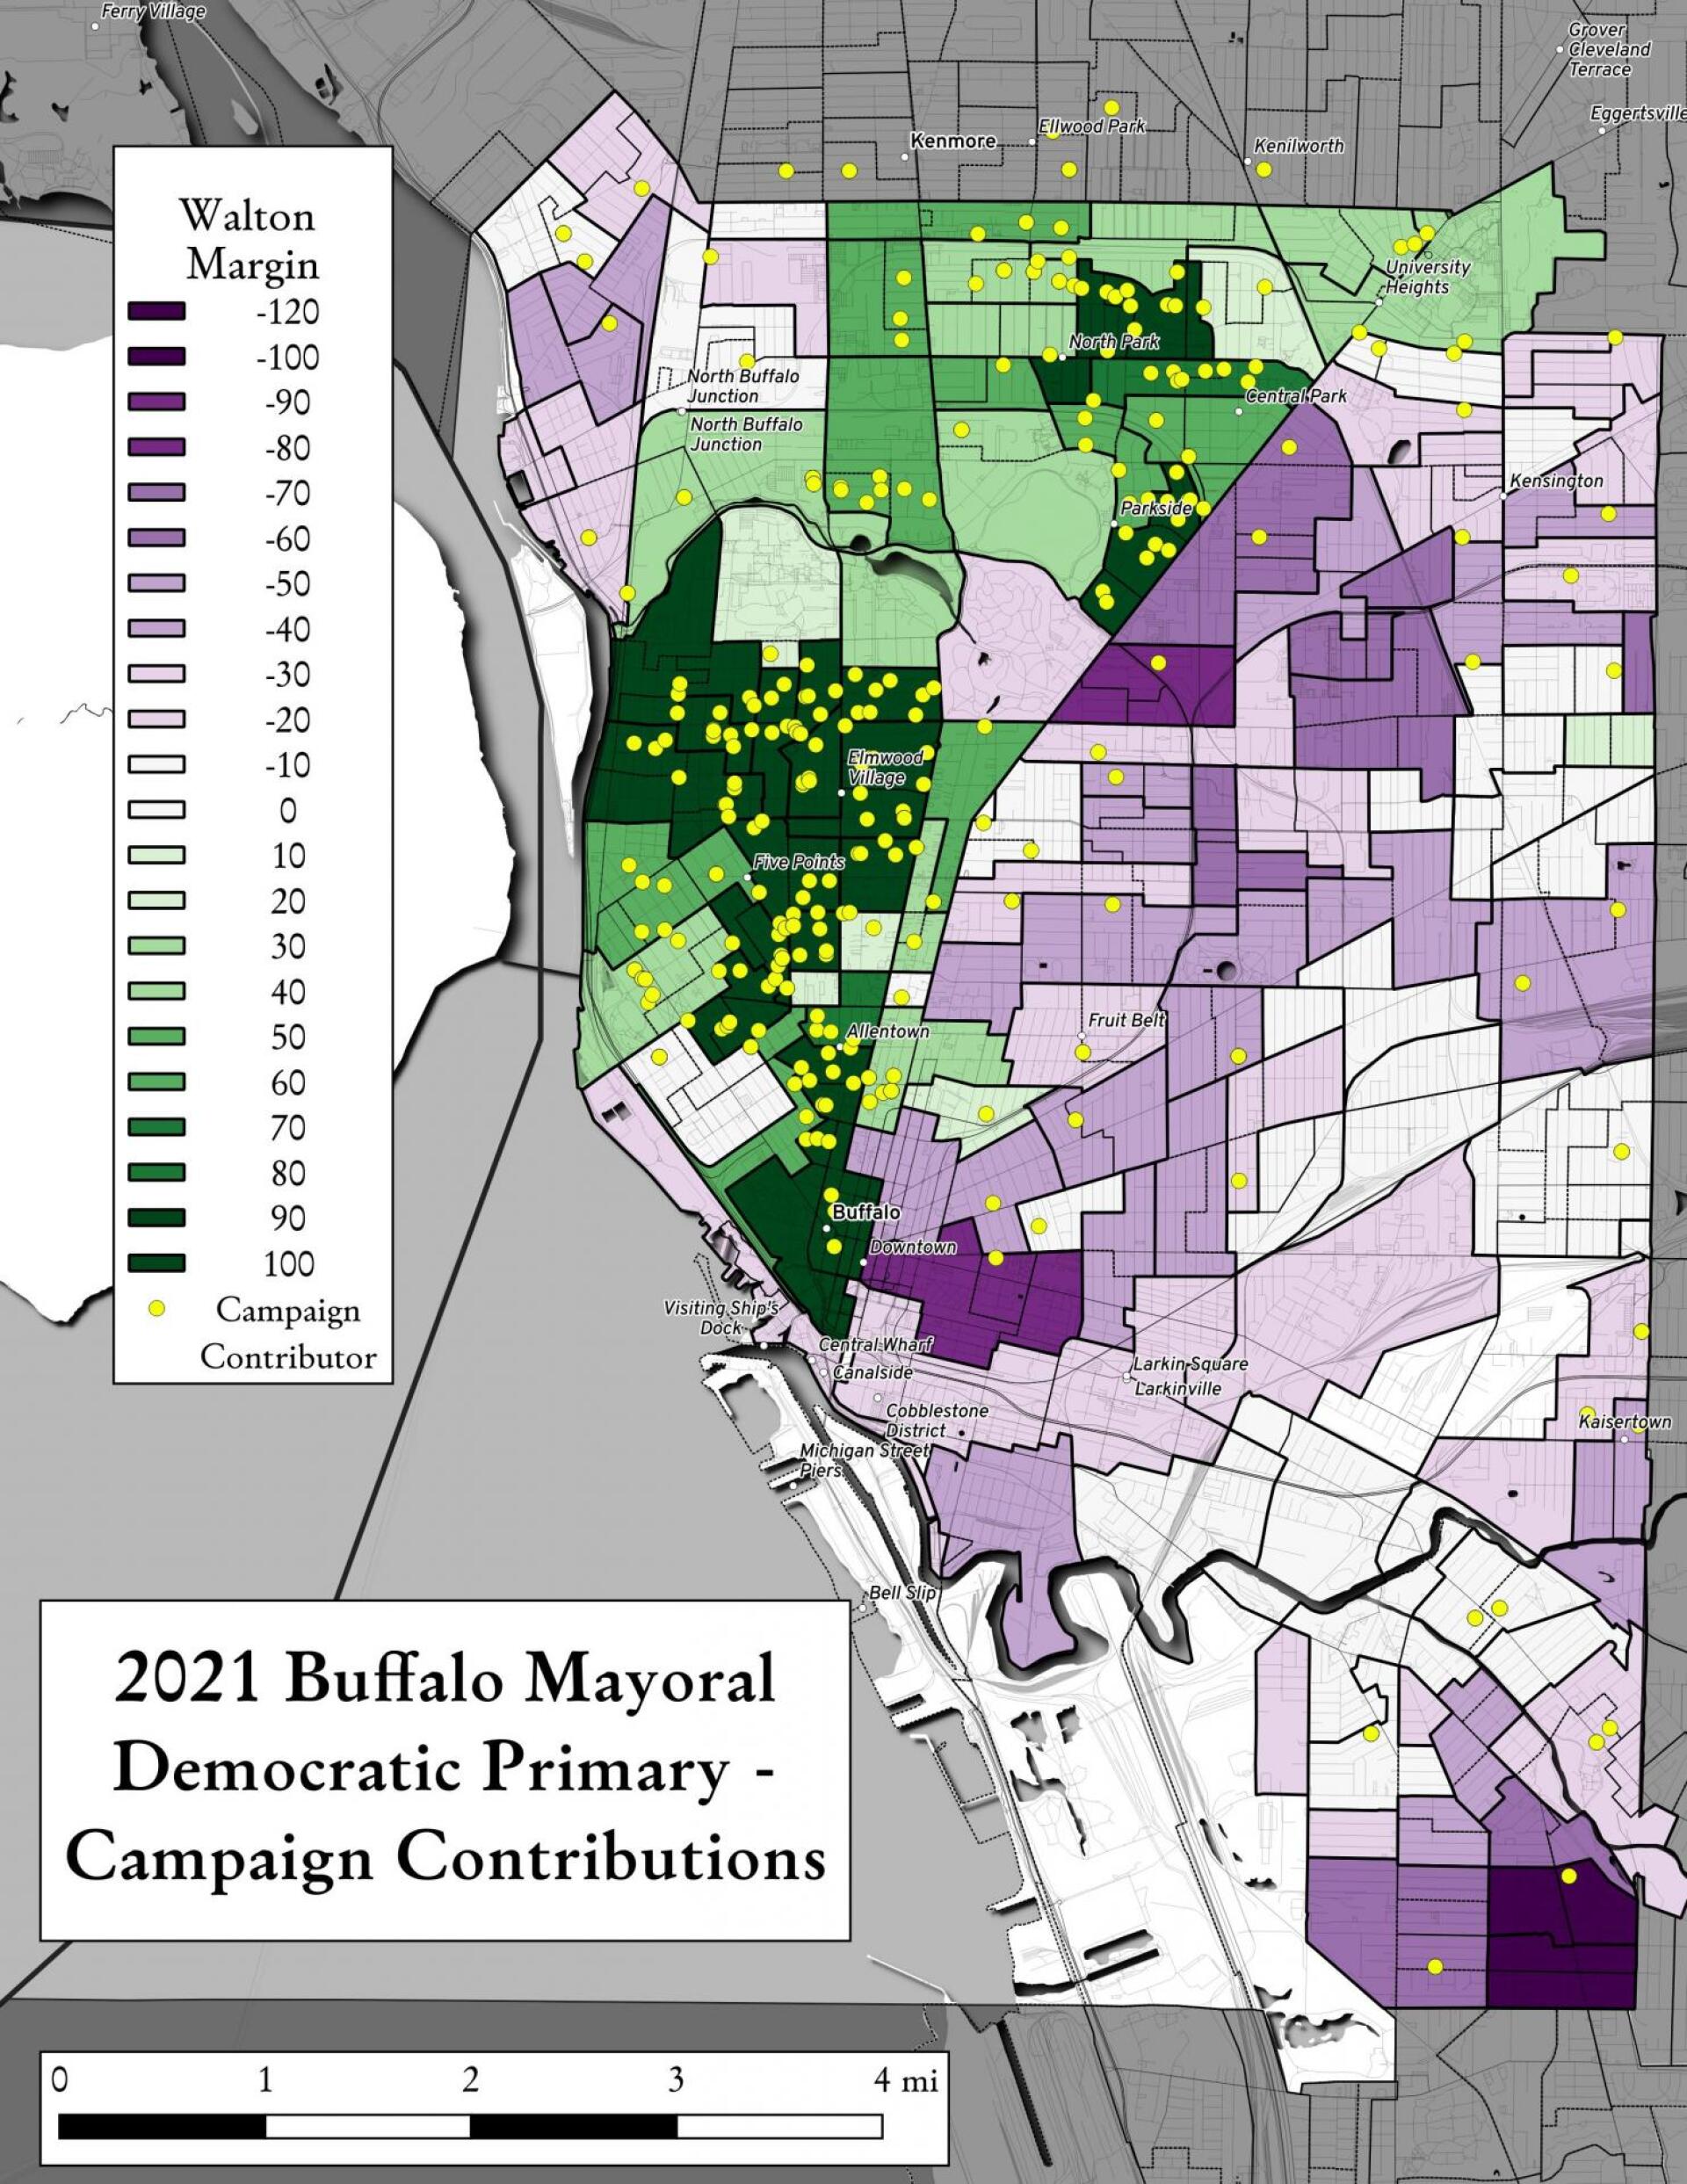
Map showing Buffalo Mayoral Primary results and campaign donors.
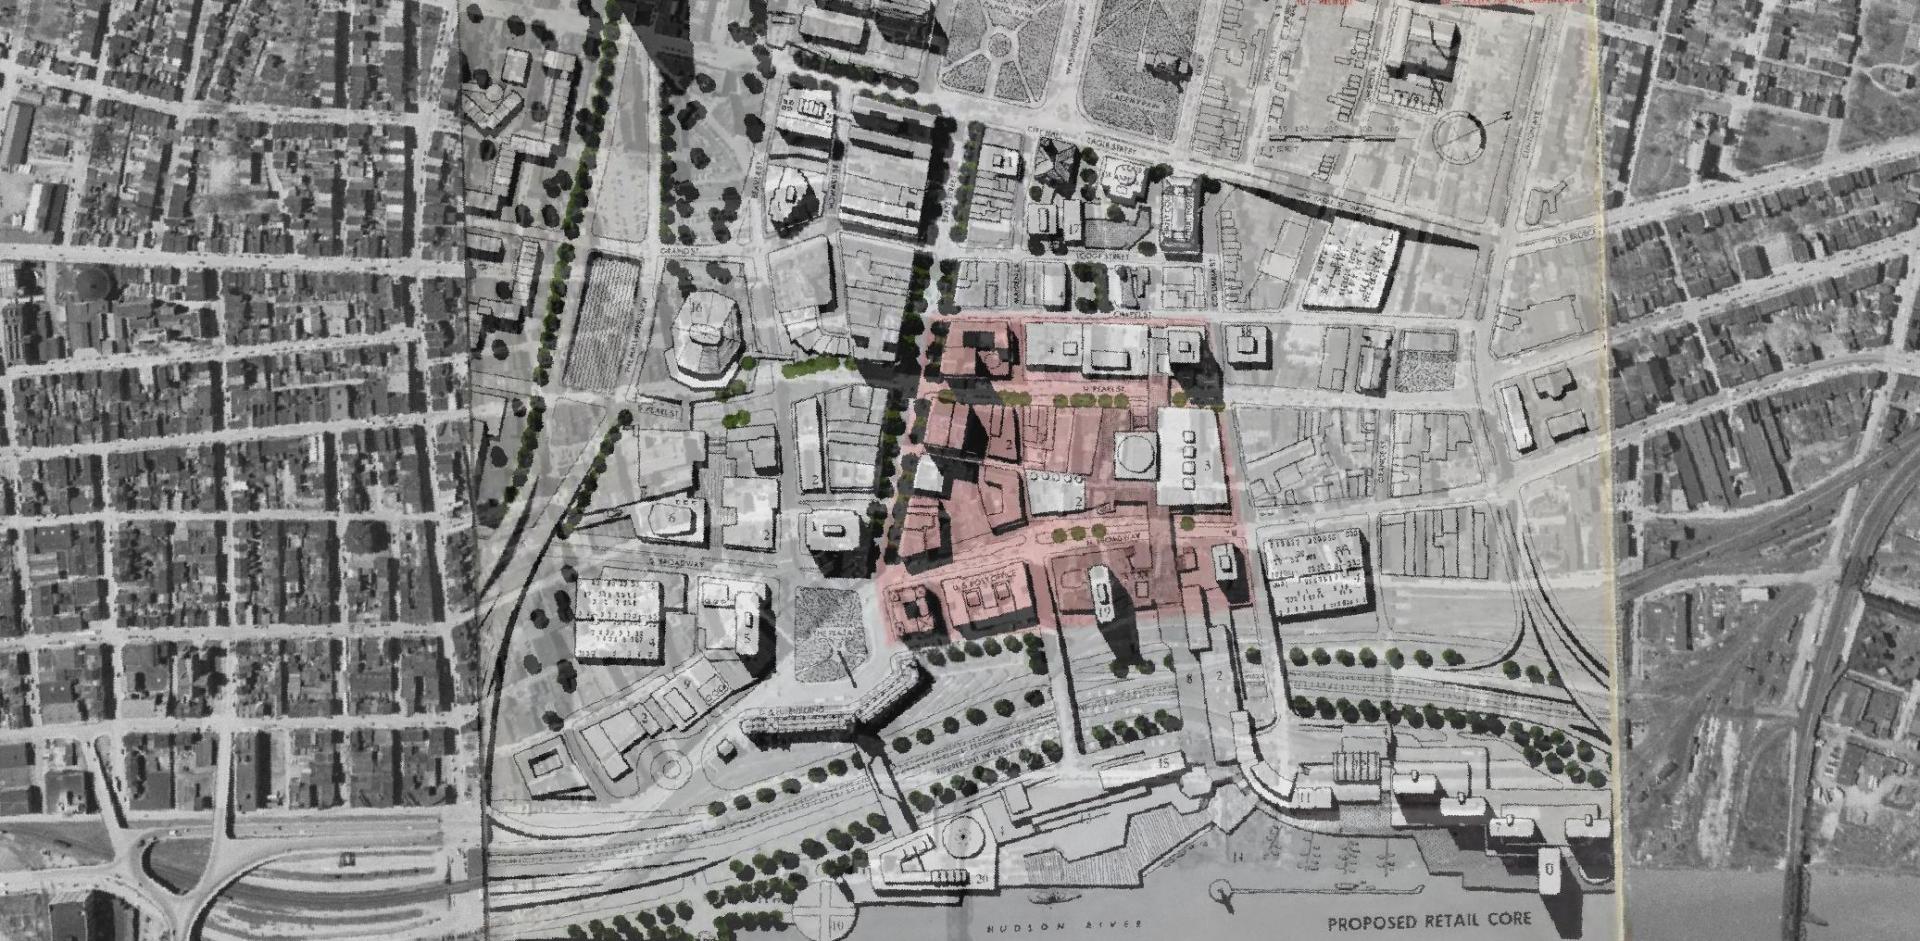
Overlay of Proposed Retail Core in 1963 Plan for the Capital City.

Map showing Local Area Unemployment Statistics – April 2020.
Interactive tax map in Delmar
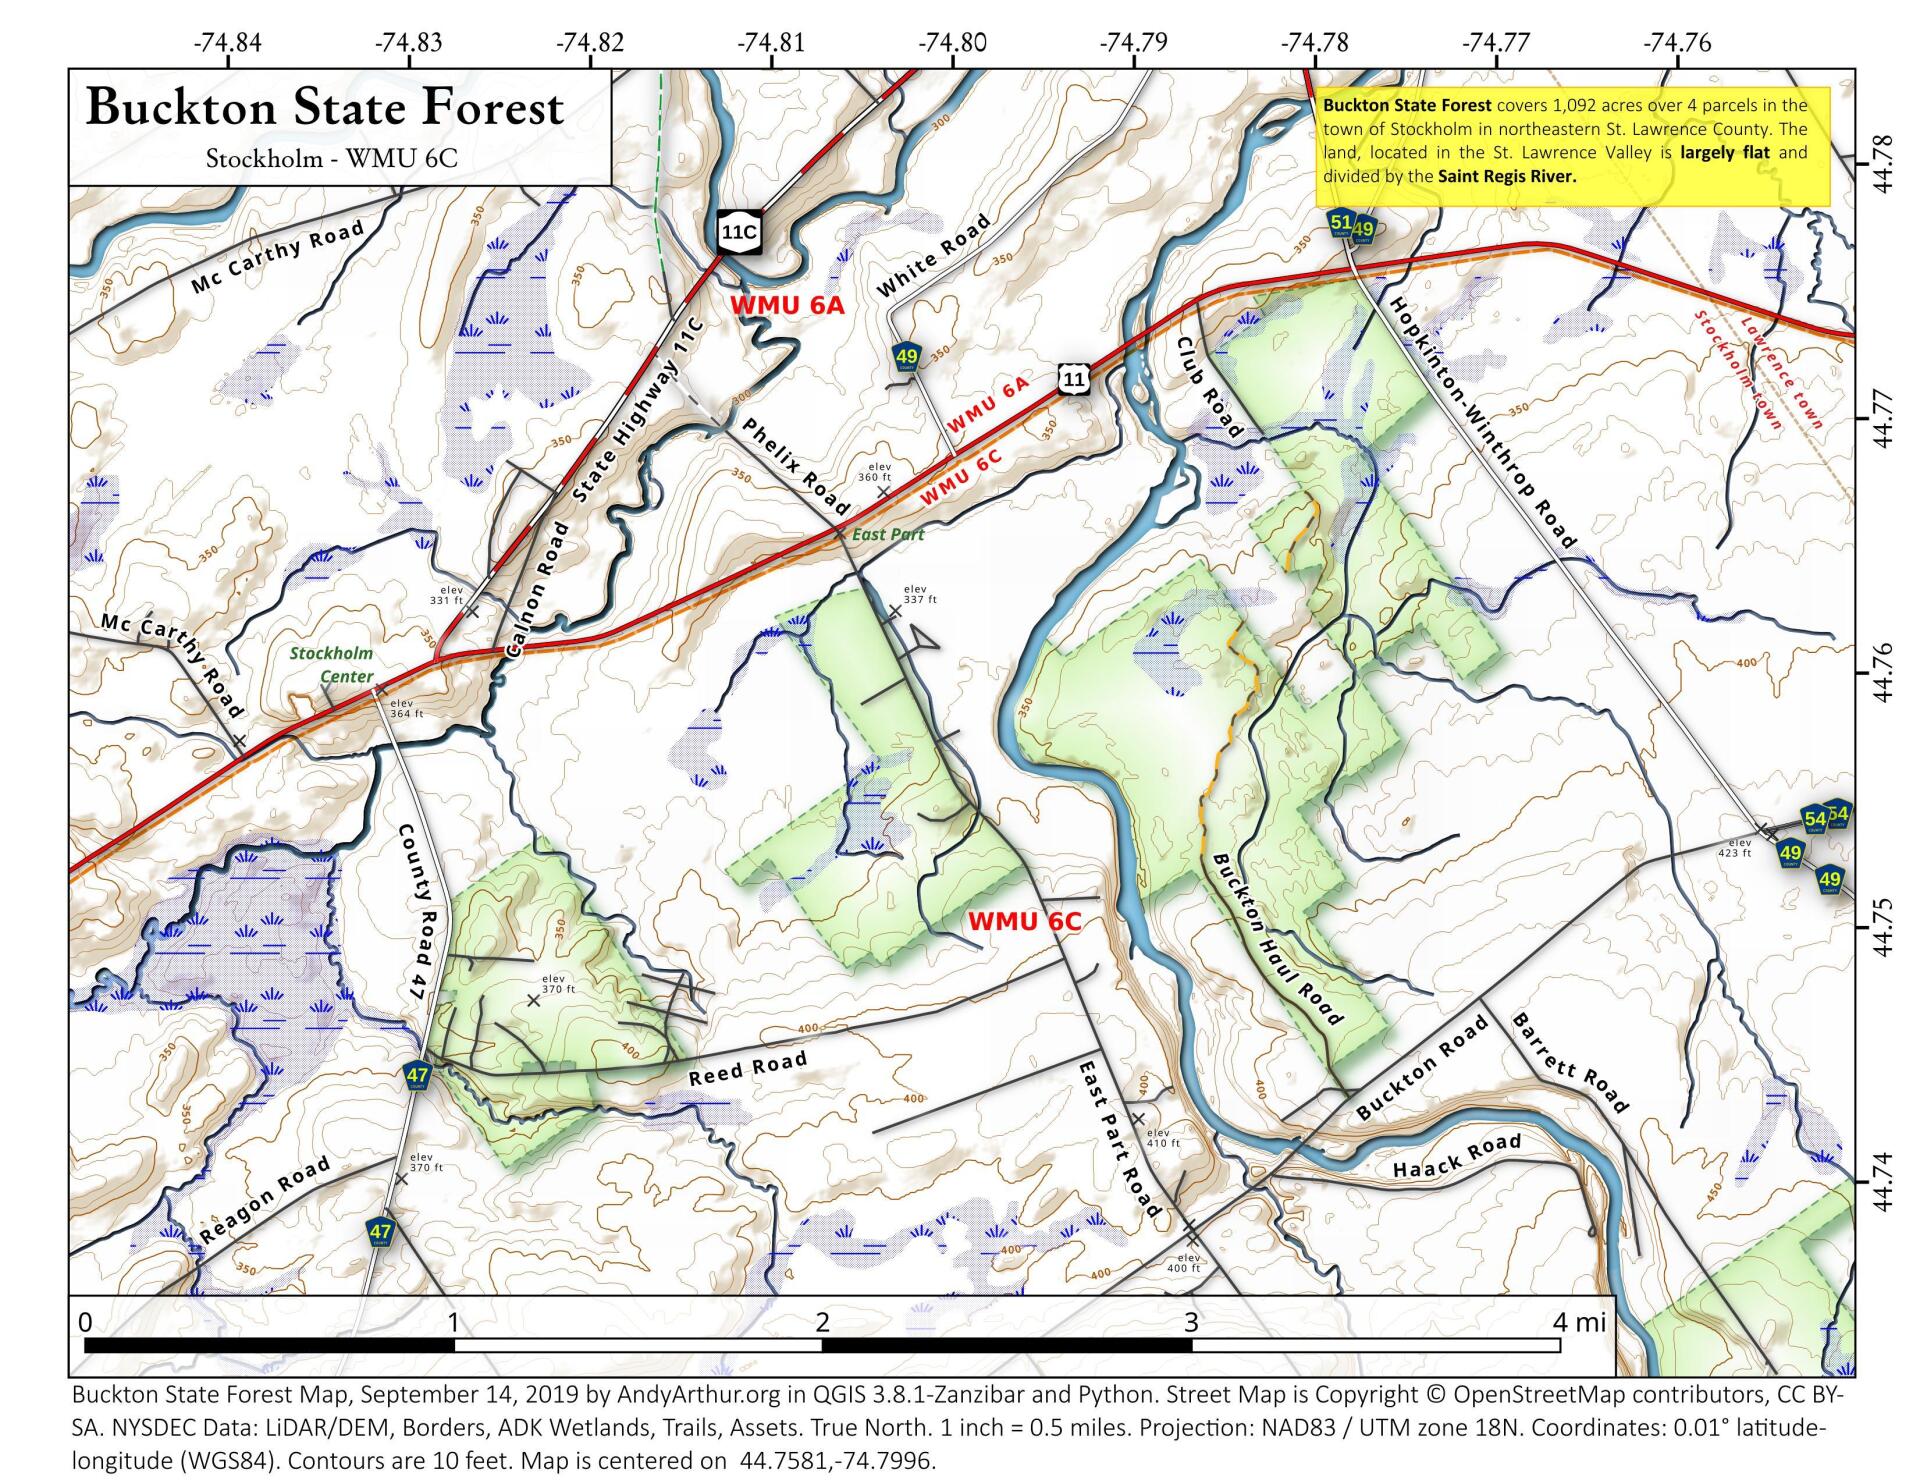
State Land in Stockholm, NY – Buckton State Forest.
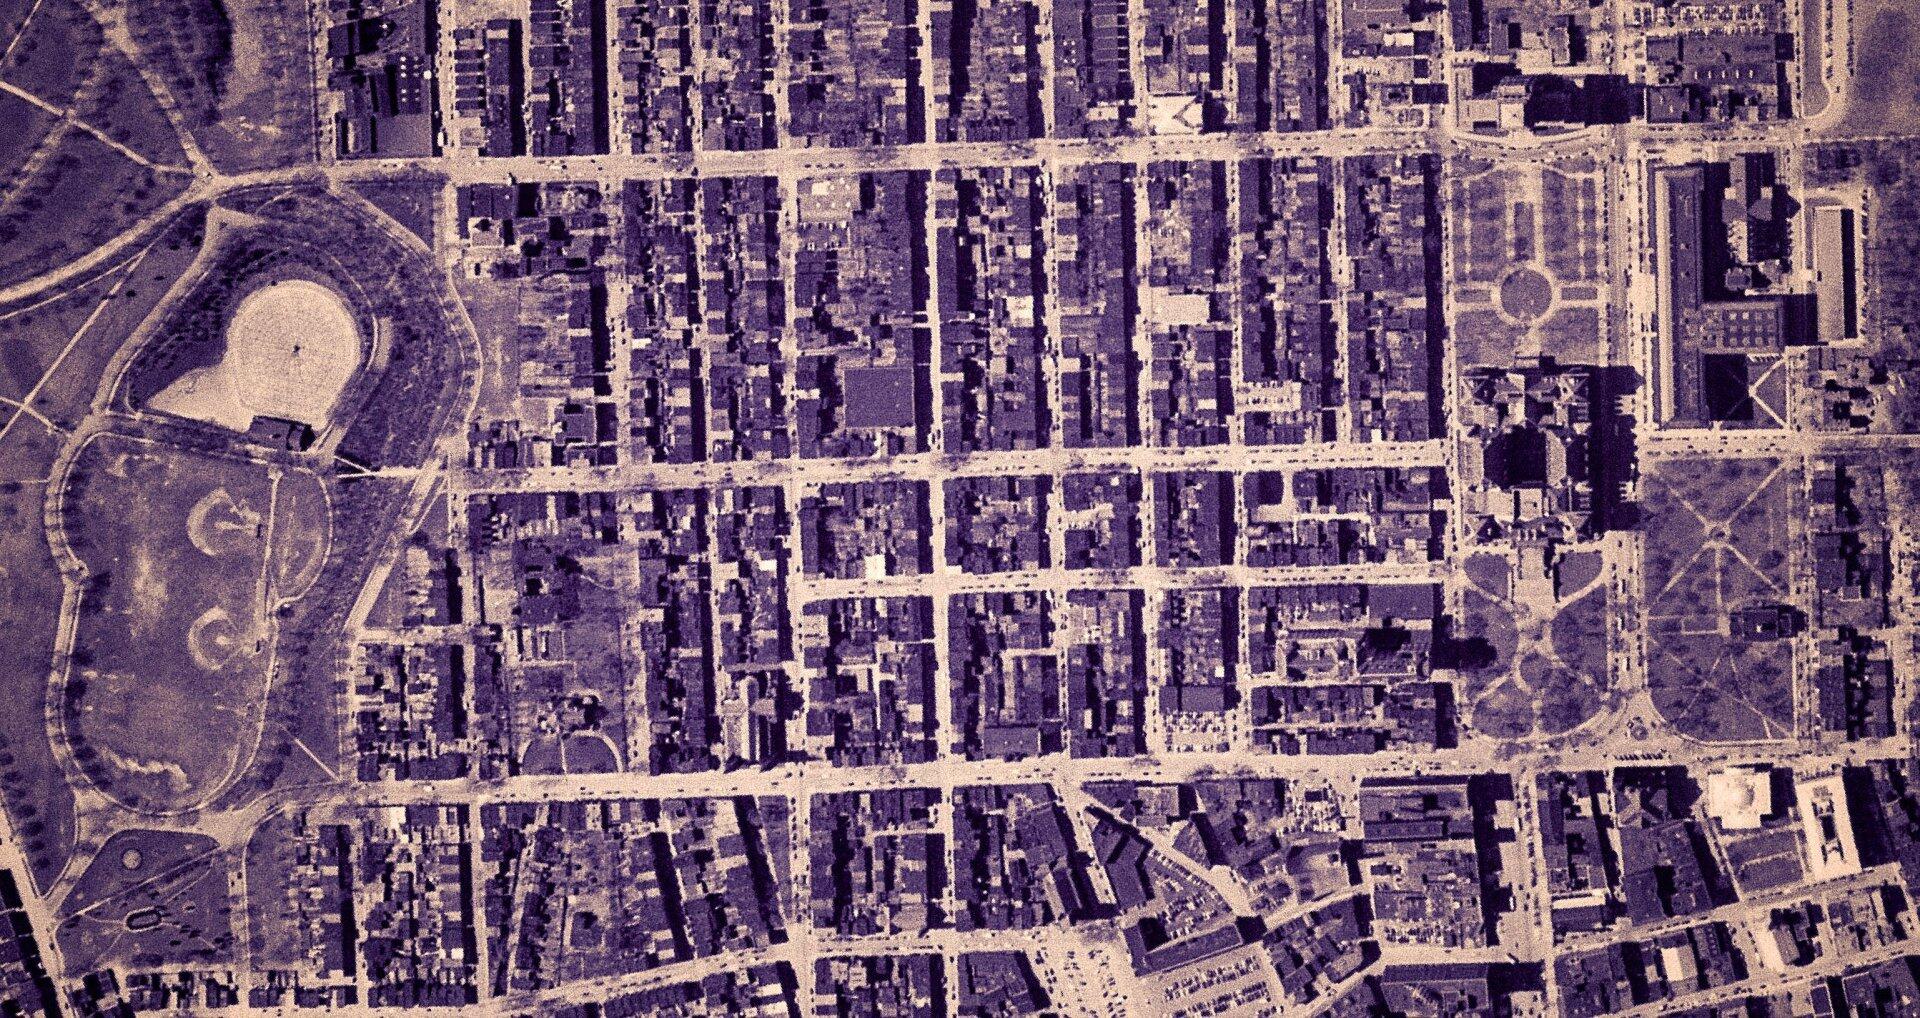
Empire State Plaza take area, 1952
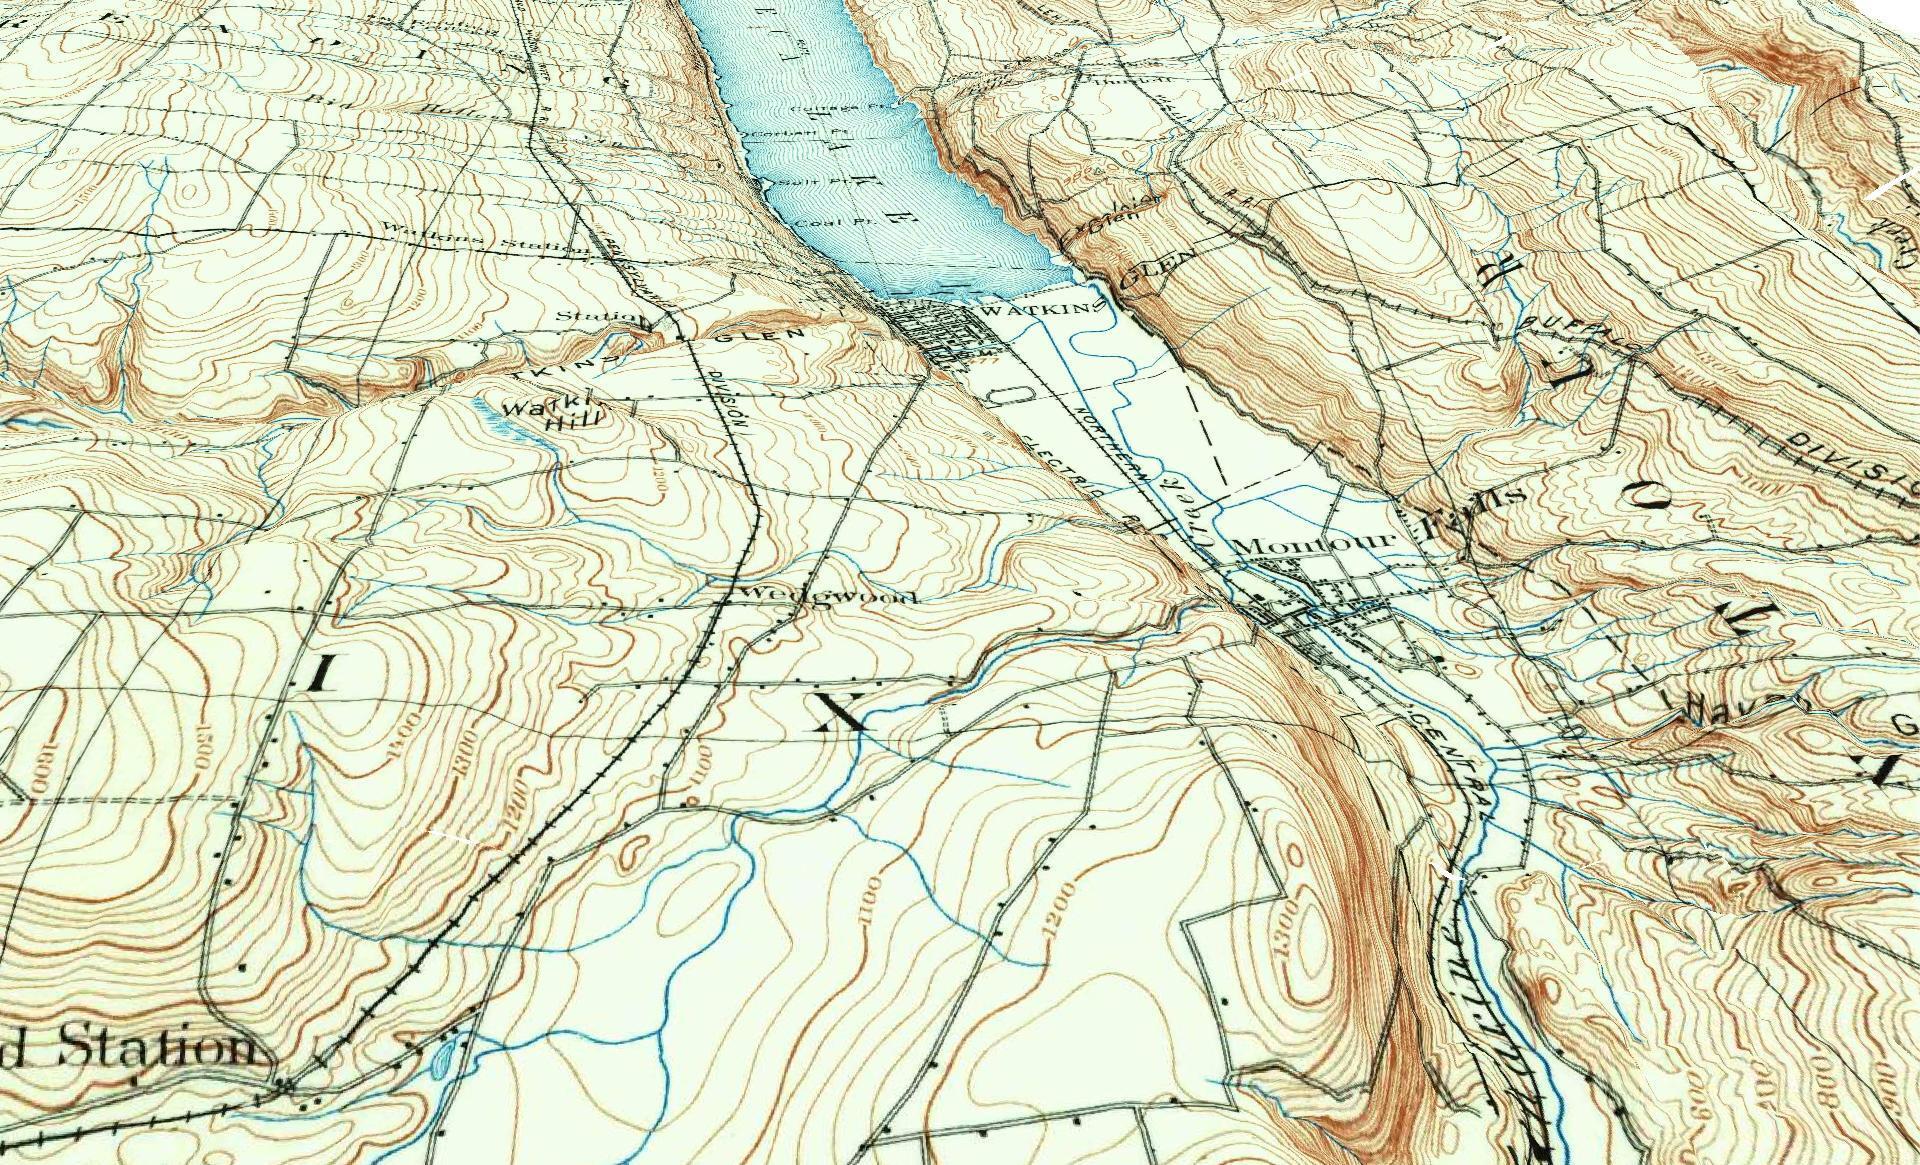
3D Rendering of the 1898 Watkins Glen Topographic Map
Examples of Data and Code
Properties in Albany Pine Bush Study Area,Excel Files: Various Tax Rolls,Find coordinates and political districts,Look Up State Tax Records and aScript for Processing RPTL 1520 PDFs.
Querying state property database, political enrollments, PL 94-171 Census files, calculating population statistics, what address is a district in, converting old districts to new districts.
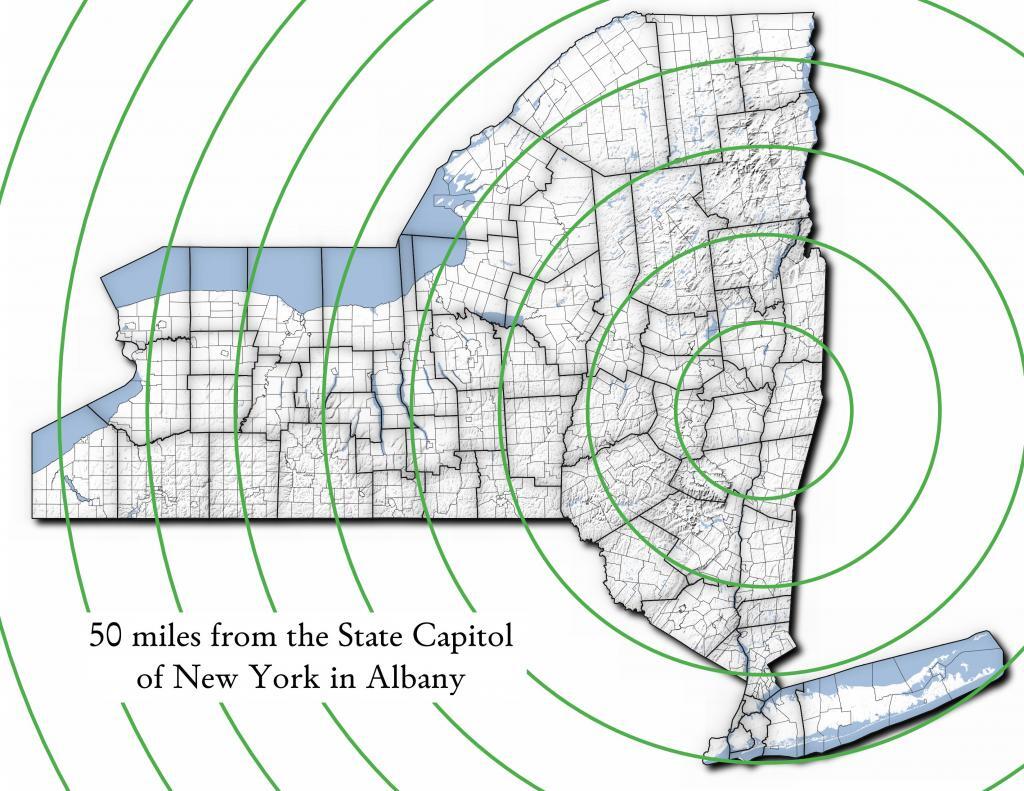
| Miles from Albany | millions population |
| 50 | 1.002 |
| 100 | 1.750 |
| 150 | 3.511 |
| 200 | 17.102 |
| 250 | 17.725 |
| 300 | 18.699 |
| 350 | 19.411 |
| 400 | 20.187 |
| 450 | 20.201 |
import pandas as pd
import geopandas as gpd

# path to overlay shapefile
overlayshp = r'/tmp/dis_to_albany.gpkg'

# summary level -- 750 is tabulation block, 150 is blockgroup
# large areas over about 50 miles much faster to use bg
summaryLevel = 150
#summaryLevel = 750

# path to block or blockgroup file
if summaryLevel == 150:
    blockshp = r'/home/andy/Documents/GIS.Data/census.tiger/36_New_York/tl_2020_36_bg20.shp.gpkg'
else:
    blockshp = r'/home/andy/Documents/GIS.Data/census.tiger/36_New_York/tl_2020_36_tabblock20.shp.gpkg'

# path to PL 94-171 redistricting geoheader file
pl94171File = '/home/andy/Desktop/nygeo2020.pl'

# field to categorize on (such as Ward -- required!)
catField = 'Name'

# geo header contains 2020 census population in column 90
# per PL 94-171 documentation, low memory chunking disabled
# as it causes issues with the geoid column being mixed types
df=pd.read_csv(pl94171File,delimiter='|',header=None, low_memory=False )

# column 2 is summary level
population=df[(df.iloc[:,2] == summaryLevel)][[9,90]]

# load overlay
overlay = gpd.read_file(overlayshp).to_crs(epsg='3857')

# shapefile of nys 2020 blocks, IMPORTANT (!) mask by output file for speed
blocks = gpd.read_file(blockshp,mask=overlay).to_crs(epsg='3857')

# geoid for linking to shapefile is column 9
joinedBlocks=blocks.set_index('GEOID20').join(population.set_index(9))

# store the size of unbroken blocks
# in case overlay lines break blocks into two
joinedBlocks['area']=joinedBlocks.area

# run union
unionBlocks=gpd.overlay(overlay, joinedBlocks, how='union')

# drop blocks outside of overlay
unionBlocks=unionBlocks.dropna(subset=[catField])

# create population projection when a block crosses
# an overlay line -- avoid double counting -- this isn't perfect
# as we loose a 0.15 percent due to floating point errors
unionBlocks['sublock']=unionBlocks[90]*(unionBlocks.area/unionBlocks['area'])

# sum blocks in category
unionBlocks=pd.DataFrame(unionBlocks.groupby(catField).sum()['sublock'])

# rename columns
unionBlocks=unionBlocks.rename({'sublock': '2020 Census Population'},axis=1)

# calculate cumulative sum as you go out each ring
unionBlocks['millions']=unionBlocks.cumsum(axis=0)['2020 Census Population']/1000000

# each ring is 50 miles
unionBlocks['miles']=unionBlocks.index*50

# output
unionBlocks
Land use in town of Berne (from 2016 National Land Cover Dataset)
Most highly assessed properties in Albany County …
from arcgis.features import FeatureLayer
lyr_url = 'https://gisservices.its.ny.gov/arcgis/rest/services/NYS_Tax_Parcel_Centroid_Points/MapServer/0'
layer = FeatureLayer(lyr_url)
query_result1 = layer.query(where="COUNTY_NAME='Albany' AND FULL_MARKET_VAL > 100000000",
                                    out_fields='PARCEL_ADDR,CITYTOWN_NAME,FULL_MARKET_VAL,OWNER_TYPE', out_sr='4326')

df=query_result1.sdf.sort_values(by='FULL_MARKET_VAL', ascending=False)
df['Full Market Value'] = df['FULL_MARKET_VAL'].map('${:,.0f}'.format)

df
| OBJECTID | PARCEL_ADDR | CITYTOWN_NAME | FULL_MARKET_VAL | OWNER_TYPE | SHAPE | Full Market Value | |
|---|---|---|---|---|---|---|---|
| 11 | 26652 | 64 Eagle St | Albany | 1204254925 | 2 | {“x”: -73.75980312511581, “y”: 42.650469918250… | $1,204,254,925 |
| 3 | 9150 | 1200 Washington Ave | Albany | 886298715 | 2 | {“x”: -73.81092293494828, “y”: 42.679257168282… | $886,298,715 |
| 4 | 10208 | 1400 Washington Ave | Albany | 642398287 | 2 | {“x”: -73.82369286130952, “y”: 42.685845700657… | $642,398,287 |
| 0 | 885 | 251 Fuller Rd | Albany | 440042827 | 2 | {“x”: -73.83559002316825, “y”: 42.690208093507… | $440,042,827 |
| 5 | 18164 | 632 New Scotland Ave | Albany | 377568201 | 8 | {“x”: -73.80381341626146, “y”: 42.655758957669… | $377,568,201 |
| 1 | 906 | 141 Fuller Rd | Albany | 321199143 | 2 | {“x”: -73.83323986150171, “y”: 42.693189748928… | $321,199,143 |
| 19 | 108087 | See Card 1067 | Watervliet | 280898876 | 1 | {“x”: -73.70670724174552, “y”: 42.719628647232… | $280,898,876 |
| 15 | 65380 | 737 Alb Shaker Rd | Colonie | 263916100 | 3 | {“x”: -73.80365248218001, “y”: 42.747956678125… | $263,916,100 |
| 9 | 21923 | 304 Madison Ave | Albany | 234265418 | 2 | {“x”: -73.76227373289564, “y”: 42.648000674457… | $234,265,418 |
| 2 | 907 | 201 Fuller Rd | Albany | 203426124 | 2 | {“x”: -73.83362605353057, “y”: 42.692609131686… | $203,426,124 |
| 16 | 69999 | 515 Loudon Rd | Colonie | 166065600 | 8 | {“x”: -73.74958475282632, “y”: 42.719321807666… | $166,065,600 |
| 7 | 20592 | 47 New Scotland Ave | Albany | 162276338 | 8 | {“x”: -73.77597163421673, “y”: 42.653565689693… | $162,276,338 |
| 6 | 20574 | 132 S Lake Ave | Albany | 146296360 | 2 | {“x”: -73.77970918544908, “y”: 42.654390366929… | $146,296,360 |
| 8 | 20597 | 113 Holland Ave | Albany | 143498501 | 2 | {“x”: -73.77306688593143, “y”: 42.650762742870… | $143,498,501 |
| 17 | 78203 | Mannsville | Colonie | 142570400 | 1 | {“x”: -73.71245452369443, “y”: 42.718124477080… | $142,570,400 |
| 18 | 95509 | 1 Crossgates Mall Rd | Guilderland | 130554700 | 8 | {“x”: -73.84702700595471, “y”: 42.687699053797… | $130,554,700 |
| 10 | 24521 | 86 S Swan St | Albany | 128436403 | 2 | {“x”: -73.75980563770365, “y”: 42.653931892804… | $128,436,403 |
| 13 | 46883 | 1916 US 9W | Coeymans | 110000000 | 8 | {“x”: -73.83388475575597, “y”: 42.488730743021… | $110,000,000 |
| 12 | 35152 | 380 River Rd | Bethlehem | 105263158 | 8 | {“x”: -73.76445503554325, “y”: 42.595925419330… | $105,263,158 |
| 14 | 65097 | 15 Wolf Rd | Colonie | 101967213 | 8 | {“x”: -73.81423716588279, “y”: 42.709939498581… | $101,967,213 |