Search Results for: Map
Make Your Maps in QGIS but use R and Tidycensus to Generate Census Shapefiles 🗺
Make Your Maps in QGIS but use R and Tidycensus to Generate Census Shapefiles 🗺
Why choose when you can have it all? Seriously, QGIS makes it easy to move labels as you like and do the styling of the Shapefile or GeoPackage you generate in R with tidycensus and sf.
library(tidycensus)
library(sf)
lowincome <- get_acs(
geography = “state”,
table = ‘B19001’,
year = 2020,
output = ‘wide’,
survey = “acs5”,
geometry = TRUE);
lowincome$under30k <- ((lowincome$B19001_002E +lowincome$B19001_003E+ lowincome$B19001_004E+ lowincome$B19001_005E+ lowincome$B19001_006E) /lowincome$B19001_001E)*100
lowincome %>% write_sf(‘/tmp/under30k.gpkg’)
With the above R code, it will generate a GeoPackage (use extension .gpkg) or Shapefile (use extension .shp) you can use to make your map in QGIS. Then in QGIS if you want to simplify the output, you can use a geometry generator in the styles:
simplify($geometry,0.003)
Or you can specify the simplification in the R script when you run get_acs(), as it is a wrapper around the tigris package:
lowincome <- get_acs(
geography = “state”,
table = ‘B19001’,
year = 2020,
output = ‘wide’,
survey = “acs5”,
geometry = TRUE,
resolution = ’20m’,
);
Neat ! R and QGIS are great tool to use together.
Largest Range In Elevation
Towns in the Eastern Adirondacks and Eastern Catskills have the greatest change in elevation in their borders. This is done with 100 meter digital elevation model, so this does not include peaks -- but a comparison of general height of land in one part of the town compared to another.
Data Source: 100 meter Digital Elevation Model of New York. CUGIR. https://cugir.library.cornell.edu/
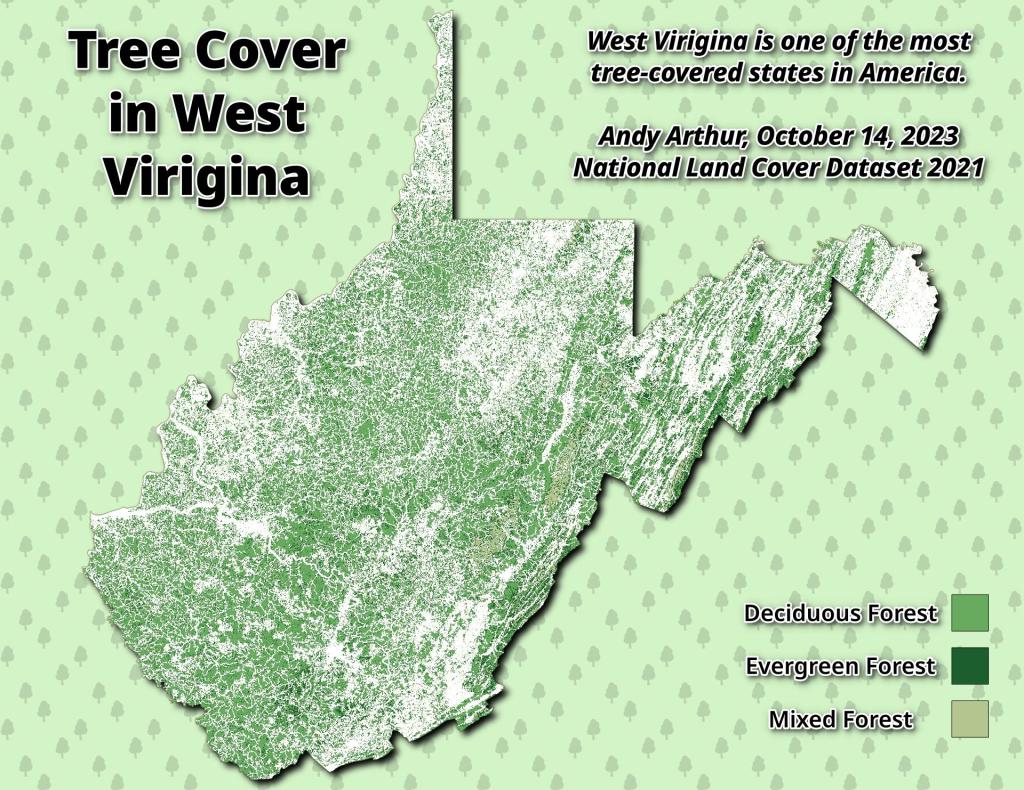
West Viriginia Tree Cover
Final USGS DRG Topographic Map Update
Back when I was in Boy Scouts, we often used 1:24k quadrangle topographic maps from the USGS. These maps from the pre computer age, manually drafted, they are no longer updated in favor of GIS data sets and the computer created National Map product. Some of the trails and landmarks not in the GNIS dataset never made it over to the new maps - especially on state land. And the National Map topographic maps are hardly the works of art that many the old topographic maps were.
You can download both the historical and modern maps for free here http://prd-tnm.s3.amazonaws.com/index.html?prefix=StagedProducts/
The Real Powers of R Statistical Language for Map Making
There are two major — and distinct ways that the R Statistical language is a powerful tool for map making — either paired with QGIS or without.
When you should use R Statistical Language with QGIS
If you are looking for a more complicated map, one of the best ways to process and wrangle map data, Shapefiles and other geographic data is within R Studio. Much of the prep work for making a map is best down in R as you can type commands quickly, pipe and mutate data, dissolve and buffer shapes easily with R and the sf package. No mouse clicks required. It’s easy to save repeated processes in an R script.
Then once the data is ready to be mapped, export it to a geopackage or shapefile, usually which I store in the /tmp directory, as I don’t need to save the data as I can quickly re-create it with the R script. From there, I can load it into QGIS, then make the map look pretty, manipulate the styling and labeling in QGIS.
When you should use R Statistical Language Alone
R with ggplot is good for simple maps, and those you want to run off frequently with updated data, and aren’t concerned with pretty labeling. Basic, clear thematic maps where labels aren’t needed or the automatic labeling of ggrepel can be tolerated due to relatively few label overlaps. In many cases, for basic maps, ggplot makes a cleaner output, lines things up better and produces better output out of the box then what you might quickly throw together in QGIS from exported data in R.
Why I don’t use R scripting in QGIS directly
While it’s possible to do R scripting in QGIS, I would rather work in RStudio with it’s preview windows, code completion and other tools rather the use QGIS. It’s just easier to do the data wrangling and manipulation of shapefiles in RStudio, and then export to a Geopackage and load the final data in QGIS.
Digital Terrain Models
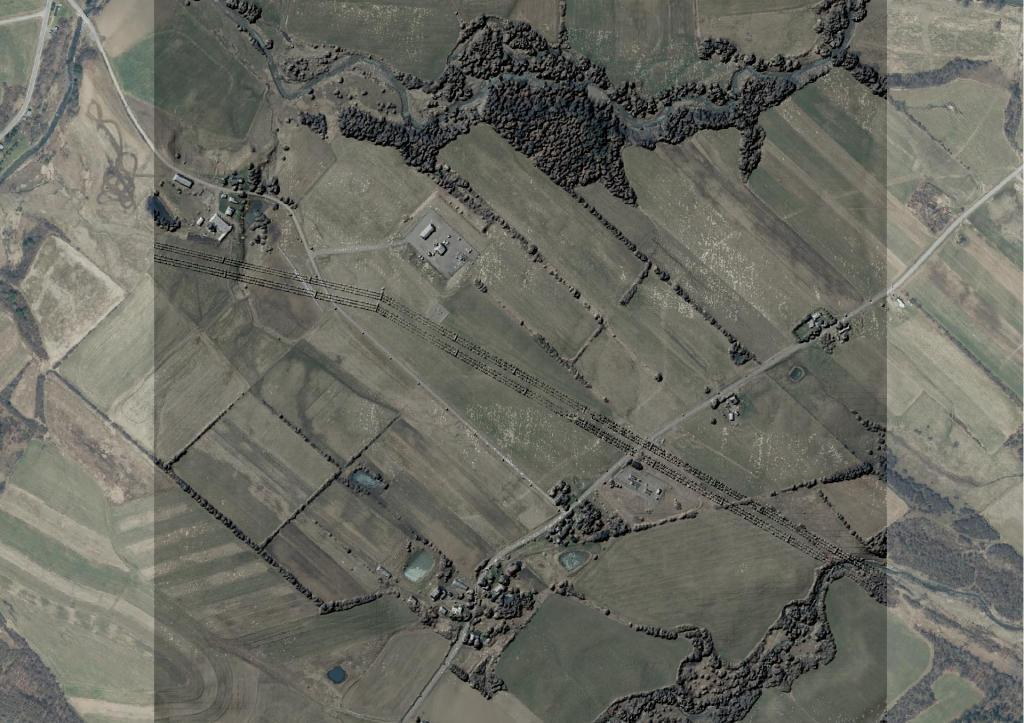
Lately I have been experimenting with digital terrain models extracted from the LIDAR point cloud. It allows me to measure the height of buildings and tree cover and can be used for better 3d modeling.