The other day I was curious to see how much of New York State would be underwater if the sea rose by 300 feet. While Long Island and New York City, along with towns along the Hudson River would be heavily impacted, much of the state would remain dry with 300 feet of sea rise.
Data Source: Digital Elevation Models, New York State. https://cugir.library.cornell.edu/catalog/cugir-008186
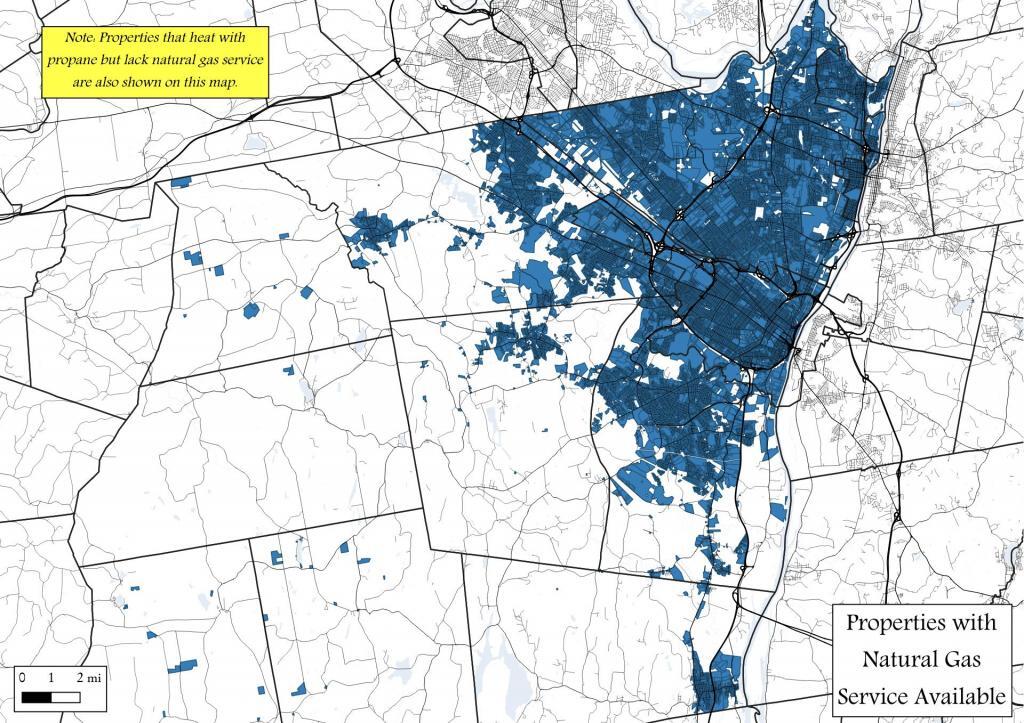
I thought it would be interesting to see how far out gas service goes across Albany County. It turns out that most urban and suburban properties in the county are serviced by gas lines.
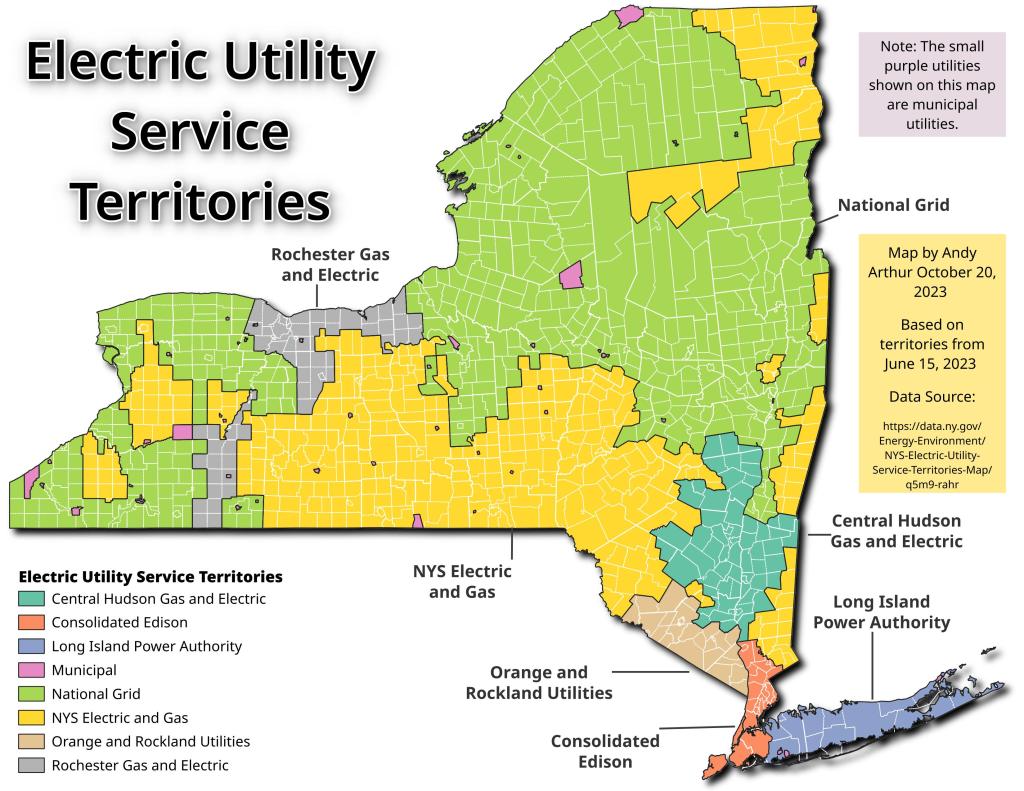
This interactive map shows the Utility Service Territories in New York State, including that of National Grid,
Rochester Gas and Electric, NYS Electric and Gas, Central Hudson Gas and Electric, Orange and Rockland Utilities, Long Island Power Authority, Consolidated Edison and municipal utilities.
For more detail, please see interactive KML Maps: NYS Electric Utility Service Territories Map
Data Source: NYS Department of Public Service. https://data.ny.gov/Energy-Environment/NYS-Electric-Utility-Service-Territories/q5m9-rahr
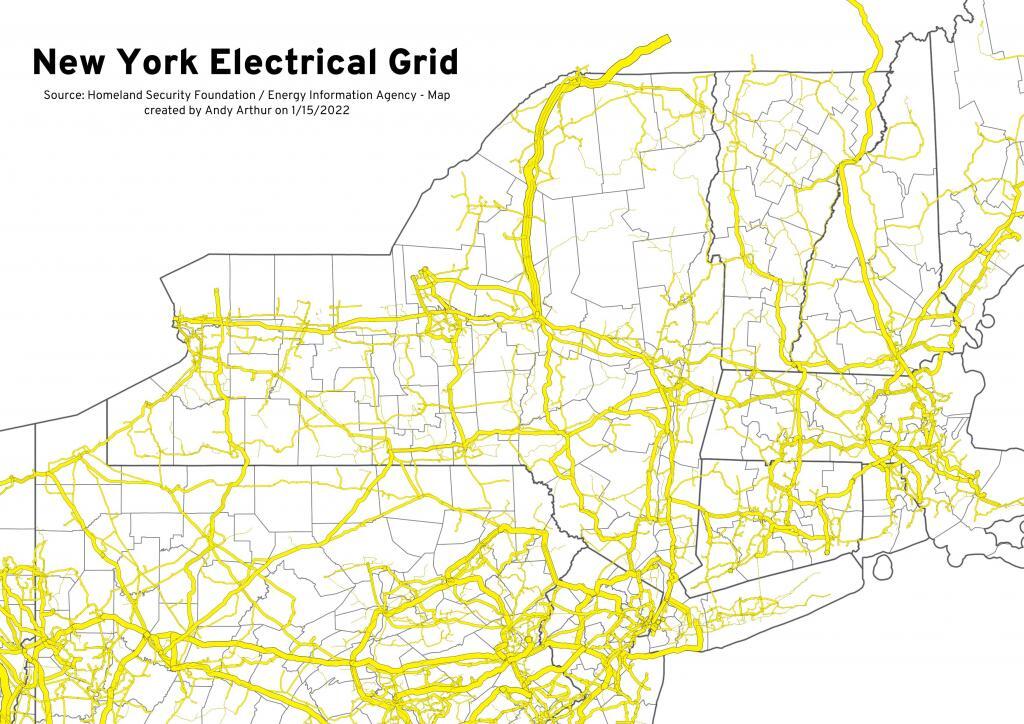
This map shows the major power lines that move electricity through New York State and New England.
Brunner Island Steam Electric Station is a coal-fired electrical generation facility in York County, Pennsylvania. It occupies most of the area of the eponymous island on Susquehanna River. The power plant has three major units, which came online in 1961, 1965, and 1969, with respective generating capacities of 334 MW, 390 MW, and 759 MW (in winter conditions). In addition, three internal combustion generators (2.8 MWe each) were installed in 1967. Talen Energy will stop coal use at the plant in 2025.
https://en.m.wikipedia.org/wiki/Brunner_Island_Steam_Electric_Station
The average yearly high temperature is the average of daily high temperature throughout the year in New York State. A cold weather climate state, the average high temperature is between 35 and 55 degrees depending on what part of the state you are in. It is on average 20 degrees warmer in New York City then in the High Peaks of the Adiroondacks. This interactive map can be zoomed in see the average temperature where you live in the state.
Data Source: This coverage contains data representing areas (polygons) of Average Temperature for the period 1971-2000. The data has been converted from grids to polygons. Purpose: Display and/or analyses requiring spatially distributed Average Temperature for the climatological period 1971-2000. From the The PRISM Group at Oregon State University. https://datagateway.nrcs.usda.gov/GDGOrder.aspx?order=QuickState